Price M42 limited
- Indicadores
- Dmitriy Gurenko
- Versão: 1.3
- Atualizado: 7 setembro 2018
A comprehensive tool for determining the levels of support, resistance, reversals in relation to trading sessions. The indicator's thesis can be expressed as follows:
"Support and resistance levels are undoubtedly formed by the psychological barriers of market participants, and influence the further behavior of the price. But these barriers are different for different groups of traders (One man's meat is another man's poison) and can be grouped by territory or by the trading time".
Following the thesis, the indicator detects levels and processes data separately for three trading sessions: Asian (including Pacific), European and American.
The User Manual of the indicator is located on the discussion page of the full version.
The indicator contains the following subsystems, which can be used either independently or in any combination:
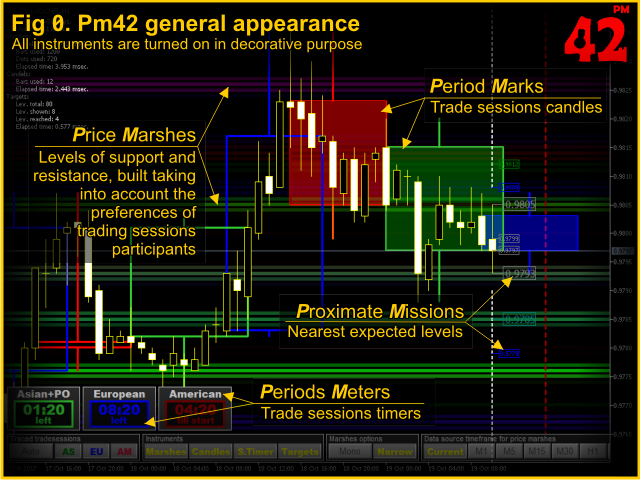
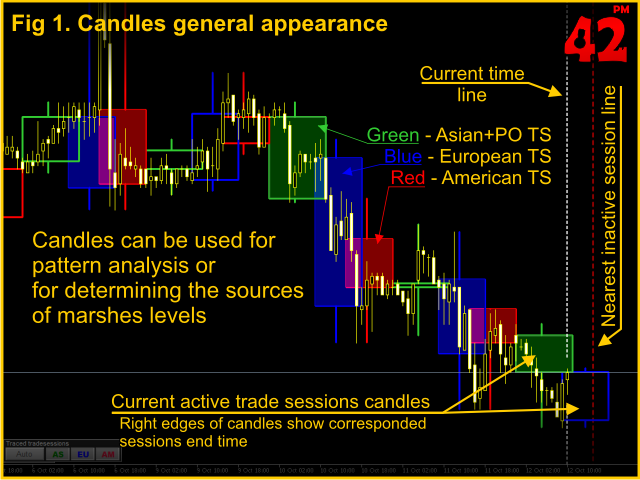
- Period Marks: Candles of trading sessions - group and display the data of each trading session in the form of a Japanese candle. Candles can be used for pattern analysis or to visually identify the signal source.
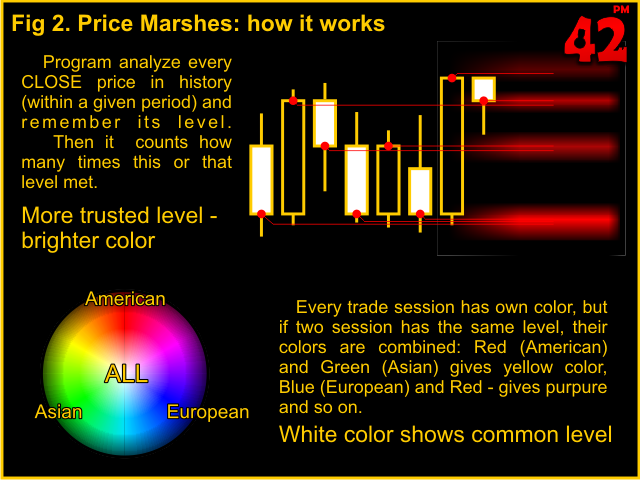
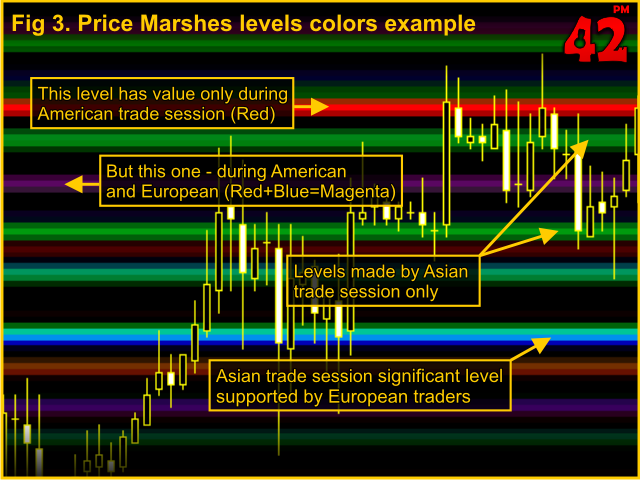
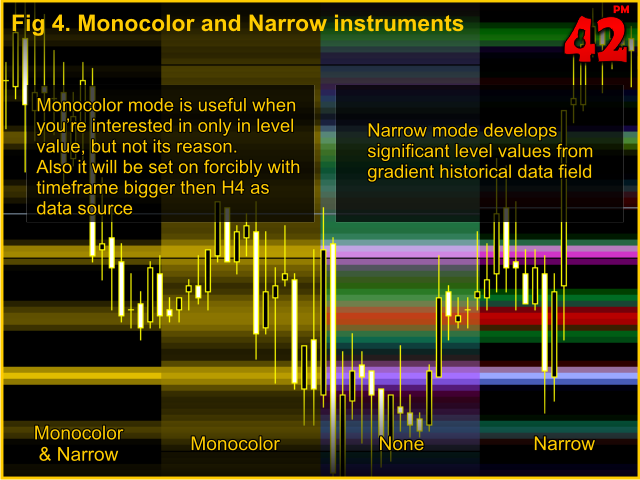
- Price Marshes: Support and Resistance Levels - displays support/resistance levels in the form of a gradient field of horizontal lines, the color of which depends on the trading sessions in which this level occurred. The color density is directly related to the number of confirmations of this level. The periods of the level sources can be selected from the range "M1" to " W1".
- Proximate Missions: Nearest targets - displays the value of the two nearest levels from the top and bottom to the right of the last bar. Levels are filtered by the current trading sessions (levels of inactive trading sessions are not displayed) from the Price Marshes data.
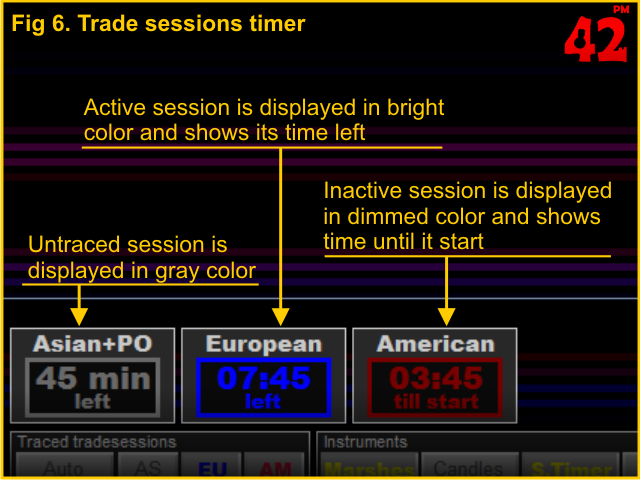
- Periods Meters: Timers of trading sessions - displays the status of trading sessions and the time before their start/end.
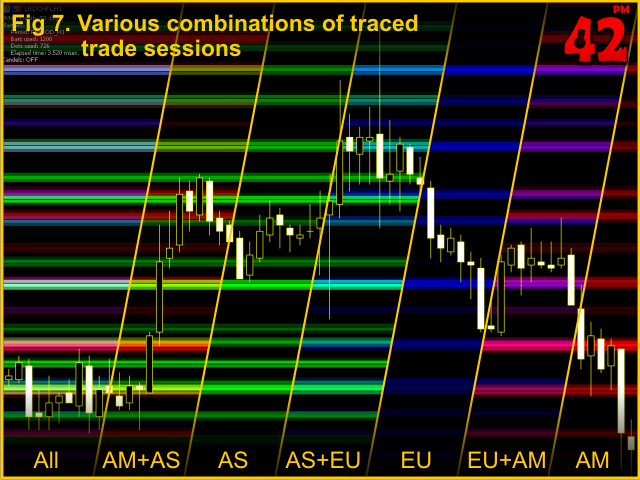
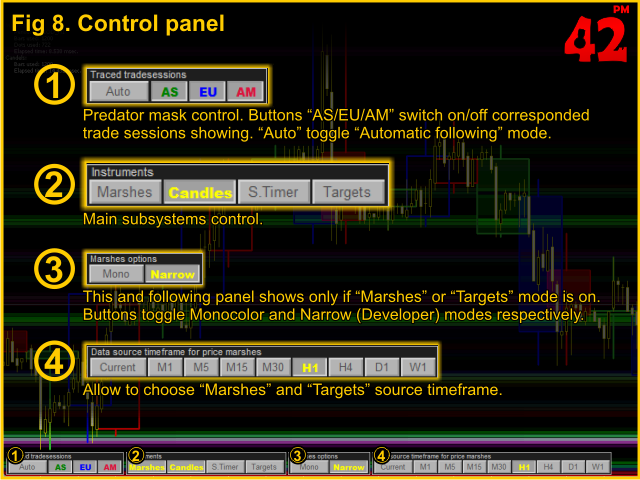
- Predator Mask - controls the display of sessions in the above tools, allowing you to view data only for selected (or excluding selected) trading sessions.
Inputs
The indicator uses the only input parameter Analysis depth (days). Other settings and mode changes are made via the screen interface of the indicator.
- Analysis depth (days) - depth of analysis in days.
Trading sessions
The indicator uses the following parameters of trading sessions:
| Trading session | Session time (GMT) | Color on the chart |
|---|---|---|
| Asian + Pacific | 9.00 pm - 9.00 am | Green |
| European | 6.00 am - 4.00 pm | Blue |
| American | 12.00 am - 10.00 pm | Red |
System messages
- Time shift detecting ... - defines the offset of the server time.
- [ Symbol ] [ Period ]: history loading ... - additional story is loaded when changing the indicator modes. If this message does not disappear within a reasonable time, reduce the value of the "Analysis depth (days)" input parameter.
- Session candels for [Period] period are not provided - impossible to build candles on the selected period of the chart.
- Untrusted price area! - prices are unknown: the price is near the boundaries of the analyzed range. Indications unreliable.





Спасибо автор. Очень удобный индикатор.