ADR ST Patterns Strategy
- Indicadores
- Vladimir Poltoratskiy
- Versão: 2.0
- Atualizado: 1 fevereiro 2022
ADR ST Patterns Strategy is a modification of the classical ADR indicator. This simple indicator corresponds to the parameters specified in the ST Patterns Strategy (https://stpatterns.com/). Structural Target Patterns represents the market consistently divided into components. No trend lines, geometric proportions of the model itself, trading volume, or open market interest are needed for the formation of ST Patterns. They are easily recognized and built only on the basis of breaking through the fractal levels and the distance to the target. ST Patterns overcome the market uncertainty characterizing the previously known graphical compositions and simplify the work of the trader.
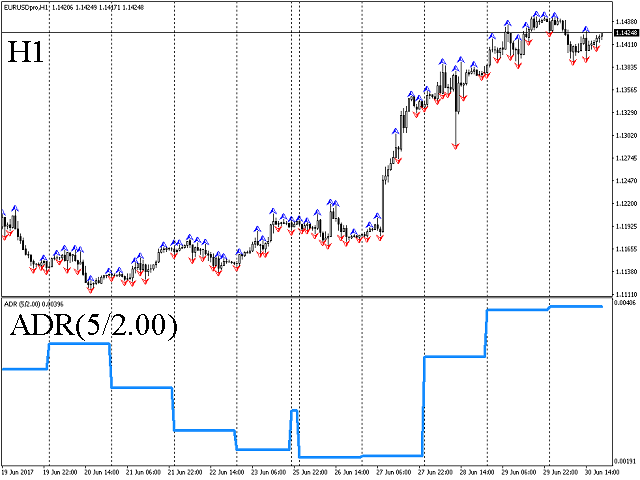
The indicator calculates the average daily range of completed trading days and divides this value by a given amount. The result is displayed as a chart in a separate window. It is possible to use the indicator on various timeframes.
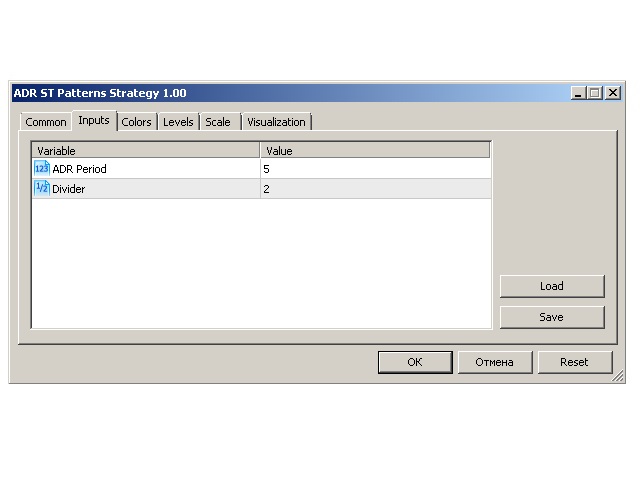
Inputs
- ADR Period - number of days used to calculate the average;
- Divider - divisor, by which the ADR is divided.
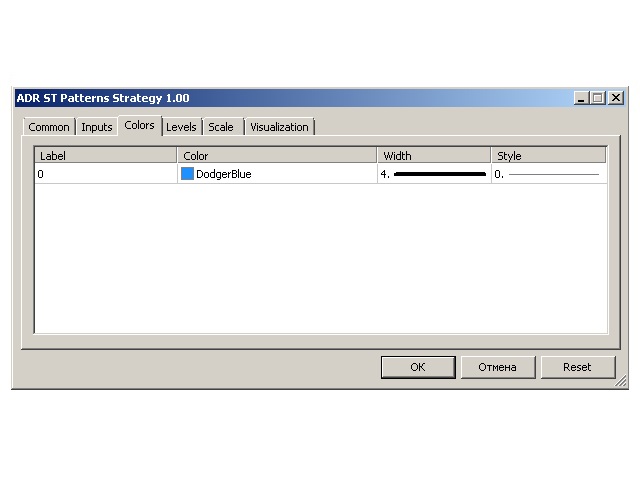
You can set the color and size of the chart in the Colors tab.





Good!