Support and Resistance Scoreboard
- Indicadores
- Leonid Basis
- Versão: 4.21
- Ativações: 5
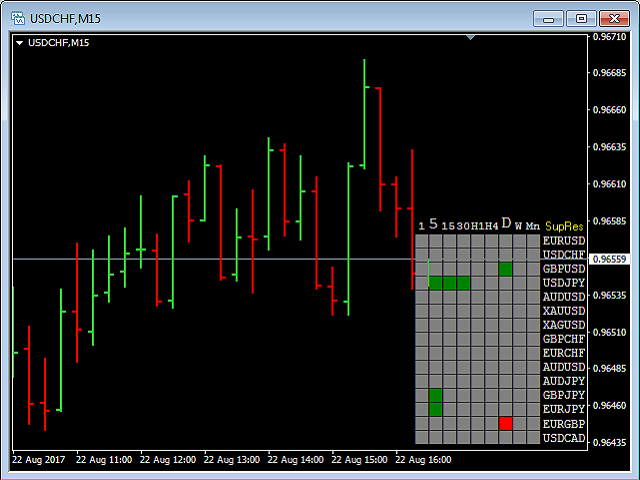
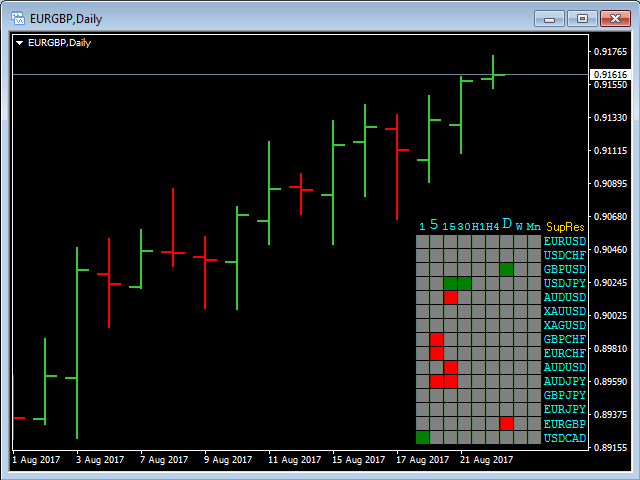
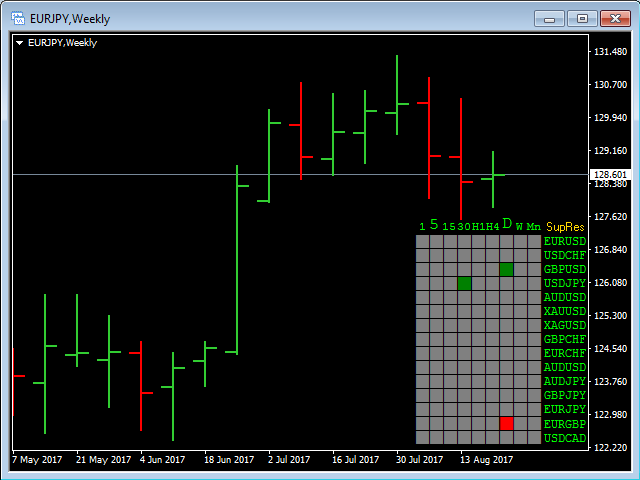
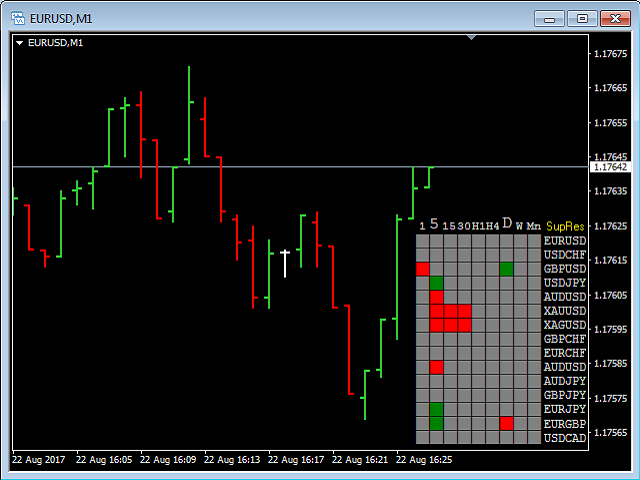
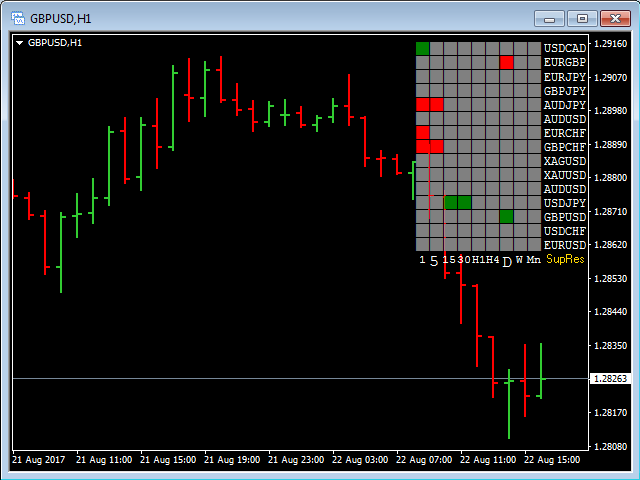
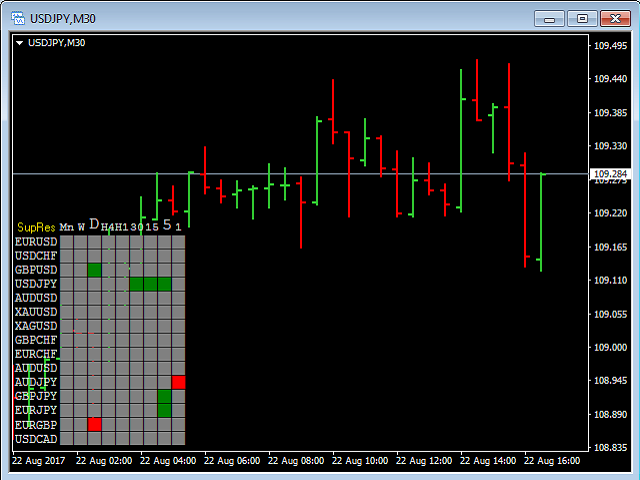
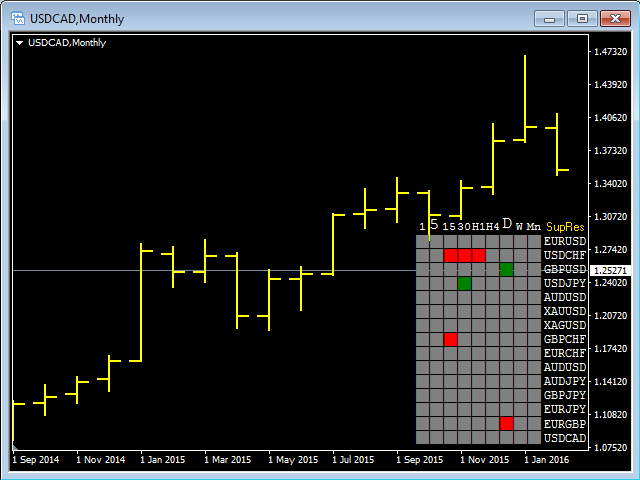
This is a Multiple Time Frames and Multiple Currency Pairs Indicator (Score Board) that shows Support and Resistance Levels from all TFs for 15 currency pairs by your choice.
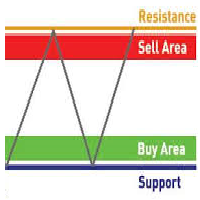
Support terminology refers to prices on a chart that tend to act as a floor by preventing the price of an asset from being pushed downward and can be a good buying opportunity because this is generally the area where market participants see good value and start to push prices higher again.
Resistance terminology refers to prices on a chart that tend to act as a ceiling by preventing the price of an asset from being pushed upward and can be a good selling opportunity because this is generally the area where market participants see good value and start to push prices lower again.
The Support Resistance Scoreboard Indicator will show Red squares (Buying opportunity) in case the currency pair is reaching a resistance level for the current TF and Green squares (Selling opportunity) in case the currency pair is reaching a support level for the current TF.
Input Parameters
- Symb15 = "EURUSD"; - Symbol #15;
- Symb14 = "USDCHF"; - Symbol #14;
- Symb13 = "GBPUSD"; - Symbol #13;
- Symb12 = "USDJPY"; - Symbol #12;
- Symb11 = "AUDUSD"; - Symbol #11;
- Symb10 = "USDCAD"; - Symbol #10;
- Symb9 = "EURGBP"; - Symbol #9;
- Symb8 = "EURJPY"; - Symbol #8;
- Symb7 = "GBPJPY"; - Symbol #7;
- Symb6 = "AUDJPY"; - Symbol #6;
- Symb5 = "AUDUSD"; - Symbol #5;
- Symb4 = "EURCHF"; - Symbol #4;
- Symb3 = "GBPCHF"; - Symbol #3;
- Symb2 = "XAGUSD"; - Symbol #2;
- Symb1 = "XAUUSD"; - Symbol #1;
- corner = CORNER_RIGHT_LOWER; - 1 of 4 possible the ScoreBoard position;
- SymbColor = clrWhite; - one of many possible color for TFs and Symbols labels;
Note
- You have to have all data from all TFs (at least 50 Bars);
- This indicator takes a lot of memory... obviously;
- Have many good trades...
















O usuário não deixou nenhum comentário para sua avaliação