PivotLevels
- Indicadores
- Pro-Berza
- Versão: 1.0
- Ativações: 5
This indicator was created to determine the overall trend of the market.
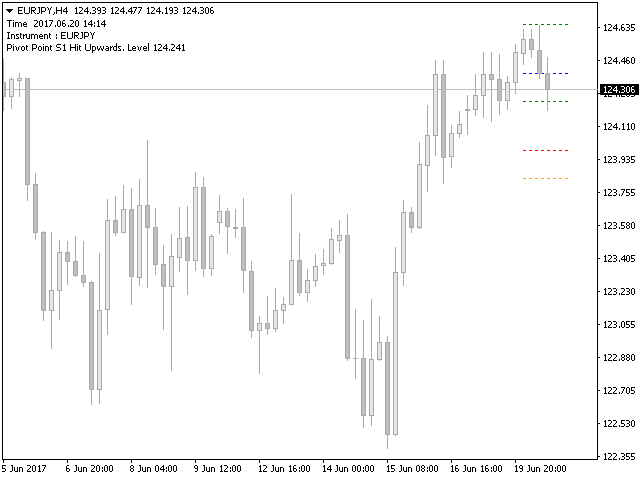
Pivot points are support/resistance level areas, at which the direction of price can change. Many people are looking at those Pivot Point levels, which causes the levels to become almost self-fulfilling.
Use this indicator to identify reversal points, so you can place your orders or combine it to recognize key price levels that needs to be broken to take a good breakout trade.
With this indicator, its easy to find important levels. Coupled with the feedback hit monitor it makes up a powerful indicator giving you an edge to trade profitable.
Calculation Modes
This indicator contains four Pivot Point calculation modes, which are:
-
GeneralPivot Point calculation - classic method of calculating Pivot Points.
-
WoodiePivot Point calculation - similar to the method above but places more importance on the last closing price.
-
CamarillaPivot Point calculation - very good for automated trading as well as taking profit and stop loss levels. This method results in four resistance and four support levels. The main concept using this can be found in the tendency for price to revert back to the mean.
-
FibonacciPivot Point calculation - like the name suggests, the calculation is based upon Fibonacci settings. A lot of people uses Fibonacci in some sort, so using this mode of calculation can find you the levels where a lot of traders are waiting for to take action.
Parameters
- CustomPeriod - timeframe you want the indicator to mark the Pivot Points on.
- PivotPointType - choose from several calculation modes how the Pivot Points are calculated (see above). Those are:
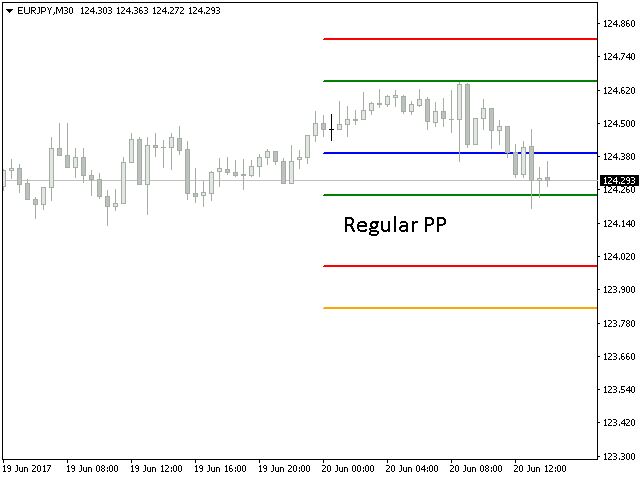
- PPT_REGULAR.
- PPT_WOODIE.
- PPT_CAMARILLA.
- PPT_FIBONACCI.
- RemovePreviousPPonNewBar - remove any previous drawn Pivot Levels when a new Bar period opens.
- DisplayHistoricalPivots - show historical pivot point levels.
- HistoricalBarCount - number of bars in history the indicator will start working from.
- OutputLineType - output style how the Pivot Point levels are displayed, which can be one of the following:
- OUTPUT_TRENDLINE.
- OUTPUT_HORIZONTAL.
- WidthOfLine - width of the pivot point levels.
- OutputLineStyle - style of the pivot point levels being drawn. This can be one of the following:
- LINESTYLE_SOLID.
- LINESTYLE_DASH.
- LINESTYLE_DOT.
- LINESTYLE_DASHDOT.
- LINESTYLE_DASHDOTDOT.
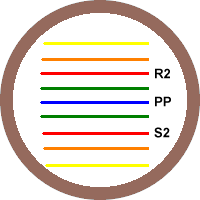
- ColorPP - color for the PP line level.
- ColorLevel1 - color for the S1 and R1 line levels.
- ColorLevel2 - color for the S2 and R2 line levels.
- ColorLevel3 - color for the S3 and R3 line levels.
- ColorLevel4 - color for the S4 and R4 line levels.
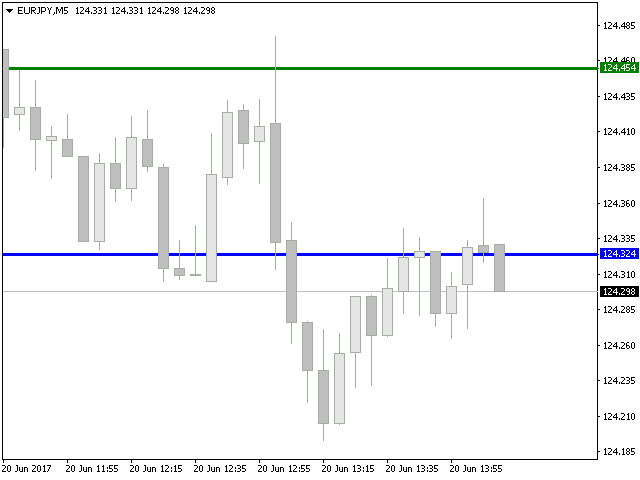
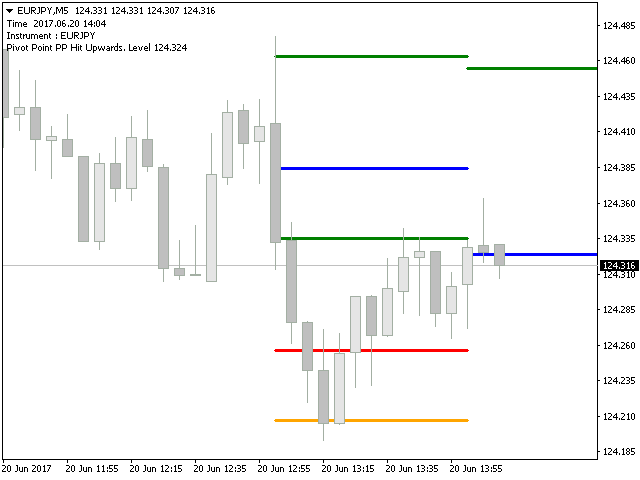
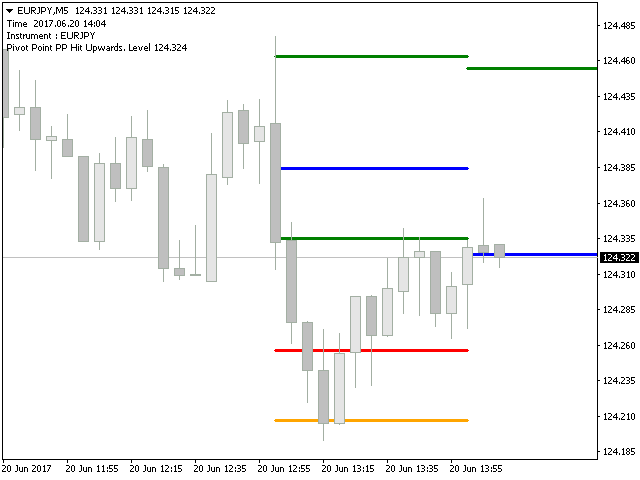
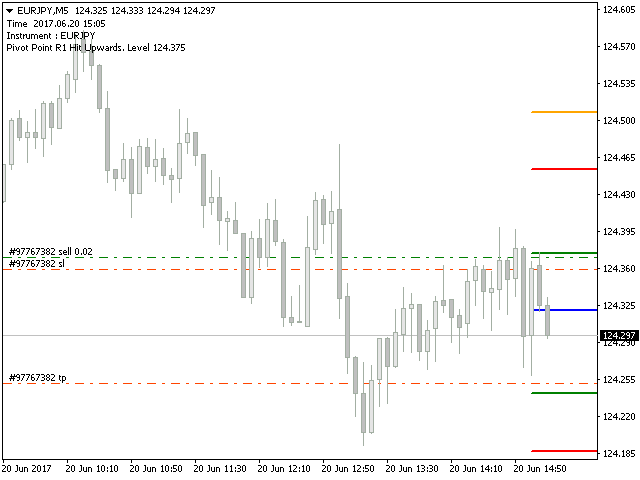
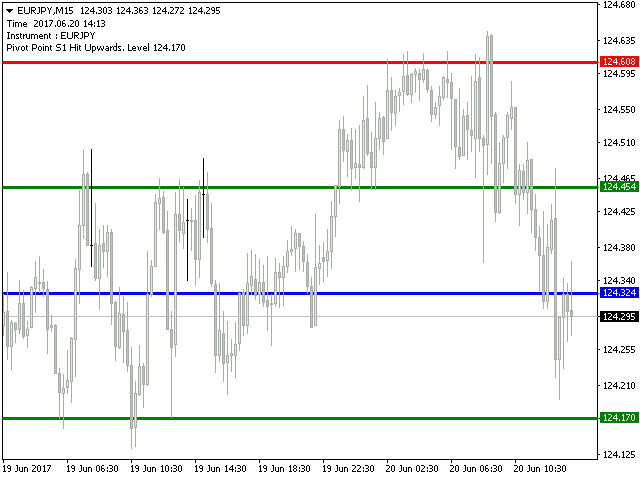
- FeedbackUponPivotLevelHit - enable to have the indicator monitor whether price did hit a Pivot Point Level.
- DoSendNotification - send a notification when the price did hit a pivot point level (enable MetaTrader 4 → Tools → Options → Notifications).
- DoSendMail - send an email when the price did hit a pivot point level (enable and fill in: MetaTrader 4 → Tools → Options → Email).
- DoShowAlert - show and sound when price did hit a pivot point level.
- DoShowComment - show a message in the upper left corner of the chart when price did hit a pivot point level.
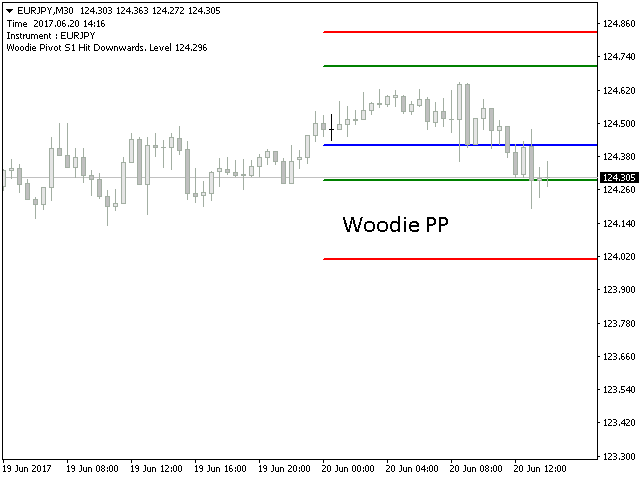

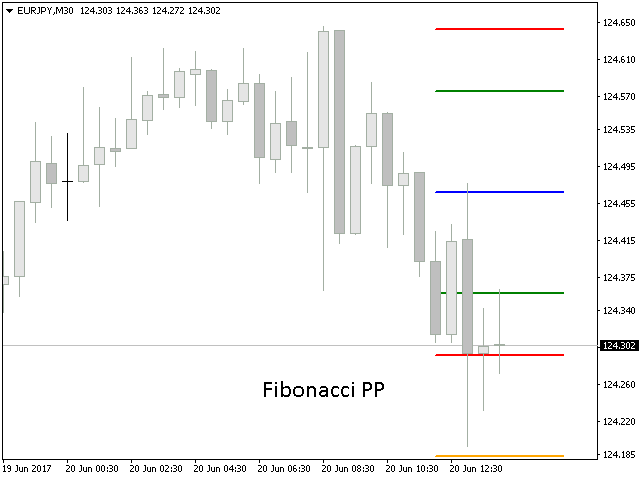



I bought this indicator with intention that it would plot yearly Camarilla levels but it doesnt. Moreover, it doesnt plot real Camarilla but some weird levels (some levels close to classic Camarilla 5 and 6) which are rarely reached by price. Its plots correct regular pivots, correct Woodie pivots, correct Fibonacci pivots (all not yearly pivots though, highest level are monthly pivots for weekly chart). The author has to fix Camarilla calculation and would be great if he would add yearly levels. Then I would give 5 stars. If you are looking for Regular, Fibonacci or Woodie pivots (from smallest timeframes and max to monthly pivots) then its OK, pretty neat design and works fine.