• Visão global
  • Comentários (1)
  • Discussão (4)
  • O que há de novo

Length Movement MT5

Measures the length of the selected movement in points, shows the duration of the movement, as well as the speed of movement. Outputs the average value of each dimension.
It is designed to calculate the expected target based on typical market movements.
The intended goal will provide information about the ratio of the stop size to the possible profit and will allow you not to open positions with a small expected profit.
It will also help you determine the point at which it is more logical to close a position. 

Note: the MT5 tester is not designed for full-fledged work with graphic objects, so drawing in the tester is slower than in the real situation.
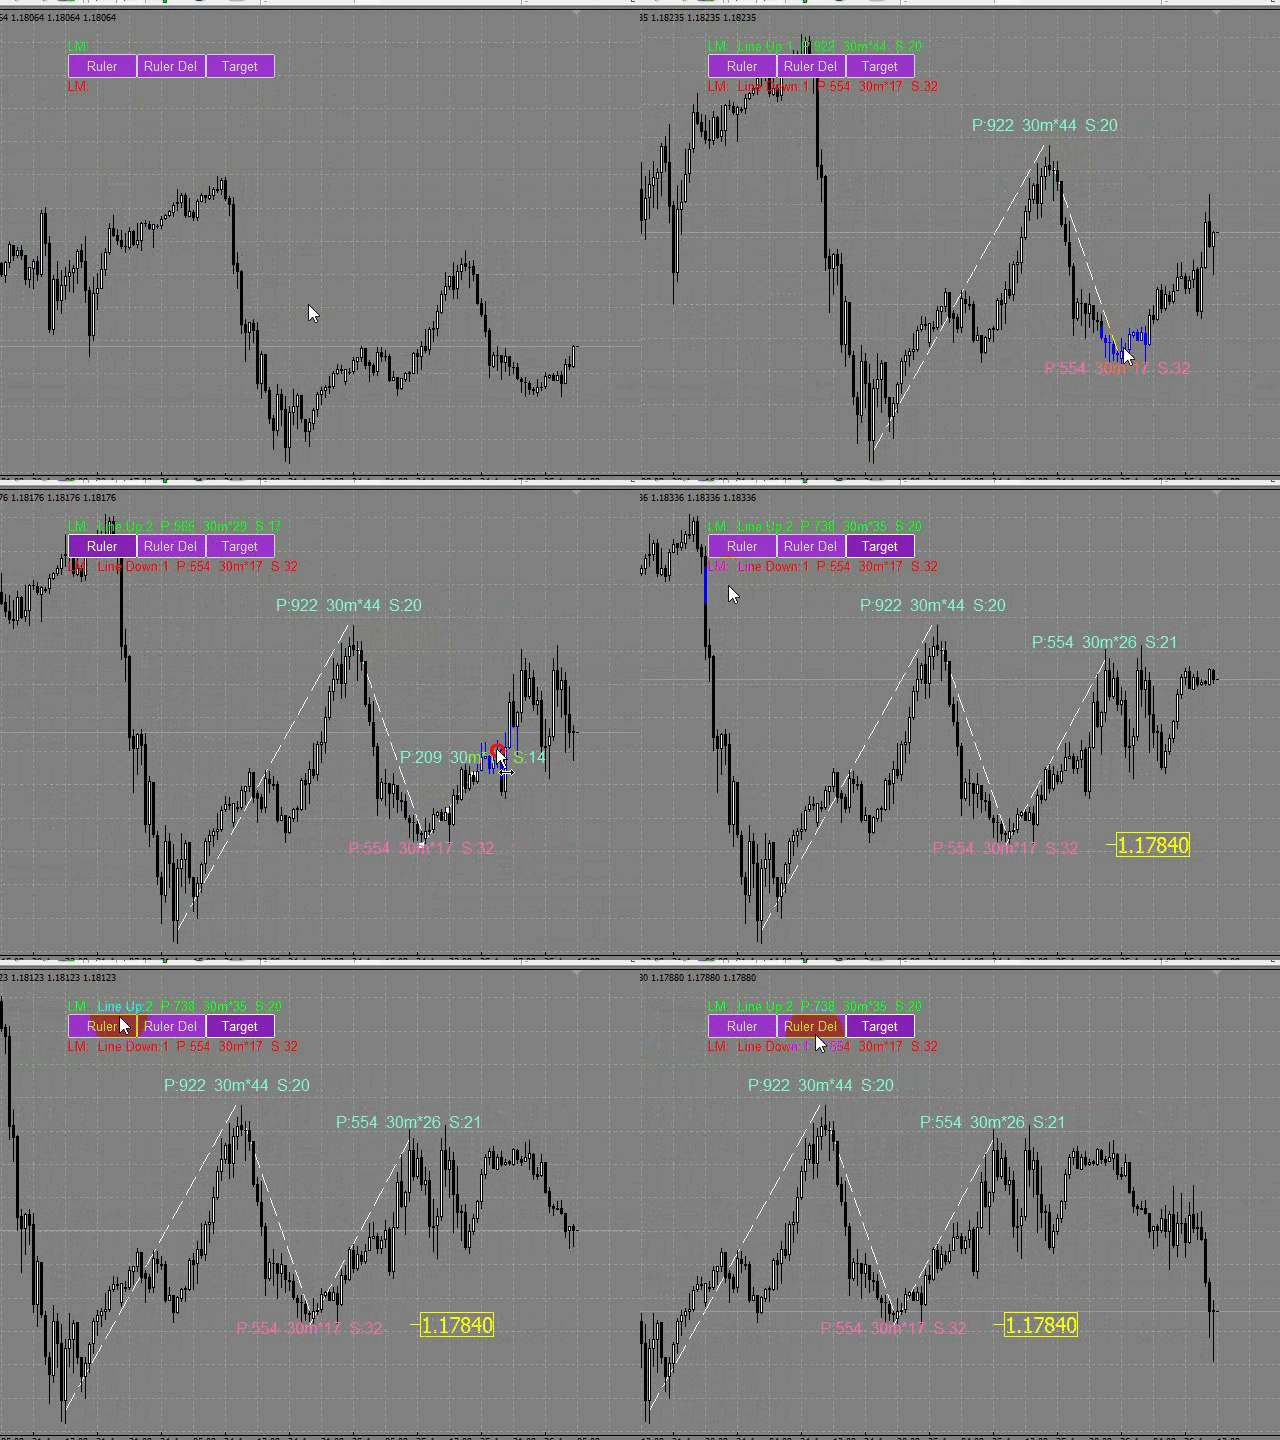
Lines are selected with 1 mouse click.


Building a line
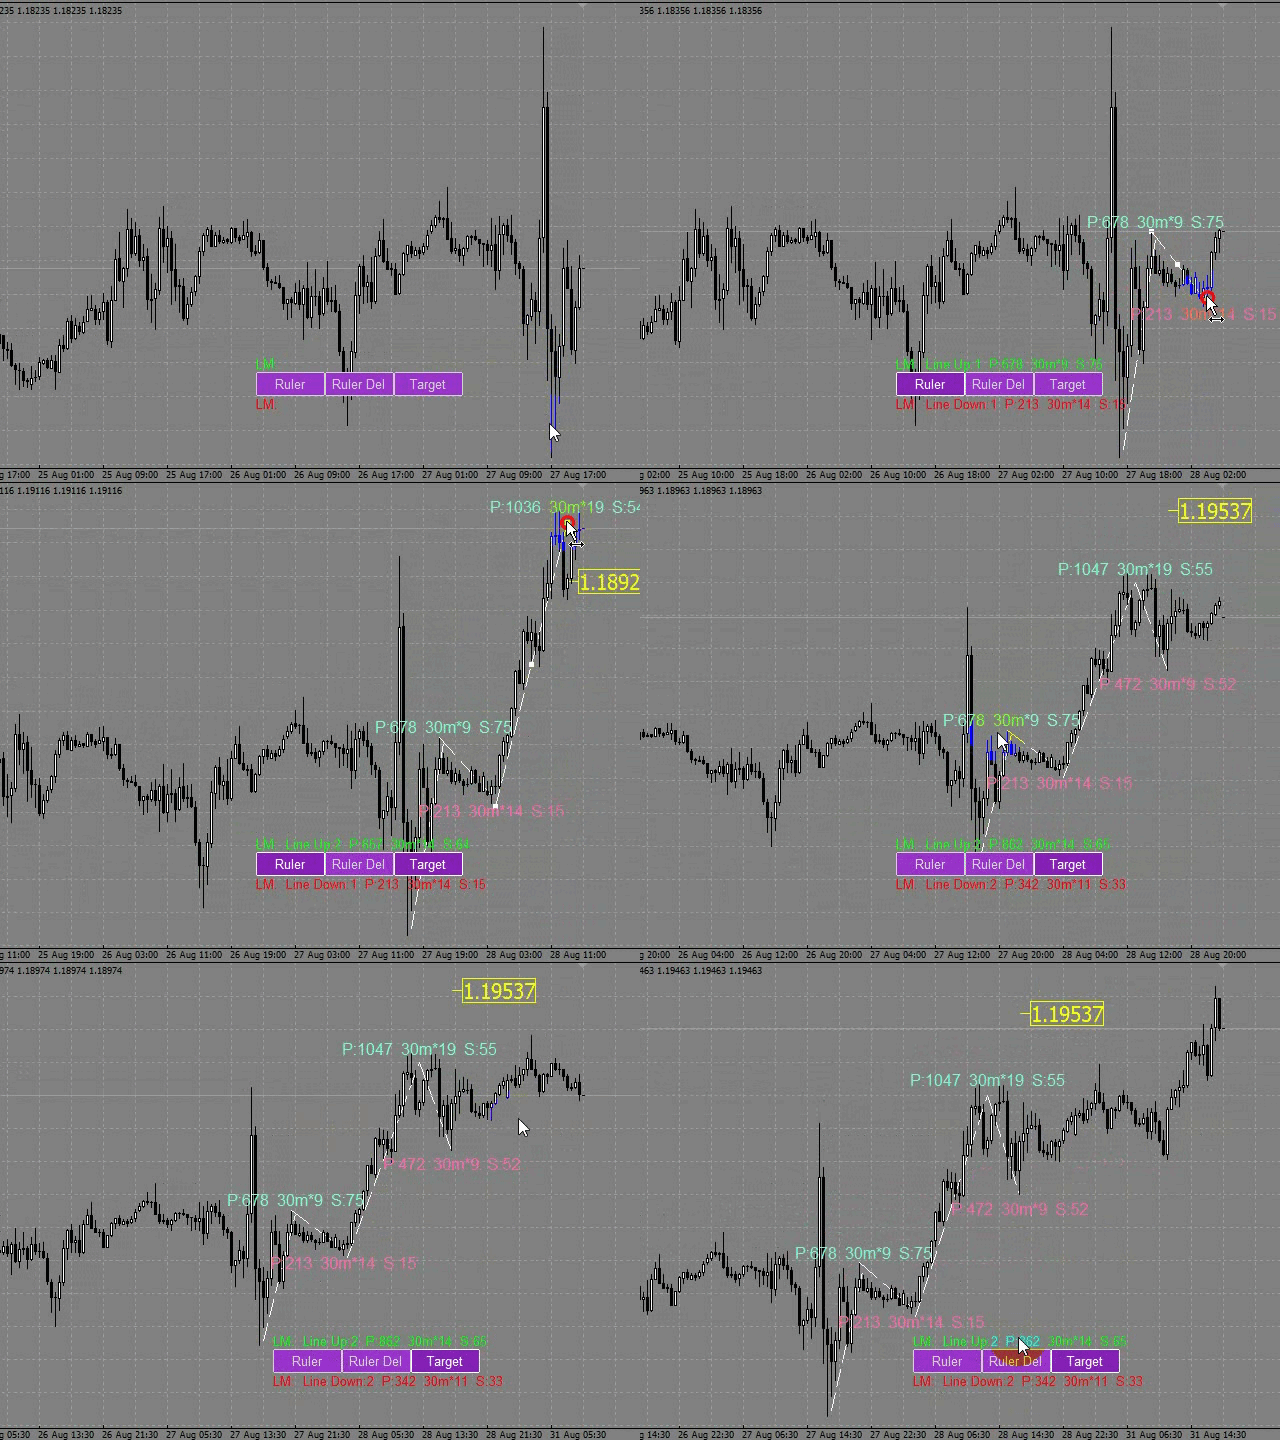
: click the "Ruler" button and draw a line (clicking the mouse - the first point of the line, where the mouse is released - the second point of the line).
(Lines, text placemarks, and the goal are only visible on the time graph where they were drawn.)

Line changes: select a line and drag it with the mouse.
When you rebuild a line, the value of the text label and the goal (if the goal is enabled) will change immediately.

Delete all measurement lines: click "Ruler_Del". During the number of seconds selected in the "Ruler_Del_Cancel" setting, the "Ruler_Del" button can be clicked to cancel, and the "Ruler_Del" command will be canceled.

Delete the selected measurement lines: select the measurement line and press "delete" on the keyboard. The text label from the measurement line will also be removed, and the goal will change.

Building a goal: the "Target" button sets/deletes a goal. To calculate the goal, you need at least two lines in different directions.

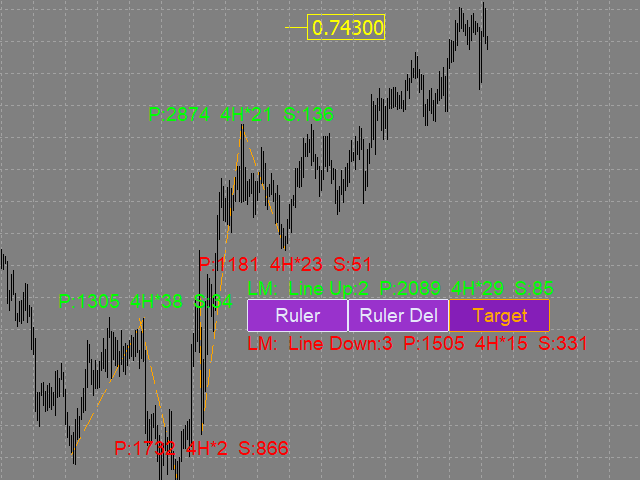
Line_Metrics - Text label of the line.
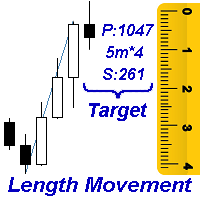
For example, we have an ascending line with the parameters: P:817 4H*10 S: 81. the line Length is 817 points, the line is drawn on a 4-hour chart, based on 10 candles, (that is, the time of the movement(line) is 40 hours).
The speed of the motion in paragraphs 81. This means that on average, each candle participating in the line construction passed 81 points.

Average_Lines_Metrics - Text label for "average values". LM: Line Up:3 P:1586 4H*40 S: 39 means that the text label of the average value is calculated based on 3 ascending measuring lines Line Up: 3 (measuring lines of 0 points, lines of other time periods and tools are not taken into account in the calculations).
The average line length in points is 1586 points P:1586.
The graph where the lines are counted is 4-hour 4H*40. On average, the line consists of 40 4h*40 candles.
On average, the price passes 39 points S:39 per candle.

The size of buttons and text labels for "average values" depends on the font in the Button_Font setting and its size in the Button_FontSize setting.
On-screen buttons can be dragged with the mouse.
You can assign keyboard shortcuts to on-screen buttons (a-Z, 0-9).

Settings

  • Ruler_key - hotkey for drawing a measuring line (you can assign (a-Z, 0-9)) .
  • Ruler_Del_key - hotkey for deleting all measuring lines (you can assign (a-Z, 0-9)) 
    (measurement lines are deleted after the pause selected in the Ruler_Del_Cancel setting).
  • Target_or_Target_Del_key - hotkey for setting / deleting a goal (a-Z, 0-9)
  • (you need at least two lines in different directions to set a goal).
  • Ruler_Del_Cancel - time to cancel the Ruler_Del_key command (in seconds).
  • Button_Background_Color - buttons background color (if Button_Background_Color=clrNONE, the buttons background is the same as the graph background color).
  • Button_Pressed_Color - color of the text and border of the Ruler button when pressed.
  • Line_Metrics_Indent - indent of the text label from the measuring line (in points).
  • Line_Metrics_Orientation - displays the labels of measuring lines vertically / horizontally / diagonally.
  • Target_Orientation - left-hand / right-hand placemark of the goal.
  • Here are the most important settings. You can also change the following characteristics for measuring lines, buttons, and text labels: color, thickness, font, and font size.
    Produtos recomendados
    A Média Móvel é um indicador que faz parte da Análise Técnica. Com ela, é possível identificar o equilíbrio dos preços no mercado, observando tendências de alta, neutra ou baixa. Este indicador customizado traz opções extras pera definir o método de cálculo podendo-se esclolher entre SMA,EMA,SSMA,LWMA,JJMA,JurX,ParMA,T3,Vidya,AMA,HULL MA. Também conta com varias opções para escolher o método de cálculo para o preço base a ser usado no cáculo da média.
    ClusterSecondForex
    Rafil Nurmukhametov
    4.67 (3)
    The utility allows you to build different types of graphs: Seconds chart from 1 second to 86400 seconds Tick chart from 1 tick and above The volume chart Delta chart Renko chart Range chart Product demo https://www.mql5.com/ru/channels/clustersecondforex Built-in indicators for volumetric analysis: daily market profile and market profile of the selected timeframe, Cluster Search Imbalance VWAP Dynamic POC, VAH, VAL the profile depth of the market vertical volume with various display options, del
    "Introducing our cutting-edge Trading Expert Advisor Robot: A culmination of advanced algorithms and meticulous analysis, designed to navigate the dynamic landscape of financial markets with precision and proficiency. Our Expert Advisor Robot is meticulously crafted to empower traders with unparalleled efficiency and insight. Leveraging sophisticated trading strategies and real-time data analysis, it operates seamlessly across various asset classes, including stocks, forex, commodities, and c
    SolarTrade Suite Financial Robot: LaunchPad Market Expert - concebido para abrir negociações! Este é um robô comercial que utiliza algoritmos especiais inovadores e avançados para calcular os seus valores, o seu assistente no mundo dos mercados financeiros. Utilize o nosso conjunto de indicadores da série SolarTrade Suite para escolher melhor o momento de lançamento deste robô. Veja os nossos outros produtos da série SolarTrade Suite na parte inferior da descrição. Quer navegar com confia
    Mine Farm
    Maryna Kauzova
    Mine Farm is one of the most classic and time-tested scalping strategies based on the breakdown of strong price levels. Mine Farm is the author's modification of the system for determining entry and exit points into the market... Mine Farm - is the combination of great potential with reliability and safety. Why Mine Farm?! - each order has a short dynamic Stop Loss - the advisor does not use any risky methods (averaging, martingale, grid, locking, etc.) - the advisor tries to get
    VR Grid Mt5
    Vladimir Pastushak
    3.43 (7)
    O indicador VR Grid foi projetado para criar uma grade gráfica com configurações definidas pelo usuário. Ao contrário da grade padrão , a VR Grid é usada para construir níveis circulares . Dependendo da escolha do usuário, o passo entre os níveis de rodada pode ser arbitrário. Além disso, ao contrário de outros indicadores e utilitários, o VR Grid mantém a posição da rede mesmo quando o período de tempo muda ou o terminal é reiniciado. Configurações, arquivos de configuração, versões demo, instr
    FREE
    ICT Kill zone and Macros Indicator mark and display the following zone times on the chart: Kill zones   Kill zone Forex Asian London Open New York Open London Close Central Bank Dealing range Kill zone Indices Asian London Open New York AM New York Lunch New York PM Power Hour Macros London 1 London 2 New York Am 1 New York AM 2 New York Lunch New York PM 1 New York PM 2 Silver bullet London Open New York AM New York PM Sessions Asian London New York Chart The display of  Kill zone ,
    ClusterSecond
    Rafil Nurmukhametov
    4.78 (32)
    The utility allows you to build different types of graphs: Seconds chart from 1 second to 86400 seconds Tick chart from 1 tick and above The volume chart Delta chart Renko chart Range chart Demo version of the utility https://www.mql5.com/ru/channels/clustersecond Built-in indicators for volumetric analysis: daily market profile and market profile of the selected timeframe, Cluster Search Imbalance VWAP Dynamic POC, VAH, VAL the profile depth of the market vertical volume with various display op
    Candle hunter
    Ruslan Khasanov
    5 (1)
    Indicador para análise gráfica. Marca os principais padrões de velas japonesas no gráfico. No momento, o seguinte conjunto de padrões está disponível para o trader:  - Bearish/Bullish Abandoned Baby;  - Bearish Advance Block;  - Bearish Deliberation;  - Bearish/Bullish Belt Hold;  - Bearish/Bullish Engulfing;  - Bearish Shooting Star;  - Bearish Evening Star;  - Bearish Evening Doji Star;  - Bearish/Bullish Doji Star;    - Bearish/Bullish Tri-Star;  - Bearish Hanging Man;  - Bearish/Bullish Har
    ScalperGun
    Mikhail Nazarenko
    Scalper gun  - главное оружие для торговли скальпингом и свингом, с визуализацией и алертом точек входа. Индикатор работает как в трендовых, так и в нетрендовых рыночных условиях. Подходит начинающим и опытным трейдерам.  SCALPER GUN превосходит по скорости, качеству визуализации и точности входа популярные топовые индикаторы этого сайта!!! Перед покупкой скачайте демо Scalper gun и сравните с аналогичными индикаторами для скальпинга в тестере MT4. Особенности Это готовая торговая система с виз
    Trade Manager DaneTrades
    Levi Dane Benjamin
    4.73 (22)
    Trade Manager para ajudá-lo a entrar e sair rapidamente de negociações enquanto calcula automaticamente seu risco. Incluindo recursos para ajudar a evitar negociações excessivas, negociações de vingança e negociações emocionais. As negociações podem ser gerenciadas automaticamente e as métricas de desempenho da conta podem ser visualizadas em um gráfico. Esses recursos tornam este painel ideal para todos os traders manuais e ajudam a aprimorar a plataforma MetaTrader 5. Suporte multilíngue. Vers
    Exp Tick Hamster MT5
    Vladislav Andruschenko
    3.59 (17)
    Especialista em otimização automática de todos os parâmetros de qualquer símbolo de negociação para MetaTrader 5. T rading EA sem configurações! Carraça   Hamster   - Este é um   especialista em negociação automatizado para iniciantes e usuários que não desejam configurar um consultor! A estratégia de negociação deste consultor de negociação foi testada por   7 anos. Torne a negociação mais fácil do que nunca com nosso especialista em negociação automatizada, que foi projetado especialmente para
    Was: $249  Now: $99   Market Profile defines a number of day types that can help the trader to determine market behaviour. A key feature is the Value Area, representing the range of price action where 70% of trading took place. Understanding the Value Area can give traders valuable insight into market direction and establish the higher odds trade. It is an excellent addition to any system you may be using. Inspired by Jim Dalton’s book “Mind Over Markets”, this indicator is designed to suit the
    Heiken Ashi CE Filtered – Premium Buy/Sell Indicator with Advanced Filtering Introducing the "Heiken Ashi CE Filtered" – a high-quality custom indicator designed for traders seeking precision and clarity in their trading signals. This premium indicator combines the smooth visual simplicity of Heiken Ashi candles with the power of an ATR-based chandelier exit strategy and a zero-lag LSMA filter for highly reliable buy and sell signals. Key Features: Reliable Buy/Sell Signals: The indicator genera
    Este indicador mostrará os valores de TP e SL (naquela moeda) que você já definiu para todos os pedidos nos gráficos (fechados na linha de transação/pedido) que o ajudarão muito a estimar seus lucros e perdas para cada pedido. E também mostra os valores de PIPs. o formato mostrado é "Valores de moeda de nossos valores de Lucro ou Perda / PIPs". O valor TP será mostrado na cor verde e o valor SL será mostrado na cor vermelha. Para qualquer dúvida ou mais informações, sinta-se à vontade para en
    The Jackson Auto Candlestick Pattern . It a powerful price action tool which auto detect and alert a hided powerful candlestick patterns . It came with few different chart skins. You can use this indicator alone to make profit, but it powerful when you combine it with trendlines, You can download The Jackson Auto Trendlines for free Link : UCRW695l9Wgg2ucnnf5DL5Vw  List of Candlestick Pattern it detect   1. Bullish & Bearish Engulfing's 2. Top and Bottom Tweezer 3. Bullish and Bearish Harams 4.
    A singularidade deste indicador reside no algoritmo de contabilidade de volume: a acumulação ocorre diretamente para o período selecionado sem referência ao início do dia. As últimas barras podem ser excluídas do cálculo, então os dados atuais terão menos influência sobre os níveis significativos (volumes) formados anteriormente. Para um cálculo mais preciso, os dados do gráfico M1 são usados por padrão. A etapa de distribuição dos volumes de preços é regulamentada. Por padrão, a borda direita d
    Oscillador moving
    Ignacio Agustin Mene Franco
    Oscillator Moving ! is an oscillator where it has 3 input points where is the orange line, the red line and the blue line where the orange line touches the ceiling of the blue line, it gives a buy entry signal. where the red line crosses the blue line gives a sell signal! very clear to see and very simple to use! It can be used at any time! can be used in Forex markets. In the synthetic and crypto index markets! good profit World Investor.
    Supply / demand zones: observable areas where price has approached many times in the past. My   #1 Utility:  65+ features , including this indicator  |   Contact me  for any questions  |  MT4 version The indicator shows where the price could potentially be reversed again. Usually, the more times the price has been rejected from the level, the more significant it is. In the input settings   you can adjust: Enable or disbale   Weak zones; Show or hide   zone description; Font size; Set the   basi
    WanaScalper
    Isaac Wanasolo
    1 (1)
    A scalping indicator based on mathematical patterns, which on average gives signals with relatively small SL, and also occasionally helps to catch big moves in the markets (more information in the video) This indicator has three main types of notifications: The first type warns of a possible/upcoming signal on the next bar The second type indicates the presence of a ready signal to enter the market/open a position The third type is for SL and TP levels - you will be notified every time price r
    O utilitário "   Multi Symbol Trailing   " move Stop Loss para todas as posições que estão atualmente abertas (multi-symbol trailing). Destina-se principalmente a auxiliar na negociação manual. Não há restrições para o utilitário pelo nome do par de moedas ou pelo identificador individual (número mágico) - o utilitário processa absolutamente todas as posições abertas no momento. A unidade de medida para os parâmetros "   Trailing Stop   " e "   Trailing Step   " é pontos (a diferença entre o pre
    Price reach indicator. It also serves as the perfect term for supports and resistance. I use it in two experts. The basic tool for professional trading. The indicator analyzes the last 500 bar and uses this to determine the levels ( but it doesn't predict the future ) . Personally, I use it on TF H1.  It is very simple. Four lines on chart and that's all. Only two input parameters.  Thousands of indicators. Why this? Is good ? No! Is very good. Please test the indicator prior to purchasing. You
    Transforme qualquer estratégia de negociação em uma estratégia de negociação de posição ou negocie as estratégias comprovadas de negociação de posição baseadas em RSI e ADR, incluindo sistema automatizado de controle de rebaixamento para posições que se movem contra você. Este EA é uma evolução e uma simplificação do EA MRA que tem sido usado para estratégias de negociação de posição ensinadas no site Market Structure Trader há muitos anos. Veja meu perfil para obter um link para o site, curso
    Crypto to MT5
    Rajesh Kumar Nait
    Crypto.com para MT5 Live Candlestick Stream para Metatrader 5 de Crypto.com websocket É um OHCLV (Open High Low Close Real Volume) Dados de taxas ao vivo  traders, se em um gráfico de minuto, os dados OHLC não estiverem corretos, podem fornecer análises erradas no estudo técnico do gráfico, este produto garante que fornece dados precisos em tempo real, o que pode ajudar na análise manual você pode verificar meu outro produto de criptografia no meu perfil https://www.mql5.com/en/users/ra
    Gecko EA MT5
    Profalgo Limited
    5 (1)
    NEW PROMO: Only a few copies copies available at 349$ Next price: 449$ Make sure to check out our " Ultimate EA combo package " in our   promo blog ! Gecko runs a simple, yet very effective, proven strategy.  It looks for important recent support and resistance levels and will trade the breakouts.  This is a "real" trading system, which means it will use a SL to protect the account.  It also means it will not use any dangerous techniques like martingale, grid or averaging down. The EA shows its
    Your Trend Friend
    Luigi Nunes Labigalini
    5 (1)
    A tendência é sua amiga! Veja a cor do indicador e faça suas operações nessa direção. Ele não repinta. Ou seja, depois que cada candle se fecha, a cor dele é definitiva e não irá se alterar. Você pode focar em movimentos mais curtos e rápidos ou tendências mais longas, basta testar o que melhor se encaixa no seu operacional de acordo com o ativo e tempo gráfico usado. Altere o parâmetro de entrada "Length" e o indicador irá se adaptar automaticamente (quanto maior ele for, maior a tendência a
    O DYJ MOBILE GAMING TRADING WINNER pode usar seus vários terminais (MOBILE PHONE, WEB, TRADINGVIEW, MT5) para negociação manual e, em seguida, processado automaticamente pela EA. A negociação móvel pode usar os vários modos de grade da EA, modo de couro cabeludo, modo de arbitragem de hedge e modo de ordem independente para abrir posições manualmente, A EA pode definir automaticamente o stop loss para abertura móvel. E use seu celular para abrir uma grade, couro cabeludo e ordens de hedge.
    The Penta-O is a 6-point retracement harmonacci pattern which usually precedes big market movements. Penta-O patterns can expand and repaint quite a bit. To make things easier this indicator implements a twist: it waits for a donchian breakout in the right direction before signaling the trade. The end result is an otherwise repainting indicator with a very reliable trading signal. The donchian breakout period is entered as an input. [ Installation Guide | Update Guide | Troubleshooting | FAQ | A
    Swing Points
    Usiola Oluwadamilol Olagundoye
    Swing Points Indicator for MetaTrader 5 The **Swing Points Indicator** is a custom-built technical tool designed for MetaTrader 5 (MT5), primarily used for identifying crucial reversal points in price action. By plotting swing highs and swing lows, it highlights potential trend reversals, making it a valuable tool for traders relying on price action analysis. This indicator helps traders anticipate changes in market direction by visually marking significant turning points on the chart. Main
    FREE
    # NeuroX Quantum Arbitrage EA: Revolutionizing Automated Forex Trading ## Unleash the Power of Advanced Algorithms and Cutting-Edge Technology,  Load the preset by right-clicking on the EA on your chart, selecting "Properties," and then "Load" to import the   PRESET FILE . In the fast-paced world of forex trading, staying ahead of the curve is not just an advantage—it's a necessity. Introducing the NeuroX Quantum Arbitrage EA, a state-of-the-art Expert Advisor that combines time-tested tradin
    Os compradores deste produto também adquirem
    Trade Assistant MT5
    Evgeniy Kravchenko
    4.37 (166)
    Ajuda a calcular o risco por comércio, a fácil instalação de uma nova encomenda, gestão de encomendas com funções de fecho parcial, trailing stop de 7 tipos e outras funções úteis. Atenção, o aplicativo não funciona no testador de estratégia. Você pode baixar a versão Demo na página de descrição  Manual, Description, Download demo Função de linha Mostra no gráfico a linha de Abertura, Stop Loss, Take Profit. Com esta função é fácil definir uma nova ordem e ver as suas características adicion
    Bem-vindo ao Trade Manager EA—uma ferramenta de gestão de risco criada para tornar o trading mais intuitivo, preciso e eficiente. Não é apenas uma ferramenta para executar ordens, mas uma solução abrangente para planejamento de operações, gerenciamento de posições e controle de risco. Seja você um iniciante, trader avançado ou scalper que precisa de execução rápida, o Trade Manager EA adapta-se às suas necessidades, oferecendo flexibilidade em todos os mercados, desde forex e índices até commodi
    TradePanel MT5
    Alfiya Fazylova
    4.85 (116)
    Trade Panel é um assistente comercial multifuncional. O aplicativo contém mais de 50 funções para negociação manual e permite automatizar a maioria das ações de negociação. Antes de comprar, você pode testar a versão Demo em uma conta demo. Demonstração aqui . Instruções completas aqui . O aplicativo foi concebido como um conjunto de painéis interconectados: Painel para comércio. Projetado para realizar operações comerciais básicas: Abertura de ordens e posições pendentes. Abertura da grade de o
    Telegram To MT5 Receiver
    Levi Dane Benjamin
    4.86 (7)
    Copie os sinais de qualquer canal do qual você seja membro (incluindo privados e restritos) diretamente para o seu MT5.  Esta ferramenta foi projetada com o usuário em mente, oferecendo muitos recursos que você precisa para gerenciar e monitorar as negociações. Este produto é apresentado em uma interface gráfica fácil de usar e visualmente atraente. Personalize suas configurações e comece a usar o produto em minutos! Guia do usuário + Demo  | Versão MT4 | Versão Discord Se deseja experimentar
    Custom Alerts é uma ferramenta versátil de monitorização de vários mercados que identifica configurações promissoras em todas as oito principais moedas (USD, CAD, GBP, EUR, CHF, JPY, AUD e NZD), bem como GOLD (XAU), todos os 28 pares de Forex e GOLD baseados nestas moedas e até sete índices como US30, UK100, WTI, Bitcoin, etc. É totalmente personalizável. A ferramenta reúne dados dos nossos indicadores FX Power, FX Volume e IX Power e notifica-o de eventos significativos.   Antes de começar,
    The product will copy all telegram signal to MT5 ( which you are member) , also it can work as remote copier.  Easy to set up, copy order instant, can work with almost signal formats, image signal,  s upport to translate other language to English Work with all type of channel or group, even channel have "Restrict Saving Content", work with  multi channel, multi MT5 Work as remote copier: with signal have ticket number, it will copy exactly via ticket number. Support to backtest signal. How to s
    -25% discount ($199 -> $149) Advanced trading tool: One click smart orders that execute under your conditions Developed by trader for trading community:  position size calculator (lot size), open position after price action, strategy builder, set and forget trading, mobile notifications... Risk Management -  Risk percentage position size calculator, gain percentage, target risk reward ratio, spread and commissions are included in calculations 7 Advanced order types  - Set and forget trading w
    Trade Assistant 38 in 1
    Makarii Gubaydullin
    4.89 (18)
    Ferramenta multifuncional: 65+ funções, incluindo: calculadora de lote, Price Action, proporção R/R, gerenciamento de trade, zonas de suporte e resistência Versão Demo   |   Manual de usuário   |    Versão MT4 O utilitário não funciona no testador de estratégia: você pode baixar a versão Demo AQUI para testar o produto. Contate-me   para perguntas / ideias de melhorias / caso encontrar algum erro Os trades automáticos serão permitidos se estiverem habilitados na plataforma e na corretora Simpli
    Bot Mt5 para Binance Future (Expert) O sistema está funcionando no mercado Binance Future. Você pode integrá-lo facilmente ao seu próprio código para automatizar as operações. O painel de operação manual está disponível. Hedge mod compatível. Todas as operações podem ser feitas manualmente na tela. É a maneira mais eficaz de controlar muitas criptomoedas ao mesmo tempo. A tela é do tipo modelo com tela binance. Você pode baixar o arquivo de modelo no link. https://drive.google.c
    Set price targets, and leave everything else to HINN Lazy Trader! This tool is designed for automatic position sizing from specified levels to designated targets. Using a VPS is recommended (*). The demo version   limited in functionality, be sure to watch this video before using -->  https://youtu.be/geLQ6dUzAr8 A community for users, product discussion, update news, and first line of support are organized in a free Discord: https://discord.gg/zFhEZc7QDQ Use Webmoney For payments in cryptocu
    RiskGuard Management
    MONTORIO MICHELE
    5 (14)
    ATTENTION the expert does not work in strategy tester, for a trial version visit my profile. Manual RiskGuard Management   RiskGuard management was born with the idea of ​​helping traders from their initial journey to becoming expert and aware traders. Compatible with any operating system whether Mac or Windows. The operations panel is integrated into the graph giving the possibility to choose size and position between right and left, while the various buttons light up when they can be used,
    Trading Chaos Expert
    Gennadiy Stanilevych
    5 (10)
    Não existe software igual no mundo e que represente um "console" universal de negociação informando sinais para operar, entrada automatizada do mercado, configurando o Stop Loss e o Take Profit, assim como o Trailling Profit para diversas negociações em apenas uma janela aberta. O controle intuitivo do Expert Advisor em "três cliques" garante um uso abrangente de todas as suas funções em diferentes computadores, incluindo tablets. Interagindo com indicadores de sinal adicionais que marcam o gráf
    This script is designed to download a long history of cryptocurrency quotes from the Binance exchange. You will find it perfectly suitable if you want once to download the history of cryptocurrencies for charts analyzing, collecting statistics or testing trading robots in the MetaTrader 5 strategy tester, or if you need to update the history not very frequently (for example, once a day or once a week). After running the script, you will have fully featured (but not automatically updated) cryptoc
    The product will copy all  Discord  signal   to MT5   ( which you are member  ) , also it can work as remote copier.  Easy to set up. Work with almost signal formats, support to translate other language to English Work with multi channel, multi MT5. Work with Image signal. Copy order instant, auto detect symbol. Work as remote copier: with signal have ticket number, it will copy exactly via ticket number. How to setup and guide: Let read all details about setup and download Discord To MetaTrade
    The  Easy Strategy Builder (ESB)  is a " Do It Yourself " solution that allows you to create a wide range of the automated trading strategies without any line of codes. This is the world’s easiest method to automate your strategies that can be used in STP, ECN and FIFO brokers. No drag and drop is needed. Just by set conditions of your trading strategy and change settings on desired values and let it work in your account. ESB has hundreds of modules to define unlimited possibilities of strategi
    Comprehensive on chart trade panel with the unique ability to be controllable from mobile as well. Plus has a library of downloadable configuration, e.g. exit rules, extra panel buttons, pending order setup and more. Please see our product video. Works with all symbols not just currency pairs. Features On chart panel plus controllable from free app for Windows, iPhone and Android Built-in script engine with library of downloadable configuration, e.g. add 'Close All Trades in Profit' button, exit
    YuClusters
    Yury Kulikov
    4.93 (42)
    Atenção: A versão demo para revisão e teste está aqui . YuClusters é um sistema profissional de análise de mercado. O trader tem oportunidades únicas para analisar o fluxo de pedidos, volumes de negociação, movimentos de preços usando vários gráficos, perfis, indicadores e objetos gráficos. O YuClusters opera com base em dados de Tempos e Negócios ou informações de ticks, dependendo do que está disponível nas cotações de um instrumento financeiro. O YuClusters permite que você crie gráficos com
    News Trade EA MT5
    Konstantin Kulikov
    4.5 (10)
    Apresento um robô útil que eu mesmo uso há vários anos. Pode ser usado nos modos semiautomático e totalmente automático. O programa contém configurações flexíveis para negociação nas notícias do calendário econômico. Não pode ser verificado no testador de estratégia. Somente trabalho real. Nas configurações do terminal, você precisa adicionar o site de notícias à lista de URLs permitidos. Clique em Serviço > Opções > Conselheiros. Marque com V a caixa "Permitir WebRequest para os seguintes UR
    Mentfx Mmanage mt5
    Anton Jere Calmes
    4.25 (8)
    The added video will showcase all functionality, effectiveness, and uses of the trade manager. Drag and Drop Trade Manager. Draw your entry and have the tool calculate the rest. Advanced targeting and close portions of a trade directly available in tool (manage trades while you sleep). Market order or limit order on either side with factored spread. Just draw the entry, the tool does the rest. Hotkey setup to make it simple. Draw where you want to enter, and the stop loss, the tool calculates al
    Este é um painel de negociação visual que ajuda você a realizar e gerenciar operações facilmente, evitando erros humanos e aprimorando sua atividade comercial. Ele combina uma interface visual fácil de usar com uma abordagem sólida de gerenciamento de riscos e posições. [ Guia de instalação | Guia de atualização | Solução de problemas | FAQ | Todos os produtos ] Surpreendentemente fácil de usar Negocie facilmente a partir do gráfico Negocie com gerenciamento preciso de riscos, sem complicações
    Adam FTMO MT5
    Vyacheslav Izvarin
    5 (2)
    ADAM EA Special Version for FTMO Please use ShowInfo= false for backtesting ! Our 1st EA created using ChatGPT technology Trade only GOOD and checked PROP FIRMS  Default parameters for Challenge $100,000 Tested on EURUSD and GBPUSD only  Use 15MIN Time Frame Close all deals and Auto-trading  before Weekend at 12:00 GMT+3  Friday For Prop Firms MUST use special Protector  https://www.mql5.com/en/market/product/94362 -------------------------------------------------------------------------------
    -25% discount ($149 -> $111) Everything for chart Technical Analysis indicator mt5 in one tool Draw your supply demand zone with rectangle and support resistance with trendline and get alerts to mobile phone or email alert -  Risk reward indicator mt5 Video tutorials, manuals, DEMO download   here .   Find contacts on my   profile . 1.   Extended rectangles and trendlines Object will be extended to the right edge of the chart when price will draw new candles on chart. This is rectangle extend
    Hedge Ninja
    Robert Mathias Bernt Larsson
    3 (2)
    Make sure to join our Discord community over at www.Robertsfx.com , you can also buy the EA at robertsfx.com WIN NO MATTER IN WHICH DIRECTION THE PRICE MOVES This robot wins no matter in which direction the price moves by following changing direction depending on in which direction price moves. This is the most free way of trading to this date. So you win no matter which direction it moves (when price moves to either of the red lines as seen on the screenshot, it wins with the profit target yo
    Copie sinais de qualquer canal do qual seja membro ( sem a necessidade de um Token de Bot ou Permissões de Administrador ) diretamente para o seu MT5. Foi projetado com o usuário em mente, oferecendo muitos recursos de que você precisa Este produto é apresentado em uma interface gráfica fácil de usar e visualmente atraente. Personalize suas configurações e comece a usar o produto em minutos! Guia do Usuário + Demonstração  | Versão MT4 | Versão Telegram Se deseja experimentar uma demonstração
    Unlimited Trade Copier Pro MT5 is a tool to copy trade remotely to multiple MT4, MT5 and cTrader accounts at different computers/locations over internet. This is an ideal solution for you if you are a signal provider and want to copy your trades to other receivers globally on your own rules. One provider can copy trades to multiple receivers and one receiver can get trade from multiple providers as well. The provider can even set the subscription expiry for each receiver, so that receiver will n
    Click and Go Trade Manager, the ultimate solution for seamless trading execution. With a simple click on the chart, you can effortlessly define your stop loss, entry price, and target levels. No more hassle of inputting values manually - it's made incredibly intuitive and easy. Embedded risk management is a key feature of our Trade Manager. We understand the importance of protecting your investments, which is why the Click and Go Trade Manager incorporates risk management. When placing orders, y
    MQLplus Charting
    Dominik Egert
    3.67 (3)
    MQLplus Charting  Inspired by good charting solutions available on the web, this utility finally brings some neat features to MT5 to make charting fun again. Current version supports following features: Free floating charts , similar to Tradingview A sophisticated Cross-Hair , with detailed data display Multi-Chart Cross-Hair  sync function Measurement tool , showing account currency, points and period count as results Speed-Scrolling  to move fast through markets history Snail-Scrolling  to
    EmoGuardian
    Samuel Bandi Roccatello
    5 (1)
    Evite overtrading, FOMO e comportamentos compulsivos, impondo limites de risco avançados à sua conta de negociação usando o EmoGuardian. Adicione automaticamente Stop Losses às posições, gerencie as perdas de EAs , carregue/descarregue EAs automaticamente. Limite o risco por posição, por tradedd, por intervalo de tempo, por dia. As opções de gestão de risco foram desenvolvidas para combater especificamente os comportamentos compulsivos que levam os comerciantes a explodir as suas contas. Atenção
    Online Accounts Manager MT5
    Kyra Nickaline Watson-gordon
    5 (1)
    OneClick Online Account Manager is a powerful utility that helps you to manage all your accounts from a centralized panel. It is suitable for all single account traders and specially for multiple accounts traders. The utility help you to : Monitor status of all accounts on a private web page. Some information such as account connection status, account profit, DD, Balance, Equity, Margin Level, Number of positions and orders, Daily and Weekly profit/loss and also overall summation of all these
    There is Demo version of this panel Dashboard Symphonie Trader System MT5 Demo in my product list, please try it out to get familiar with all functionalities for free. Free version: LINK MT4 version: LINK  This system basically utilizes Symphonie Indicator Set (Extreme, Emotion, Trend, and Sentiment) as the core indicators to generate trading signal mainly on time-frame M15. The signal will be further filtered and trimmed by 1) M5 and M15 Stochastic; 2) EMA5 and PA To facilitate you to understan
    Mais do autor
    The indicator draws support and resistance lines on an important part of the chart for making decisions. After the trend line appears, you can trade for a breakout or rebound from it, as well as place orders near it. Outdated trend lines are deleted automatically. Thus, we always deal with the most up-to-date lines. The indicator is not redrawn . Settings: Size_History  - the size of the calculated history. Num_Candles_extremum  - the number of candles on each side of the extremum. Type_Ar
    Ichimoku Map (instant look at the markets) - built on the basis of the legendary Ichimoku Kinko Hyo indicator. The task of the Ichimoku Map is to provide information about the market strength on the selected time periods and instruments, from the point of view of the Ichimoku indicator. The indicator displays 7 degrees of buy signal strength and 7 degrees of sell signal strength. The stronger the trend, the brighter the signal rectangle in the table. The table can be dragged with the mouse. T
    The indicator is a trading system for short-term trading. Scalper Assistant helps to determine the direction of the transaction, and also shows the entry and exit points. The indicator draws two lines (possible points for opening positions). At the moment of the breakdown of the upper line up (and when all trading conditions are met), an up arrow appears (a buy signal), as well as 2 goals. At the moment of the breakdown of the lower line down (and when all trading conditions are met), a do
    The trading system is designed to work with gold on time periods: 30M, 1H. The indicator allows you to adjust to the market situation. Parameters for 1H :   PERIOD=9F ,   FILTER=300 .   Parameters for  30M :   PERIOD=22B ,   FILTER=450 .     A small adjustment to a specific broker is allowed .   If you change the amount of history displayed, you may also need to adjust the parameters. The indicator is not redrawn.     "Gold n XAU" uses different rules for entering a trade and different
    Turn
    Pavel Verveyko
    The indicator shows the market turning points (entry points). Reversals allow you to track rebound/breakout/testing from the reverse side of the lines of graphical analysis or indicators. Reversals can be an independent signal. The indicator allows you to determine reversals taking into account the trend and without it. You can choose a different period for the movement preceding the reversal, as well as the volatility coefficient. When plotting reversals, the indicator takes into account vola
    Length Movement
    Pavel Verveyko
    5 (1)
    Measures the length of the selected movement in points, shows the duration of the movement, as well as the speed of movement.   Outputs the average value of each dimension. It is designed to calculate the expected target based on typical market movements. The intended goal will provide information about the ratio of the stop size to the possible profit and will allow you not to open positions with a small expected profit. It will also help you determine the point at which it is more logical t
    The indicator allows you to quickly switch from one instrument to another, from one time period to another using the keyboard or buttons on the monitor. Each command can be assigned a hot key from 0-9, a-Z (case-insensitive) and VK_OEM_COMMA ("<" on the keyboard) and VK_OEM_PERIOD (">" on the keyboard). This can help you to operate the maximum number of instruments that are available at your broker, analyze more instruments/periods in less time. This product cannot be tested in the tester , beca
    Ratio TP SL
    Pavel Verveyko
    5 (1)
    This indicator allows you to measure the profitability of each specific transaction (the ratio of Stop and Profit). The indicator allows you to adjust the ratio by step size and number of steps. You can build an unlimited number of ratios to compare the risks from different movements. Note: in MT4, the number of horizontal lines in a single ratio cannot exceed 32. Building a line : click the " Ratio " button and draw a line (mouse click - the first point of the line, where the mouse is relea
    Corporate Report
    Pavel Verveyko
    5 (1)
    The script displays info about the share's corporate reports and dividends. The data is downloaded from   investing.com : Report date Profit per share (EPS) Revenue Market capitalization Amount of dividends Date of payment of dividends Dividend income The product cannot be tested in the tester (since it is not possible to receive data from the Internet). Before launching:  Add 2   URL   https://ru.investing.com/earnings-calendar/Service/getCalendarFilteredData  and   https://ru.investing.com/
    Channel FTF
    Pavel Verveyko
    The Envelopes indicator determines the presence of a trend or flat. It has 3 types of signals, shows the probable retracement levels and levels of the possible targets. The Fibonacci coefficients are used in the indicator's calculations. Signals (generated when touching the lines or rebounding from lines): Trend - the middle line of the Envelopes has a distinct inclination; the lines below the channel's middle line are used for buy trades, the lines above the middle line and the middle line itse
    Mr Big
    Pavel Verveyko
    The indicator shows and highlights the chart candles, which are formed as a result of large players entering the market in large volumes. Such candles can also be formed after achieving a certainty on the market, when most of the participants hold positions in the same direction. The movement is likely to continue in that direction after such candles. The indicator highlights the significant candles from the existing ones on the chart; The indicator allows identifying the trends based on candles
    Splash
    Pavel Verveyko
    The indicator identifies the most suitable moment for entering the market in terms of market volatility, when the market has the strength to move (the signal is indicated by an arrow under the candle). For each of the signals, the presence of trends on the current and higher timeframes is determined, so that the signal is in the direction of the majority of positions opened on the market (denoted near the signal by abbreviations of timeframes with a trend present). The signal appears after the c
    The indicator displays the key support and resistance levels on the chart. The significance of these levels lies in that the price may reverse or strengthen the movement when passing such levels, since they are formed as a consequence of the natural reaction of market participants to the price movement, depending on which positions they occupied or did not have time to occupy. The psychology of the level occurrence: there always those who bought, sold, hesitated to enter or exited early. If the
    This indicator is a multitimeframe trading strategy. It has the levels for stop loss, take profit and entry point. The order level can also be set manually. The indicator uses the regularity of the market, which manifests itself on all instruments, and does not require adjustment of the parameters. The strategy uses a proprietary approach to determining: trend, volatility, hierarchy of timeframe significance, the size of the history period (the number of candles), which is important for making a
    Trend Sync
    Pavel Verveyko
    5 (1)
    The indicator shows the trend of 3 timeframes: higher timeframe; medium timeframe; smaller (current) timeframe, where the indicator is running. The indicator should be launched on a chart with a timeframe smaller than the higher and medium ones. The idea is to use the trend strength when opening positions. Combination of 3 timeframes (smaller, medium, higher) allows the trend to be followed at all levels of the instrument. The higher timeframes are used for calculations. Therefore, sudden change
    The indicator detects important peaks and troughs (extremes) on the chart. These points can be used to plot support/resistance levels and trend lines, as well as any other graphical analysis. These points can serve as reference points for setting trading orders. The indicator does not redraw . Settings: Size_History  - the size of the calculated history. Num_Candles_Right  - number of candles to the right of the peak or trough. Num_Candles_Left  - number of candles to the left of the pea
    Running along Lines
    Pavel Verveyko
    3 (2)
    The indicator draws support and resistance lines on an important part of the chart for making decisions. After the trend line appears, you can trade for a breakout or rebound from it, as well as place orders near it. Outdated trend lines are deleted automatically. Thus, we always deal with the most up-to-date lines. The indicator is not redrawn . Settings: Size_History  - the size of the calculated history. Num_Candles_extremum  - the number of candles on each side of the extremum. Type_Ar
    Key Volumes
    Pavel Verveyko
    1 (1)
    The indicator shows key volumes confirmed by the price movement. The indicator allows you to analyze volumes in the direction, frequency of occurrence, and their value. There are 2 modes of operation: taking into account the trend and not taking into account the trend (if the parameter Period_Trend = 0, then the trend is not taken into account; if the parameter Period_Trend is greater than zero, then the trend is taken into account in volumes). The indicator does not redraw . Settings Histo
    This trading system is based on market impulses of varying complexity.   To generate a signal, the indicator uses the moments when the direction of the pulse and the necessary section of the trend coincide. The indicator also takes into account the current market volatility. Stop_loss tags can be set with the parameter "0" or "1", then Stop_Loss will take into account market volatility.   Take_Profit tags can be set with the parameter "0", then Take_Profit will take into account market volat
    Indexes
    Pavel Verveyko
    The stocks that make up the index are one of the drivers of the movement. Analyzing the financial performance of all elements of the index, we can assume further development of the situation. The program (script) displays corporate reports of shares that are part of the index selected in the settings.   "Indexes" cannot be tested in the tester (since there is no way to get information from the Internet). Information is downloaded from the site investing.com: Report Date Earnings per share
    Fibo World
    Pavel Verveyko
    The indicator builds a graphical analysis based on the Fibonacci theory. Fibo Fan is used for the analysis of the impulses and corrections of the movement. Reversal lines (2 lines at the base of the Fibonacci fan) are used to analyze the direction of movements. The indicator displays the of 4 the target line in each direction. The indicator takes into account market volatility. If the price is above the reversal lines, it makes sense to consider buying, if lower, then selling. You can op
    The indicator determines the state of the market: trend or flat. The state of the market is determined by taking into account volatility. The flat (trading corridor)is displayed in yellow. The green color shows the upward trend. The red color shows the downward trend. The height of the label corresponds to the volatility in the market. The indicator does not redraw . Settings History_Size   - the amount of history for calculation. Period_Candles  - the number of candles to calculate the
    The indicator plots flexible support and resistance levels (dots). A special phase of movement is used for construction. Levels are formed dynamically, that is, each new candle can continue the level or complete it. The level can provide resistance or support to the price even where it is no longer there. Also, support and resistance levels can change roles. The importance of levels is affected by: the amount of time the level is formed and the number of touches. The significance of these l
    The indicator is a trading system for short-term trading. Scalper Assistant helps to determine the direction of the transaction, and also shows the entry and exit points. The indicator draws two lines (possible points for opening positions). At the moment of the breakdown of the upper line up (and when all trading conditions are met), an up arrow appears (a buy signal), as well as 2 goals. At the moment of the breakdown of the lower line down (and when all trading conditions are met), a do
    Gold n XAU
    Pavel Verveyko
    The trading system is designed to work with gold on time periods: 30M, 1H. The indicator allows you to adjust to the market situation. Parameters for 1H :   PERIOD=9F ,   FILTER=300 .   Parameters for  30M :   PERIOD=22B ,   FILTER=450 .   A small adjustment to a specific broker is allowed .   If you change the amount of history displayed, you may also need to adjust the parameters. The indicator is not redrawn.     "Gold n XAU" uses different rules for entering a trade and different ru
    The indicator determines the most important component of any trading system - the possible exit point from the transaction. As the price moves, depending on the market situation, the indicator builds goals. The target becomes relevant when the price starts moving towards the target. If the movement is strong, then it may take a certain number of targets to stop or reverse price. The accumulation of targets is most likely able to stop the price. Some goals are executed several times. But the
    The indicator builds "psychological levels": levels of round numbers and intermediate levels of round numbers. Round numbers play an important role in forming support and resistance levels. There is a pattern in which the decline or growth of the price can stop at round numbers. The level whose price ends at 0 is the level of a round number of the first order. Intermediate level, this is the level between two round levels, for example, between 10 and 20 this is level 15. In the " Num_Zero
    Ichimoku Map (instant look at the markets) - built on the basis of the legendary Ichimoku Kinko Hyo indicator. The task of the Ichimoku Map is to provide information about the market strength on the selected time periods and instruments, from the point of view of the Ichimoku indicator. The indicator displays 7 degrees of buy signal strength and 7 degrees of sell signal strength. The stronger the trend, the brighter the signal rectangle in the table. The table can be dragged with the mouse. T
    The indicator displays a stock chart of a non-standard type, in which the price and time have the same value. The usual chart of Japanese candlesticks does not take into account all the information that the time analysis can give. Renko charts do not use all the information that price can give in relation to time. The "Chart Price and Time" indicator takes into account price and time equally and shows the predominance of price or time. Taking into account price and time equally gives an i
    The indicator tracks sharp volatility (moments when the market has shown increased activity and movement may occur), on the selected instruments and time periods. The information is displayed as colored rectangles. Thus, it is possible to assess at a glance which tool should be given priority attention. The indicator will be useful for scalpers when they need a quick reaction or for traders working with a large number of instruments. The indicator does not redraw. The indicator displays 8 degr
    Filtro:
    krisnara123
    1916
    krisnara123 2020.12.11 14:22 
     

    O usuário não deixou nenhum comentário para sua avaliação

    Responder ao comentário
    Versão 1.5 2020.12.08
    Added a goal label - the goal is set automatically if the "goal" button is enabled.
    (to set a goal, you need at least two lines in different directions).

    Added text placemark orientation (right/left).

    Added the ability to cancel the "delete all measuring lines" command
    (you can select the desired number of seconds in the settings).

    Average time indicators have been added to the "average values" text labels. And the number of measurement lines.
    Versão 1.4 2020.12.02
    Added text labels for "average values".
    "Average values" are calculated along the lines of the time period of the open chart.
    The "measuring line" drawn on the H4 graph is visible and is taken into account in calculations only on the H4 graph.
    Versão 1.3 2020.12.01
    1 Added new information about the line: time (now you can see the time period on which the line is drawn, and the number of candles in the line of this time period).
    2 Added new information about the line: speed (average size of candlesticks in the line).
    3 Improved drawing mechanism: you need to click the "Pips" button and draw on the graph (clicking the mouse is the first point of the line, where the mouse is released - the second point of the line).
    4 Now you can drag the buttons with the mouse.
    5 Keyboard shortcuts (you can assign keyboard shortcuts (A-Z) to on-screen buttons).
    6 When you rebuild a line, the value of the text label changes immediately.
    Versão 1.2 2020.06.09
    Recompilation.
    Versão 1.1 2019.06.18
    Added settings:
    1) indentation of the price tag.
    2) option for calculating points (standard, fractional, rounded).