Vortex Trend Indicator
- Indicadores
- Francesco Petralla
- Versão: 1.1
- Atualizado: 24 março 2020
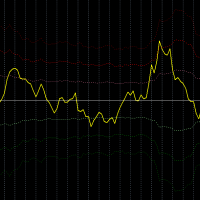
Developed by Etienne Botes and Douglas Siepman, the Vortex Indicator consists of two oscillators that capture positive and negative trend movement. In creating this indicator, Botes and Seipman drew on the work of Welles Wilder and Viktor Schauberger, who is considered the father of implosion technology. Despite a rather involved formula, the indicator is quite straightforward to understand and easy to interpret.
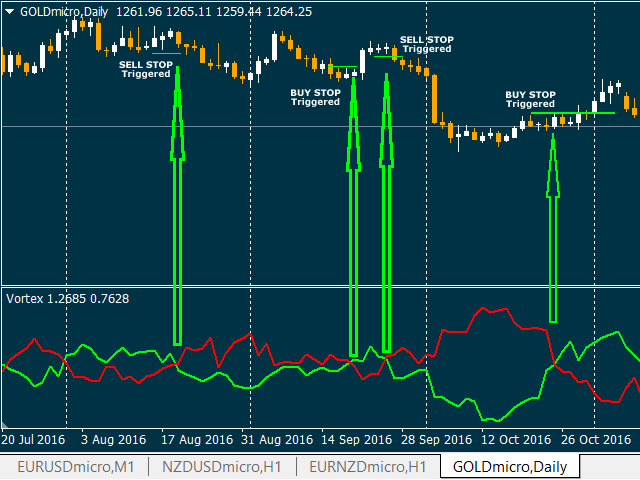
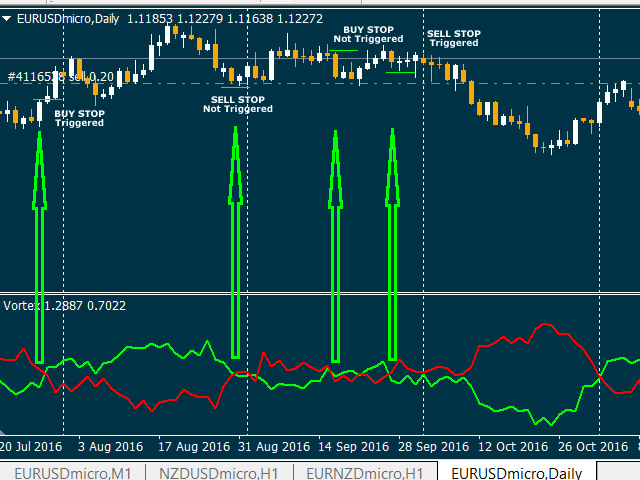
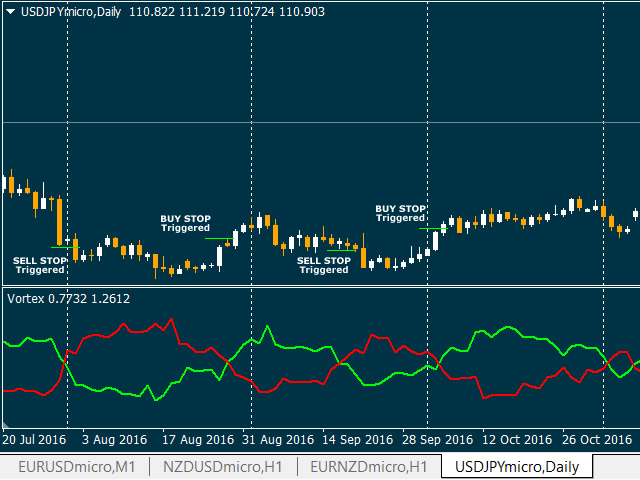
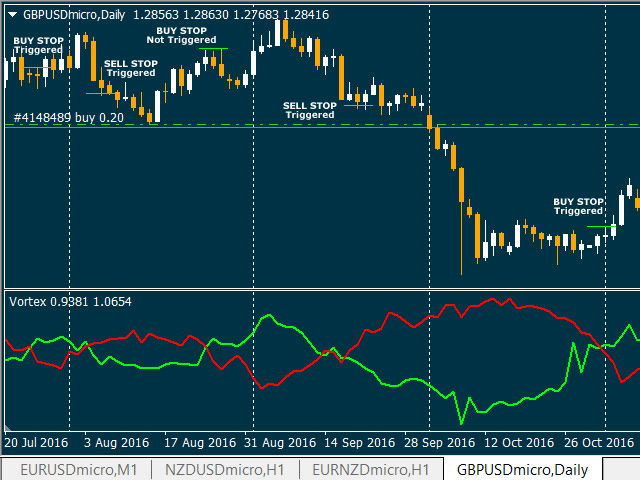
- A bullish signal triggers when the positive trend indicator (VI+ green line) crosses down up the negative trend indicator (VI- red line) or a key level. It's recommended to open a BUY STOP order on High level of the bar.
- A bearish signal triggers when the negative trend indicator (VI- red line) crosses down up the positive trend indicator (VI+ green line) or a key level. It's recommended to open a SELL STOP order on Low level of the bar.
The Vortex Indicator is either above or below these levels, which means it always has a clear bullish or bearish bias. Better performance on H4 and D1 timeframes.
Parameters
- period: default is 14.
- VI_Plus: color for positive trend line (VI+).
- VI_Minus: color for negative trend line (VI-).












USING AT H1-H4 AFTER CHANGED THE PERIOD FROM 14 TO 28 , GOOD TOOL . THANK YOU