Ticks RSI 4
- Indicadores
- Andrej Nikitin
- Versão: 1.12
- Atualizado: 17 novembro 2021
- Ativações: 5
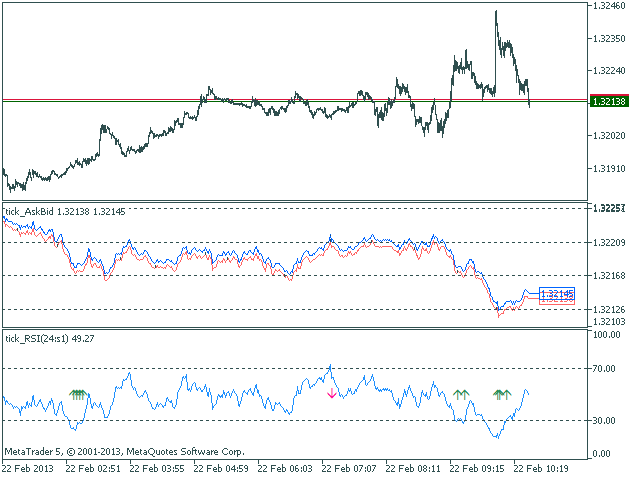
The Relative Strength Index indicator drawn using a tick chart.
After launching it, wait for enough ticks to come.
Parameters:
- RSI Period - period of averaging.
- overbuying level - overbought level.
- overselling level - oversold level.
- calculated bar - number of bars on the chart for the indicator calculation.
The following parameters are intended for adjusting the weight of RSI signals (from 0 to 100). You can find their description in the Signals of the Oscillator Relative Strength Index section of MQL5 Reference.
- The oscillator has required direction.
- Reverse behind the level of overbought/oversold level.
- Failed swing.
- Divergence of the oscillator and price.
- Double divergence of the oscillator and price.
- Head/shoulders.
Buffer indexes: 0 - RSI_LINE, 1 - SIGNAL_UP, 2 - SIGNAL_DOWN, 3 - BID, 4 - ASK.