Retracement MT5 Indicator by PipTick
- Indicadores
- Michal Jurnik
- Versão: 1.1
- Atualizado: 1 dezembro 2021
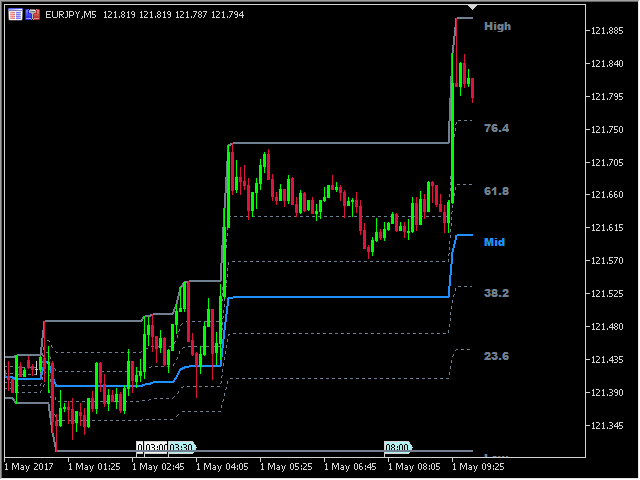
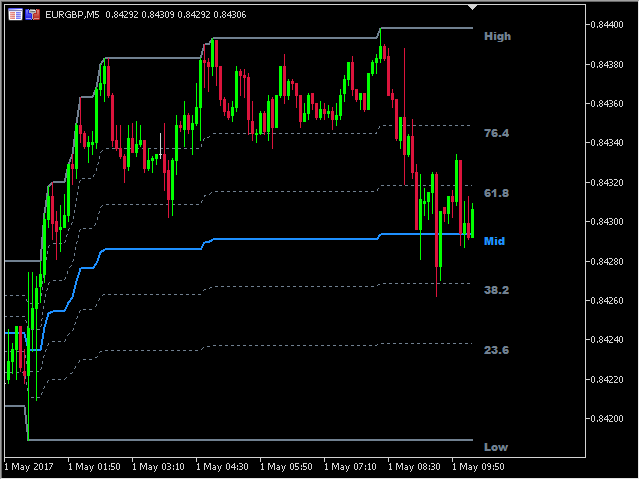
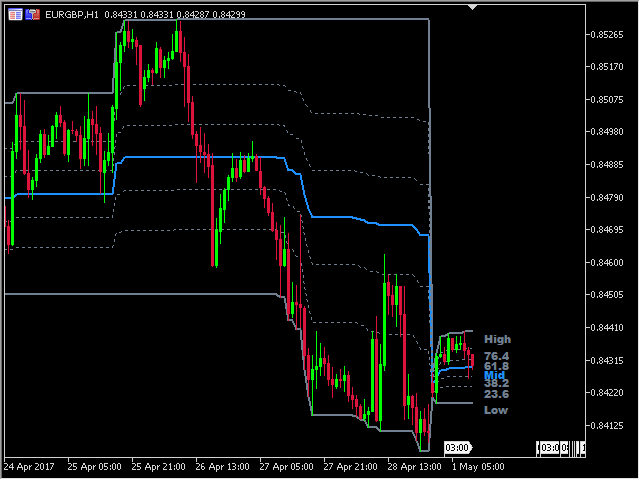
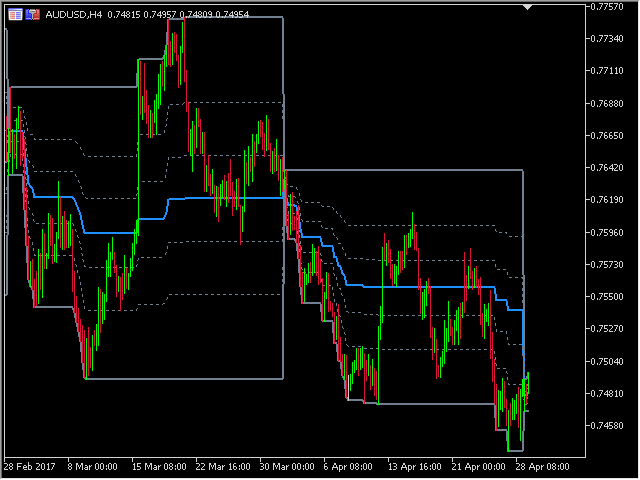
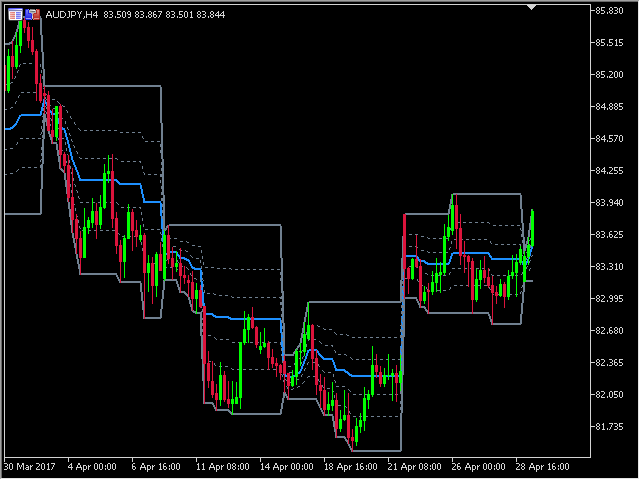
The Retracement indicator shows the current and historical high, low and mid values. Optionally, it can also display major retracement levels. All these levels together form the significant levels of support and resistance. Therefore, it is essential to know them for every kind of trader.
Levels
- High
- Low
- Midpoint
- 76,4 %
- 61,8 %
- 38,2 %
- 23,6 %
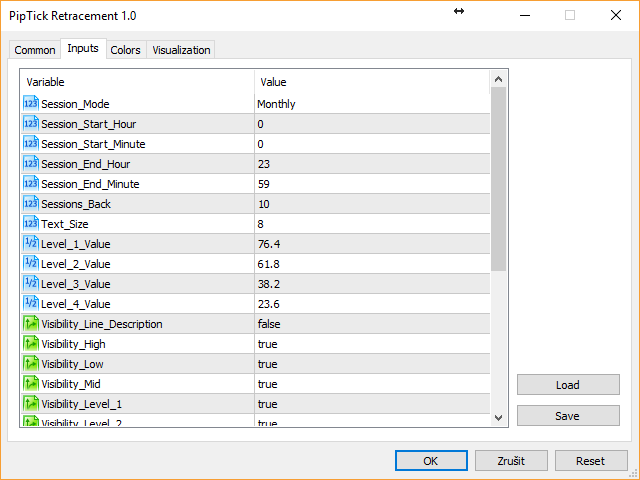
Main features
- The indicator shows the actual levels of High, Low, Mid and selected retracements.
- Four optional retracement levels.
- Alert notifications for indicator lines.
- Custom session time.
- Works on every timeframe (M1, M5, M15, M30, H1, H4, D1, W1, MN).
- The indicator is non-repainting.
- Ready for backtesting.
- Customizable parameters (Colors, Line thickness, Visibility...).
- High-speed calculation.
- Available for MT4 and MT5.
Please visit the Retracement indicator product page for the input and output parameters settings.