• Visão global
  • Comentários
  • Discussão (4)
  • O que há de novo

Ejike Currency Basket

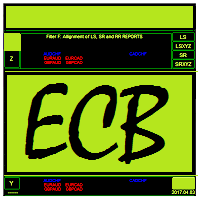
Ejike Currency Basket compiles and analyses foreign exchange currency strength and volatility dynamics for the 8 major currencies. Its data are formulated from market prices and volatility. ECB visually cross-references its own reports to generate high probability trade pairs, the build-up to which is interactive that the trader can easily assume the role of Analyst. Its 28-pair real time monitoring involves a constant comparison of its current to past data. On adjusting a parameter, it will change from a dashboard to an indicator used for trade entry and trade monitoring.

The advantages:

  • focus in trading
  • precision data presented in numerals
  • simplified real time data analyses
  • interactive application interface and
  • capacity to recall historic data without recourse to the Strategy Tester.

The use of this tool brings relaxed approach to FX trading, improves trader’s confidence, focus and the precision of his/her trading decisions. Past data analyses are made possible by the use of the Strategy Tester to regenerate past snapshots of reports or by simply adjusting ECBindex parameter.

How it works:

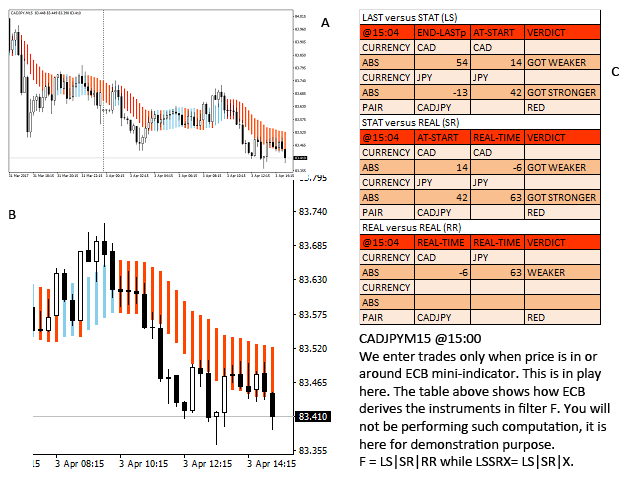
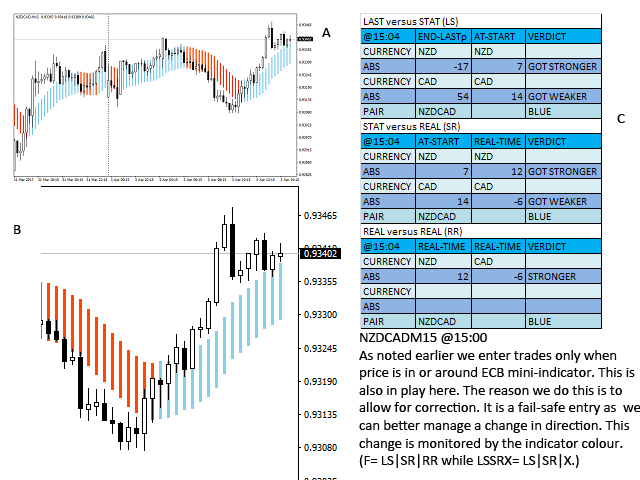
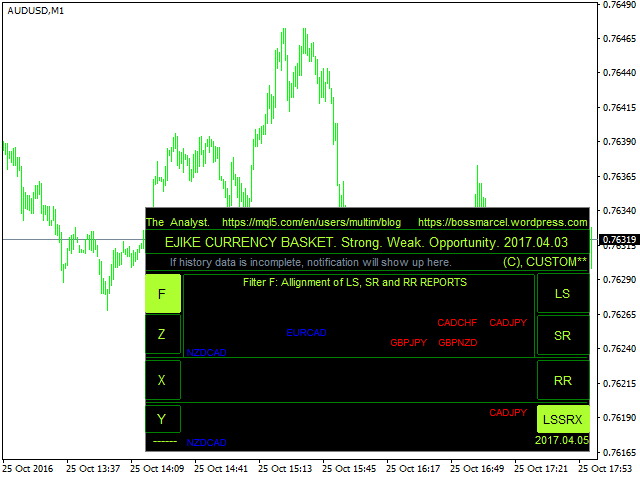
  • The robot computes, synchronizes and cross references the X, Y, Z, LS, SR, and RR sections reports and then publishes to the filters, LSSRX and "F", a summary of Strength, Weakness and Opportunity for Trade ("SWOT") in relevant currency pairs. Its suggestions are reliable.
  • The Trader observes, confirms and uses ECBmini indicator to enter and monitor trades. This is easy in practice.

Indicator parameters

The first four parameters in the list of parameters are:

  • ECBindex - the candle or bar index that determines the position from which the strength computation and analyses are performed.
  • ECB Mode: Dashboard - the mode of operation of the application, when the value is set to true the application is in the ECB dashboard mode but when set to false the application goes into the ECBmini indicator mode. The dashboard is use for analyses while the indicator is used for trade management. It is recommended that ECBmini indicator is used on time frames M15 and M30 if Strength Computation Timeframe parameter is set to D1.
  • Strength Computation Timeframe - The time frame for strength computation and analyses.
  • Enable Automatic Refresh - The value of true means that data are updated automatically.

Apart from those displayed externally, crucial parameters have been optimized and configured to work internally and thus do not require further configuration by way of external inputs. For access to most of ECB information the trader may click on buttons on the application interface. When the trader arrives at the decision to take a trade, the second parameter in the list of parameters, "ECB Mode: Dashboard", is to be set to false to switch to the ECBmini indicator that is included to help the trader to NOT jump into trades but to anticipate “sweet spots” or points of entry. Trading this way ensures we can apply the method repeatedly. The trader is to “Enable Auto Refresh” by setting the very parameter to true otherwise he/she has to hit “F” or “LSSRX” button to refresh data manually.

New and Experienced Traders

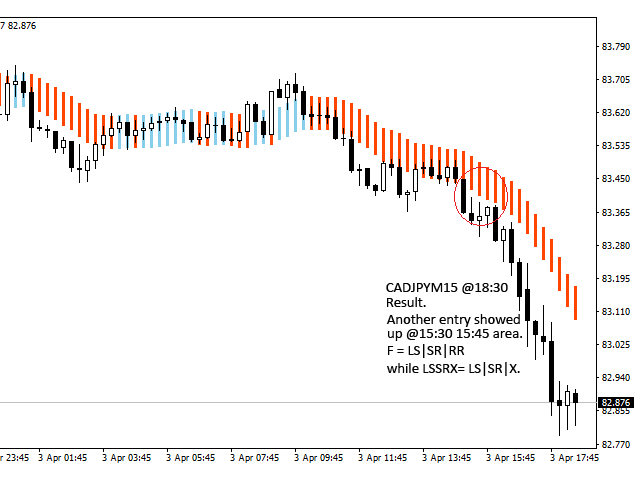
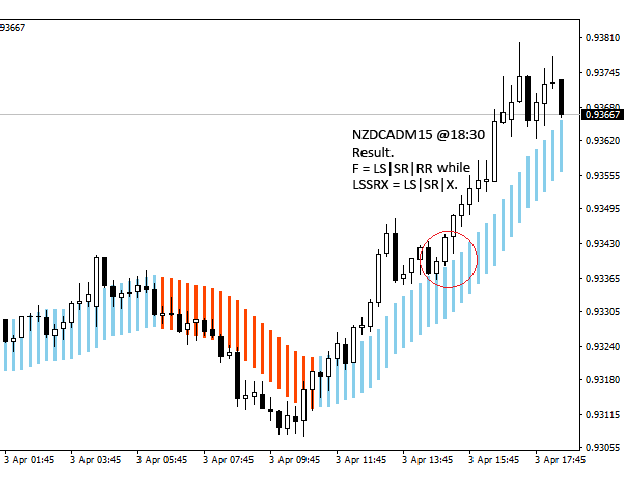
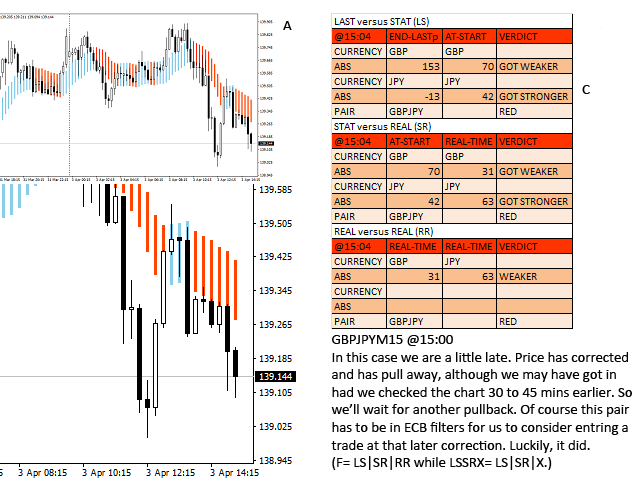
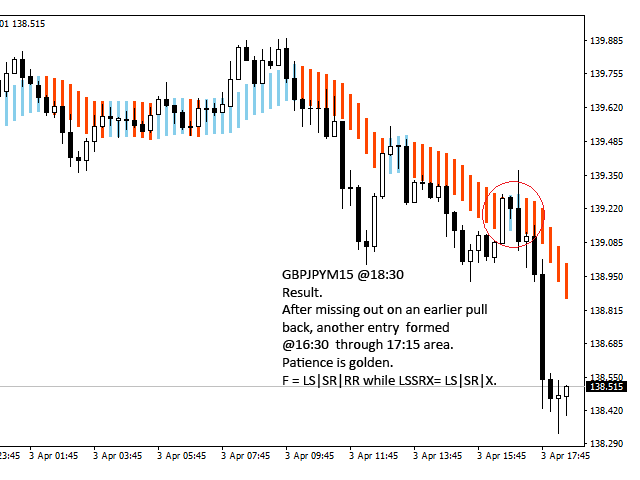
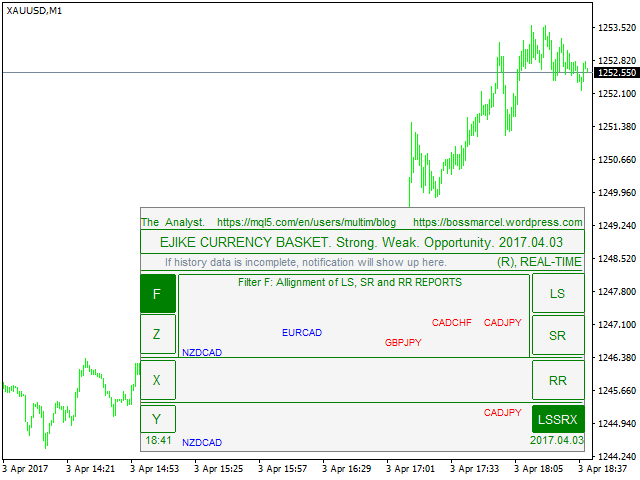
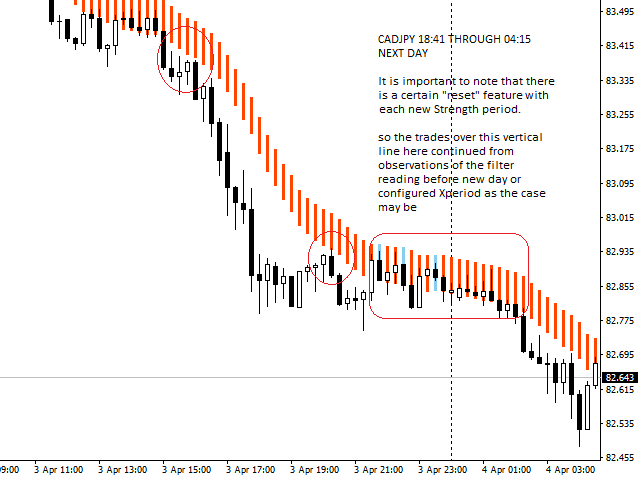
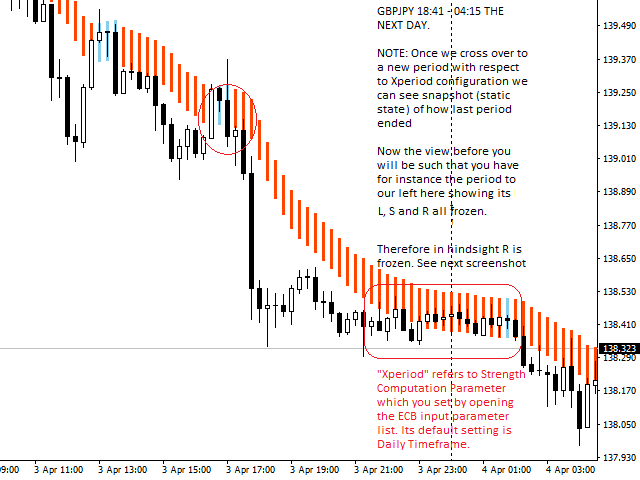
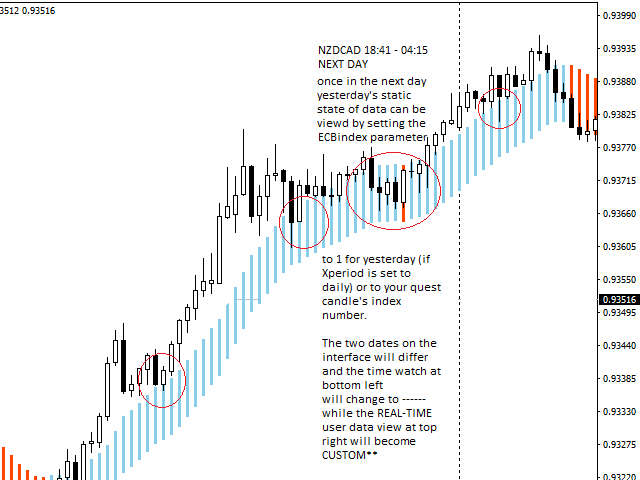
For the new/inexperienced or the trader who does not wish to task his/her mind further when trading, this tool was designed to be used at any level of experience. Therefore, selecting the pairs displayed in LSSRX or "F" for trading and following the simple entry rule may be sufficient. But, while an experienced trader already knows the power of a well formulated system of currency groups, a new trader has the potential to learn. That said a trader should combine the reports of "Y" and "Z" to reinforce those of "F" and LSSRX. He/she will find this an easy task, for the objective of ECB is to keep FX trading simple as well as profitable. "Y" report shows "resilience" in currency pairs while "Z" report shows alignment of absolute strengths (i.e the numbers in brackets) ordered left to right as "L", "S" and "R". The trader may use ECB as described in product description screenshots. These are useful because the examples therein were observed live on April 3, 2017, from 15:04 Alpari Standard3 Server Time to 18:41 same day and by extension from 18:41 to 04:15 next trading day. Do well to visit developer's blog on mql5.com for more and more examples. Happy trading.
Produtos recomendados
Forex Flow Equalizer is an indicator that helps to reduce 'noise' in forex price movements. Visit https://www.mql5.com/en/blogs/post/751167 for more detailed explanation. It is programmed to enhance traders' focus, and capacity to monitor or manage multiple instruments of interest on preferred timeframe without their minds being over loaded with data or information, thereby, saving them the mental strength for more important trading decision making. Range Mode: is for traders who like to trade
Breakeven line calculator MT4
Wafa Mohammed Omar Abou Alwafa
This indicator shows the breakeven line level for the total number of open positions of the current symbol with P/L value and total volume. This indicator is helpful to decide the exit level when using a trading grid strategy. The style of the breakeven line is customizable to choose the color, line shape and font size of the positions description. Send mobile notification when crossing a positive P/L target
FREE
The UNIVERSAL DASHBOARD indicator will eliminate the need of using dozens of indicators on dozens of charts. From one place you can monitor all the pairs and all the timeframes for each of the following indicators: MACD STOCHASTIC WPR RSI CCI You can also use any Custom indicator in the dashboard as long as it has a readable buffer. With a single click you can quickly navigate between charts, pairs and timeframes. Alerts will provide clear indication about what happens for your favorite pairs on
FREE
This indicator will display current logined mt4 account's orders information of current symbol chart. It also allow import some formated data: 1) MQL5 Signals History CSV file (*.csv) 2) MT4 Account History Statement file (*.htm -> *.txt) *[Next Version] Allow Import data form 'HF HistoryExporter (*.csv)' Sample Data of MQL5 Signals History File Time;Type;Volume;Symbol;Price;S/L;T/P;Time;Price;Commission;Swap;Profit;Comment 2023.12.20 23:00:02;Buy Limit;0.06;EURUSD;1.08994;1.06024;1.09464;2
PhoeniXX Adaptive EA : Automating Dynamic Lot Sizing and Progressive Trading by Following Original Trades Once Opened and Closed for Advanced Trade Copying and Management   20 pips Challenge Explained: https://www.youtube.com/watch?v=qzlLS9SjSV4 Key Differences: - PhoeniXX EA:    - Allows the user to choose between two modes:      -  Steps Mode: Based on the 20 Pips Challenge with fixed, programmed steps.     - Multiplier Mode: Allows the user to set the desired multiplier for the next step,
FREE
Introducing the   “Symbol Cost Info MT4”   indicator – your ultimate tool for staying ahead in the forex market! This innovative indicator is designed to empower traders with real-time cost information, directly on their charts. Here’s why every trader needs the “Symbol Cost Info MT4” in their arsenal: Real-Time Spread Monitoring : Keep a close eye on the spread for any currency pair, ensuring you enter the market at the most cost-effective times. Pip Value at Your Fingertips : Instantly know t
FREE
US30 And US100 Top-Down Analysis EA MT4 analyzing the overall market environment and economic conditions first before zooming in to the lower timeframe for entry. Starting from the big picture DAILY and then narrowing down to 1 HOUR and take the entry in 5M timeframe This EA adapt to changing market conditions, continuously monitoring macroeconomic indicators and sector performance, and adjust the trading strategies to capitalize on emerging trends. US30 And US100 Top-Down Analysis EA MT4 does n
This Dashboard displays signals in grid view for the 28 major fx currency pairs. It is Mainly used for forex scalping in between 10 to 20 pips maximum and can be used on major trend market decisions. It Uses mainly Moving average and does not give false signal. All you need to note is the point in the grid where the signal occurs.  A beep sound is heard whenever there is a new signal and it will be displayedat the top of the chart.
Super Mart
Evgeny Vlasov
Operation principles The Expert Advisor works on any timeframe and symbol. The robot analyzes the relative MAs position. Pending orders are opened after the necessary conditions are met. No next order is opened till the previous one is closed. The server time is analyzed when opening orders. The EA opens orders in the most appropriate trading periods. A lot volume ratio is used when entering the market. The lot volume is changed during trading. You only need to set six parameters. Parameters S
Delving deep into the sphere of finance and trading strategies, I decided to conduct a series of experiments, exploring approaches based on reinforcement learning as well as those operating without it. Applying these methods, I managed to formulate a nuanced conclusion, pivotal for understanding the significance of unique strategies in contemporary trading.  
FREE
Top Gun Oscillators
Safwan Rushdi Khalil Arekat
5 (1)
Note : New in 1.6: the indicator now exports the trade signal (but not displayed). Go long with light blue. Go short with red. Exit otherwise. Signal to be imported to your EA using iCustom. This indicator provides Best of the Best linear filter momentum oscillators that I am aware of (Low Pass Differentiators, LPD's) . All of them are  recent developments by this developer, or other researchers. The oscillator line is the first buffer of the indicator, and can be called  in other indicators or
FREE
This is the linear regression indicator for basic indicators included in the standard package of the MetaTrader 4 terminal. It is used for the analysis of price movements and market mood. The market mood is judged by the slope of the linear regression and price being below or above this line. Regression line breakthrough by the indicator line may serve as a market entry signal. There is possibility of setting the color for bullish and bearish sentiments of the basic indicators as well as plottin
PM Redefine
Samuel Akinbowale
PM Redefine : Is Simply, Simple, Straight and Direct in opening orders and closing of orders; PM Redefine : Can be run in all type of instrument.{Forex, Commodity ,Stock, or Cryptocurrencies}. PM Redefine : Can be run in all type of TimeFrame,{M1,M5,M15,M30 , H60, H240, D, W, M}. PM Redefine : can be used for scalping and day trading. Input Parameters typeFrom_0_to_9: type in between 0 and 9 ; upper_levelAlert: if line cross this predefine level up , Arrow Buy show if : showArrow =true: lo
Super volumes
Yerzhan Satov
4 (1)
O indicador de seta para Forex e Opções Binárias é criado com base nos volumes de ticks. Ao contrário de muitos indicadores, o indicador "Super volumes" calcula volumes de alta e baixa e emite sinais sobre a predominância de qualquer um deles. Se digamos que, no momento, nesse intervalo, havia uma vantagem de volumes de alta, então o sinal estará em Buy. Ou se a predominância foi de volumes de baixa, então, respectivamente, o sinal será Sell. Nas configurações do indicador, na variável "volum
Virtual Exchange Reserve Equity Monitor In an environment where exchanges offer increasingly high leverage ratios, it is all the more important for traders to tightly regulate their level of equity .  This software is designed to be run in the background on any virtual private server that can run Meta Trader 4/5.  It implements basic equity control functions ahead of the broker---allowing users to set their own equity trailing stop, an equity limit to lock-in a certain profit margin, and a unive
FREE
O indicador Boom and Crash Spike Detector é codificado com base em uma estratégia avançada principalmente para detectar o Boom e o Crash nos preços. Algoritmos complexos foram implantados para detectar Booms e Crashs de alta probabilidade nos preços. Ele alerta sobre possíveis fases de Boom ou crash: Fase Boom: Quando o preço aumenta muito rápido. Fase Crash: Quando o preço cai muito rápido. OFERTA POR TEMPO LIMITADO: O Indicador está disponível por apenas 30$ e vitalício. Características pr
Introducing "TG Trade Service Manager" — your all-in-one solution for seamless trade management in both MQL4 and MQL5 environments. With a focus on speed, reliability, and convenience, this powerful library simplifies the complexities of trade execution and management, empowering developers with a single interface for enhanced efficiency. Metatrader5 Version |  All Products  |  Contact Key Features: Unified Interface : TG Trade Service Manager" provides a unified interface for   MQL4   and  
Candle finder robot MT4 Candle finder robot is one of the trading assistant tools that helps the trader, this tool helps the trader to examine all the currency pairs that are in the Metatrader watch list in detail within a few seconds. Find the desired signals. According to the strategy that is defined for this robot, in your watch list, it carefully looks for trend change candles, there are many trend change candles that traders use in their trading decisions. This robot can simply check all
Forex Market Profile and Vwap
Lorentzos Roussos
4.83 (6)
Perfil do mercado Forex (FMP para breve) se você preferir ver isso em um gráfico ao vivo em vez de ler a descrição, você pode baixar instantaneamente uma demonstração gratuita aqui. O que isso não é: O FMP não é a exibição TPO clássica codificada por letras, não exibe o cálculo geral do perfil de dados do gráfico e não segmenta o gráfico em períodos e os calcula. O que faz : Mais importante ainda, o indicador FMP processará dados que residem entre a borda esquerda do espectro definido p
FREE
Every indicator has its advantages and disadvantages. Trending ones show good signals during a trend, but lag during a flat. Flat ones thrive in the flat, but die off as soon as a trend comes. All this would not be a problem, if it was easy to predict when a flat changes to a trend and when a trend changes to a flat, but in practice it is an extremely serious task. What if you develop such an algorithm, which could eliminate an indicator's flaws and enhance its strengths? What if such an algori
AI TradingVision GPX MT4
Yu Mei Cheng
4.64 (14)
Precauções O EA inclui até 6 pontos de entrada, e o número de mãos por transação é o número de mãos da ordem multiplicado por 6, por isso, tenha cuidado para não usar demasiadas mãos. O método de cálculo das mãos por defeito não é uma percentagem de fundos. O nosso método de cálculo por defeito não é afetado pela alavancagem e permite controlar o risco de forma mais precisa. É recomendado utilizar fundos acima de $1000 para melhorar a resistência ao risco. Existe um risco de acumulação de risco
O indicador R Alligator foi introduzido por Bill Williams, segue a tendência com a ajuda de 3 médias móveis suavizadas. Por padrão, os seguintes valores são usados: A média móvel suavizada de 13 períodos (conhecida como Jaw) A média móvel suavizada de 8 períodos (conhecida como Teeth) A média móvel suavizada de 5 períodos (conhecida como Lips) O indicador R Alligator reduz o número de negociações de tendências falsas por meio do uso de médias móveis de suavização. Sinais básicos de negoci
Enhance your price action strategy: inside bar breakouts at your fingertips This indicator detects inside bars of several ranges, making it very easy for price action traders to spot and act on inside bar breakouts. [ Installation Guide | Update Guide | Troubleshooting | FAQ | All Products ] Easy to use and understand Customizable color selections The indicator implements visual/mail/push/sound alerts The indicator does not repaint or backpaint An inside bar is a bar or series of bars which is/
Unlimited Trade Copier Pro is a tool to copy trade remotely to multiple MT4, MT5 and cTrader accounts at different computers/locations over internet. This is an ideal solution for you if you are a signal provider and want to copy your trades to other receivers globally on your own rules. One provider can copy trades to multiple receivers and one receiver can get trade from multiple providers as well. The provider can even set the subscription expiry for each receiver, so that receiver will not b
I Permanent
Vladimir Gorbachev
Universal adaptable indicator. It determines the estimated trading range for the current day based on the available history a real data, and displays the area of the probable price rollback on the chart. All this thanks to the built-in algorithm that automatically adapts to any behavior models of the market quotes. With the parameters adjusted, the indicator shows its effectiveness on most of the currency pairs, that have a rollback from the reached extremums during the current or the next tradi
Praetor EA
Sergei Ozerov
Praetor EA   PRAETOR   is a moderately secure trading system based on a clustering model of trading patterns. It consists of many simple functions and has many parameters that allow you to memorize various market situations and interpret them correctly. The advisor opens one deal in a certain direction and places       Stop Loss       and       Take Profit   , and when a certain profit is reached, the advisor uses       Trailing Stop   . The signals of the model are based on such indicators as
Magic Balance
Daniil Evstratenko
The indicator shows which trading pairs, strategies, robots and signals that you use are profitable and which are not. The statistic of trades and balance graph are displayed in the account currency and pips - to switch simply click on the graph. button "$"(top left) - minimize/expand and move the indicator panel button ">"(bottom right) - stretching and resetting to the original size Statistic of trades 1 line - account balance, current profit and lot of open trades; 2 line - the number of al
Hi! Between the given time range. Adds profit and lot. This can be written on the charter in English and Hungarian. The name of the symbol must be entered exactly. Good used for it. :) Szia! A meg adott idősáv között Összeadja a profitot és lot-ot. Ezt ki írathatjuk Angolul és Magyarul a chartra. Pontosan kell beírni a szimbólum nevét. Jó használatott hozzá. :)
Laguerre SuperTrend Clouds adds an Adaptive Laguerre averaging algorithm and alerts to the widely popular SuperTrend indicator. As the name suggests, Laguerre SuperTrend Clouds (LSC) is a trending indicator which works best in trendy (not choppy) markets. The SuperTrend is an extremely popular indicator for intraday and daily trading, and can be used on any timeframe. Incorporating Laguerre's equation to this can facilitate more robust trend detection and smoother filters. The LSC uses the impro
CHF Portal
Ngo Yung Lau
CHF Portal is designed for Trading USDCHF specifically. Trading Concept The operation concept of CHF Portal is based on an algorithm which tries to determine the Trend. To be more specific, CHF Portal works with its own calculation logic according to historical volatility and price movement. It is trying to find out the Top or Bottom in a Trend, and open the Short or Long Position accordingly. Don't expect CHF Portal can be able to open the trade on the highest or lowest level, because CHF Por
Os compradores deste produto também adquirem
Bull versus Bear
Mohamed Hassan
4.56 (9)
Official Release price of $65 for the first 56 /60   copies ( 4  copies left). Next price is $120 !  Send us a message after your purchase to receive more information on how to get your  BONUS  for FREE  that works in great combination with Bull vs Bear ! Bull versus Bear is an easy-to-use Forex indicator that gives traders clear and accurate signals based on clear trend retests . Forget about lagging indicators or staring at charts for hours because  Bull vs Bear provides real-time entries
- Real price is 80$ - 40% Discount ( It is 49$ now ) Contact me for instruction, add group and any questions! Related Products:  Bitcoin Expert , Gold Expert Introduction The breakout and retest strategy is traded support and resistance levels. it involves price breaking through a previous level.  The break and retest strategy is designed to help traders do two main things, the first is to avoid false breakouts. Many false breakouts start with a candlestick that breaks out of a level but ends w
Gann Made Easy
Oleg Rodin
4.83 (93)
Gann Made Easy é um sistema de negociação Forex profissional e fácil de usar, baseado nos melhores princípios de negociação usando a teoria do sr. W. D. Gann. O indicador fornece sinais precisos de COMPRA e VENDA, incluindo níveis de Stop Loss e Take Profit. Você pode negociar mesmo em movimento usando notificações PUSH. Entre em contato comigo após a compra! Vou compartilhar minhas dicas de negociação com você e ótimos indicadores de bônus de graça! Provavelmente você já ouviu muitas vezes sobr
TrendMaestro
Stefano Frisetti
5 (3)
note: this indicator is for METATRADER4, if you want the version for METATRADER5 this is the link:  https://www.mql5.com/it/market/product/108106 TRENDMAESTRO ver 2.4 TRENDMAESTRO recognizes a new TREND in the bud, he never makes mistakes. The certainty of identifying a new TREND is priceless. DESCRIPTION TRENDMAESTRO identifies a new TREND in the bud, this indicator examines the volatility, volumes and momentum to identify the moment in which there is an explosion of one or more of these data a
FX Volume
Daniel Stein
4.58 (33)
Receba a sua atualização diária do mercado com detalhes e screenshots através do nosso Morning Briefing aqui no mql5 e no Telegram ! O Volume FX é o PRIMEIRO e ÚNICO indicador de volume que fornece uma visão REAL do sentimento do mercado do ponto de vista de um corretor. Ele fornece uma visão incrível de como os participantes do mercado institucional, como corretores, estão posicionados no mercado Forex, muito mais rápido do que os relatórios COT. Ver essas informações diretamente no seu gráfi
TPSpro RFI Levels
Roman Podpora
4.82 (22)
INSTRUÇÕES         Russo   -        ENG       R   ecomendado para uso com um indicador       -       TPSpro   TREND PRO -   Versão MT4         Um elemento-chave na negociação são as zonas ou níveis a partir dos quais as decisões de comprar ou vender um instrumento de negociação são tomadas. Apesar das tentativas dos principais participantes de esconder sua presença no mercado, eles inevitavelmente deixam rastros. Nossa tarefa era aprender como identificar esses rastros e interpretá-los corretame
LEIA AS INFORMAÇÕES ABAIXO ANTES DE COMPRAR O PRODUTO! Apollo Pips PLUS SP é um produto único! É PARA QUEM QUER ADQUIRIR MEU NOVO INDICADOR "APOLLO PIPS" MAIS BÔNUS "SUPER PACK" COM ACESSO A TODOS OS MEUS INDICADORES DE NEGOCIAÇÃO! Ao adquirir o produto Apollo Pips PLUS SP você está na verdade adquirindo uma versão absolutamente nova do meu indicador Apollo Pips. Esta versão do indicador possui um algoritmo aprimorado e um parâmetro fácil de usar que lhe dá a oportunidade de usar o indicador em
Scalper Inside PRO
Alexey Minkov
4.73 (56)
!!! 11.11 - SALE 25% - LIMITED TIME OFFER!!! An exclusive indicator that utilizes an innovative algorithm to swiftly and accurately determine the market trend. The indicator automatically calculates opening, closing, and profit levels, providing detailed trading statistics. With these features, you can choose the most appropriate trading instrument for the current market conditions. Additionally, you can easily integrate your own arrow indicators into Scalper Inside Pro to quickly evaluate the
TPSproTREND PrO
Roman Podpora
4.79 (19)
TPSpro TREND PRO   é um indicador de tendência que analisa automaticamente o mercado e fornece informações sobre a tendência e cada uma de suas mudanças, além de dar sinais para entrar em negociações sem redesenhar! O indicador utiliza cada vela, analisando-as separadamente. referindo-se a diferentes impulsos - impulso para cima ou para baixo. Pontos de entrada exatos em transações de moedas, criptomoedas, metais, ações, índices! Versão MT5                   DESCRIÇÃO COMPLETA DO INDICADOR    
Trend Screener
STE S.S.COMPANY
4.81 (88)
Indicador de tendência, solução única inovadora para negociação e filtragem de tendências com todos os recursos de tendências importantes construídos dentro de uma ferramenta! É um indicador multi-timeframe e multi-moedas 100% sem repintura que pode ser usado em todos os símbolos/instrumentos: forex, commodities, criptomoedas, índices e ações. OFERTA POR TEMPO LIMITADO: O indicador Support and Resistance Screener está disponível por apenas US$ 50e vitalício. (Preço original US$ 250) (oferta este
Deixe um comentário após a compra para receber 4 indicadores de alta qualidade como bônus. O indicador Chart Patterns All-in-One ajuda os traders a visualizar vários padrões gráficos comumente usados na análise técnica. Este indicador auxilia na identificação de comportamentos potenciais do mercado, mas não garante rentabilidade. Recomenda-se testar o indicador no modo demo antes de comprar. Oferta atual : Desconto de 50% no indicador "Chart Patterns All in One". Padrões incluídos : Padrão 1-2-3
Trend Punch
Mohamed Hassan
4.95 (21)
This indicator is unstoppable when combined with our other indicator called  Support & Resistance . After purchase, send us a message and you will get it   for  FREE as a BONUS! Introducing Trend Punch , the revolutionary forex trend indicator that will transform the way you trade! Trend Punch is uniquely designed to provide precise buy and sell arrows during strong market trends, making your trading decisions clearer and more confident. Whether you're trading major currency pairs or exotic sym
FX Power MT4 NG
Daniel Stein
5 (13)
Receba a sua atualização diária do mercado com detalhes e screenshots através do nosso Morning Briefing aqui no mql5 e no Telegram ! O FX Power MT4 NG é a próxima geração do nosso medidor de força de moeda muito popular de longa data, o FX Power. E o que é que este medidor de força da próxima geração oferece? Tudo o que adorou no FX Power original MAIS Análise de força GOLD/XAU Resultados de cálculo ainda mais precisos Períodos de análise configuráveis individualmente Limite de cálculo personal
Atomic Analyst
Issam Kassas
5 (2)
Primeiramente, vale ressaltar que este Indicador de Negociação não repinta, não redesenha e não apresenta atrasos, tornando-o ideal tanto para negociação manual quanto automatizada. Manual do utilizador: configurações, entradas e estratégia. O Analista Atômico é um Indicador de Ação de Preço PA que utiliza a força e o momentum do preço para encontrar uma vantagem melhor no mercado. Equipado com filtros avançados que ajudam a remover ruídos e sinais falsos, e aumentam o potencial de negociação.
Este painel mostra os últimos padrões harmónicos disponíveis para os símbolos seleccionados, pelo que poupará tempo e será mais eficiente / versão MT5 . Indicador gratuito: Basic Harmonic Pattern Colunas do indicador Symbol : aparecem os símbolos seleccionados Trend : de alta ou de baixa Pattern : tipo de padrão (gartley, borboleta, morcego, caranguejo, tubarão, cifra ou ABCD) Entry : preço de entrada SL: preço de paragem de perda TP1: preço do 1º take profit TP2: preço do 2º take profit TP
Enigmera
Ivan Stefanov
5 (3)
ENIGMERA: O núcleo do mercado https://www.enigmera.com Introdução Este indicador e sistema de negociação é uma abordagem notável aos mercados financeiros. ENIGMERA utiliza os ciclos fractais para calcular com precisão os níveis de suporte e resistência. Mostra a autêntica fase de acumulação e dá direcções e objectivos.  Um sistema que funciona quer estejamos numa tendência ou numa correção.  Como é que funciona? O ENIGMERA é composto por três linhas: a linha de suporte/resistência, a linha
Currency Strength Exotics
Bernhard Schweigert
4.87 (31)
ACTUALMENTE 20% DE DESCONTO ! A melhor solução para qualquer novato ou comerciante especializado! Este Indicador é especializado para mostrar a força da moeda para quaisquer símbolos como Pares Exóticos de Commodities, Índices ou Futuros. É o primeiro do seu género, qualquer símbolo pode ser adicionado à 9ª linha para mostrar a verdadeira força da moeda de Ouro, Prata, Petróleo, DAX, US30, MXN, TRY, CNH etc. Esta é uma ferramenta de negociação única, de alta qualidade e acessível, porque in
Dynamic Forex28 Navigator
Bernhard Schweigert
5 (2)
Dynamic Forex28 Navigator - A ferramenta de negociação Forex de última geração. ATUALMENTE 49% DE DESCONTO. Dynamic Forex28 Navigator é a evolução dos nossos indicadores populares de longa data, combinando o poder de três em um: Indicador Advanced Currency Strength28 (695 avaliações) + Advanced Currency IMPULSE com ALERTA (520 avaliações) + Sinais CS28 Combo (Bônus). Detalhes sobre o indicador https://www.mql5.com/en/blogs/post/758844 O que o Next-Generation Strength Indicator oferece?  T
Este indicador é um indicador para análise automática de ondas que é perfeito para negociações práticas! Caso... Nota:   Não estou acostumado a usar nomes ocidentais para classificação de ondas. Devido à influência da convenção de nomenclatura de Tang Lun (Tang Zhong Shuo Zen), nomeei a onda básica como   uma caneta   e a banda de onda secundária como   um segmento   . ao mesmo tempo, o segmento tem a direção da tendência.   O segmento de tendência principal   é nomeado (esse método de nomenc
All in One Trade
Alexey Minkov
4.48 (27)
!!! 11.11 - SALE 25% - LIMITED TIME OFFER!!! The All-in-One Trade Indicator (AOTI) determines daily targets for EURUSD, EURJPY, GBPUSD, USDCHF, EURGBP, EURCAD, EURAUD, AUDJPY, GBPAUD, GBPCAD, GBPCHF, GBPJPY, AUDUSD, and USDJPY. All other modules work with any trading instruments. The indicator includes various features, such as Double Channel trend direction, Price channel, MA Bands, Fibo levels, Climax Bar detection, and others. The AOTI indicator is based on several trading strategies, and c
How to use Pair Trading Station Pair Trading Station is recommended for H1 time frame and you can use it for any currency pairs. To generate buy and sell signal, follow few steps below to apply Pair Trading Station to your MetaTrader terminal. When you load Pair Trading Station on your chart, Pair Trading station will assess available historical data in your MetaTrader platforms for each currency pair. On your chart, the amount of historical data available will be displayed for each currency pai
Este indicador é para uso em gráficos ao vivo, não para o testador. O indicador PRO Trend Divergence é uma ferramenta avançada de análise técnica projetada para detectar divergências de continuação de tendência , um sinal de que a tendência atual provavelmente continuará. Ao contrário dos indicadores convencionais que focam em reversões, este indicador ajuda a identificar quando a tendência permanece forte, mesmo durante retrações ou correções menores. As divergências de continuação de tendência
TakePropips Donchian Trend Pro
Eric John Pajarillaga Aldana
4.44 (16)
TakePropips Donchian Trend Pro   (MT4) é uma ferramenta poderosa e eficaz que detecta automaticamente a direção da tendência usando o Canal Donchian e fornece sinais de negociação de entrada e saída! Este indicador multifuncional inclui um scanner de tendências, sinais de negociação, painel estatístico, rastreador, sessões de negociação e painel de histórico de alertas. Ele foi projetado para fornecer sinais de negociação e economizar horas analisando os gráficos! Você pode baixar o manual do us
Golden Trend Indicator
Noha Mohamed Fathy Younes Badr
Golden Trend indicator  is The best indicator for predicting trend movement this indicator never lags and never repaints and never back paints    and give  arrow buy and sell    before the candle appear  and it will help you and  will make your trading decisions clearer its work on all currencies and  gold and crypto and all time frame This unique  indicator uses very secret algorithms to catch the  trends, so you can trade using this indicator and see the trend clear on charts  manual guide and
Stratos Pali
Michela Russo
5 (1)
Stratos Pali Indicator   is a revolutionary tool designed to enhance your trading strategy by accurately identifying market trends. This sophisticated indicator uses a unique algorithm to generate a complete histogram, which records when the trend is Long or Short. When a trend reversal occurs, an arrow appears, indicating the new direction of the trend. Important Information Revealed Leave a review and contact me via mql5 message to receive My Top 5 set files for Stratos Pali at no cost! D
Currency Strength Matrix
Raymond Gilmour
4.5 (26)
THE ONLY CURRENCY STRENGTH INDICATOR THAT IS BASED ON PRICE ACTION. DESIGNED FOR TREND, MOMENTUM & REVERSAL TRADERS This indicator  reads price action to confirm trend and strength . Advanced multi-currency and multi-time frame indicator that shows you simply by looking at one chart, every currency pair that is trending and the strongest and weakest currencies driving those trends. For full details on how to use this indicator, and also how to get a FREE chart tool, please see user manual HER
PZ Day Trading
PZ TRADING SLU
3.67 (3)
Este indicador detecta reversões de preços em zigue-zague, usando apenas análise de ação de preços e um canal donchiano. Ele foi projetado especificamente para negociações de curto prazo, sem repintar ou retroceder. É uma ferramenta fantástica para traders astutos, com o objetivo de aumentar o tempo de suas operações. [ Guia de instalação | Guia de atualização | Solução de problemas | FAQ | Todos os produtos ] Surpreendentemente fácil de negociar Fornece valor em cada período de tempo Imple
Oscilador de Tendência: Identificação Suave e Confiável de Tendências de Mercado Oscilador de Tendência é um indicador avançado para MT4, projetado para ajudar os traders a identificar com precisão a direção da tendência e possíveis pontos de reversão. Com uma representação visual intuitiva, este indicador mostra claramente quando o mercado está em tendência de alta ou de baixa, simplificando a análise e melhorando a leitura do gráfico. É adequado para uma ampla variedade de mercados e períodos
O FX Levels é um indicador de suporte e resistência excecionalmente preciso que funde o método tradicional do Lighthouse com uma abordagem dinâmica inovadora, funcionando sem falhas em todos os símbolos de negociação. Isto inclui pares de moedas, índices, acções ou mercadorias. O FX Levels identifica pontos de inversão e apresenta-os no gráfico, que podem ser utilizados de forma ideal como objectivos de lucro nas suas actividades de negociação. Ao desenvolver o FX Levels, usámos a nossa vasta e
Bermaui Deviation Percent
Muhammad Elbermawi
4.94 (111)
Ou (BD%), que é um índice de volatilidade que mede a volatilidade em porcentagem ao invés de pontos. A ideia do BD% é fazer um índice dependendo do Desvio Padrão Clássico (CSD) que se move entre 0 e 100 por cento. Você pode usar BD% para comparar a volatilidade do mesmo título em diferentes períodos de tempo ou intervalos de tempo diferentes. Além disso, você pode usar BD% para comparar a volatilidade entre diferentes títulos em diferentes mercados em termos de porcentagem, em vez de pontos
Mais do autor
Forex Flow Equalizer is an indicator that helps to reduce 'noise' in forex price movements. Visit https://www.mql5.com/en/blogs/post/751167 for more detailed explanation. It is programmed to enhance traders' focus, and capacity to monitor or manage multiple instruments of interest on preferred timeframe without their minds being over loaded with data or information, thereby, saving them the mental strength for more important trading decision making. Range Mode: is for traders who like to trade
Filtro:
Sem comentários
Responder ao comentário
Versão 2.0 2021.11.28
Changes that improve the workings and also makes the application more interactive have been made is areas such as:

1. Indicator Parameters:
(a) Two parameters - "Date Time Seek" and "Seek Strength to the nearest" have replaced the former "ECBindex" parameter bringing two new improvements. Now instead of using candle shift to find out past state of strength information, all the trader needs is to simply enter a datetime string. Secondly, the trader can now track past state of strength information down to the nearest time by configuring the "Seek Strength to the nearest" parameter.
(b) Another parameter "Hide Graph and Number data" enables trader to collapse the interface to display less information, please check this out.

2. The Interface:
(a) The filter "LS" which stood for LAST versus STAT (or end of LAST period state of strength data versus beginning of new period state of strength data) has become more current (or dynamic) in its operation. It is now "LR" standing for LAST versus REAL, comparing end of LAST period with current or real time data. The change improves forecast, it is no longer a static prediction as "LS" was used to being.
(b) The above change also means that filter "F" will now report alignment of "LR", "SR" and "RR" while the more restrictive (than "F") filter "LSSRX" becomes "LRSRX". Remember "X" is more restrictive than "RR".
(c) ECB now displays its computed data without the need to click on button "Z" as was the case with earlier version. Therefore, at a glance, the trader can view this information. But once the interface is collapsed, the trader can still display the information by clicking the then visible "Z".
(d) Graphical representation of the data is a new feature for those traders who are more graphic oriented. For each currency the bars are arranged from top down as LR, SR and RR, representing the numbers within brackets ordered from left to right.
(e) Lastly, for the purpose of confirmation when the trader is viewing past state of strength information, the date at the top right corner has now being enlarged to show the hour and minutes. It used to simply read the date in the earlier version in which the trader was only able to back track information accurate to the size of the "Strength Computation Timeframe" parameter configuration.