Divergence And Convergence MACD
- Indicadores
- Stephen Reynolds
- Versão: 1.2
- Atualizado: 21 julho 2017
- Ativações: 20
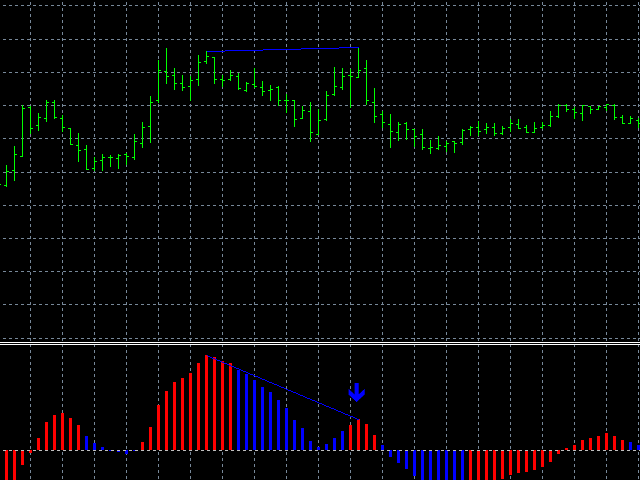
Divergence Convergence MACD is based on the classical divergence and convergence methods of charting.
Divergence is when we get higher highs and lower lows on our uptrend but which are not supported by our indicator which makes lower highs and therefore signals the underlying momentum is failing and so a reversal might occur. Vice versa for downtrend.
Convergence is when the higher highs and higher lows of an uptrend are also confirmed by our indicator making lower lows which helps us confirm that momentum is increasing and so the trend is likely to continue. Vice versa for a downtrend.
I have also added a colored histogram to help tell the trader when the market is bullish or bearish and therefore when to enter on a particular signal.
Features :
- Divergence and Convergence signals.
- Can change the color of the histogram, arrows and lines.
- Has choices of which alarms we want to use.
- Can be traded on any market and time frame.
Settings :
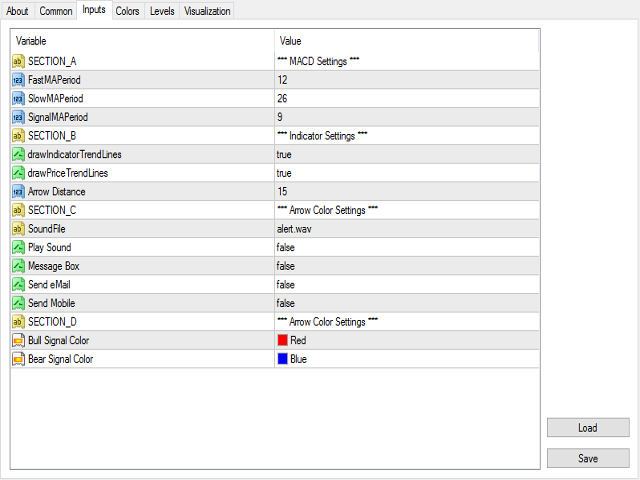
MACD Settings
- FastMAPeriod - Sets the period of the fast moving average.
- SlowMAPeriod - Sets the period of the slow moving average.
- SignalMAPeriod - Sets the period of the signal line moving average.
Indicator Settings
- DrawIndicatorTrendLines - True we draw trendlines on the indicator window, false we do not draw trend lines on indicator window.
- DrawPriceTrendLines - True we draw price trendlines on the main chart window, false we do not draw trend lines on main chart window.
- Arrow Distance - Input the distance we want arrow from MACD Histogram.
Alert Settings
- Soundfile - which wave file sound we use for our PC alarm.
- PlaySound - true means we here our PC alarm, false means we do not hear our PC alarm.
- MessageBox - true means we see a message box, false means we do not see a message box
- SendeMail - true means we get an alert sent to our email, false means we do not get an alert sent to our email.
- SendMobile - true means we get an alert sent to our mobile device, false means we do not get an alarm sent to out mobile device.
Graphical Object Settings
- Bull Signal Color - sets the color of our bull arrow.
- Bear Signal Color - sets the color of our bear arrow.


O usuário não deixou nenhum comentário para sua avaliação