Intraday Momentum Index for MT4
- Indicadores
- Luiz Tim
- Versão: 1.1
- Atualizado: 7 abril 2020
- Ativações: 5
O indicator Intraday Momentum Index (IMI) é um indicador técnico que combina aspectos da análise de candlesticks com o indicador Índice de Força Relativa (IFR ou RSI).
O conceito do indicador Intraday Momentum Index é parecido com o RSI (ou IFR), mas considera os preços de abertura e fechamento do intraday. O indicador IMI estabelece uma relação entre o preço de abertura e fechamento do ativo durante o dia, ao invés de relacionar como o preço de abertura e fechamento varia em função de diferentes dias. Por levar em consideração as variações de preço mais recentes, o indicador IMI identifica condições de sobrecompra e sobrevenda de forma mais precisa.
IMI combina características do Índice de Força Relativa (IFR ou RSI) através da relação entre os dias que fecharam positivos/negativos e, através da análise de candlesticks, fornece indicativo se o ativo está sobrecomprado ou sobrevendido.
Sendo assim, analistas técnicos podem utilizar o indicador IMI para antecipar quando um ativo está sobrecomprado ou sobrevendido. O cálculo do IMI é o seguinte:
IMI = (Σ dias positivos + Σ dias negativos) * 100
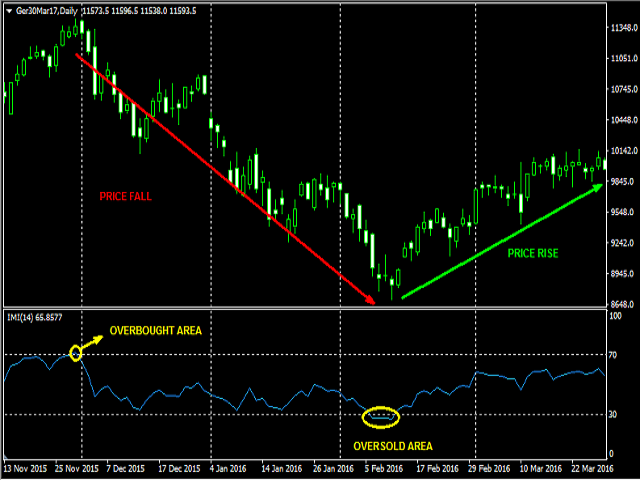
A interpretação dos valores e uso do indicador IMI é o seguinte: se o IMI estiver com valores no nível de 70 ou superior, isto indica que o ativo está sobrecomprado e portanto, pode ocorrer uma reversão de tendência ou um pullback de correção. Por outro lado, leituras no nível 30 ou inferior é interpretada como sobrevenda.
Parâmetros do Indicador
- IMI Period - número de barras utilizadas para o cálculo do indicador.