Dashboard Critical Support and Resistance MT5
- Indicadores
- Wang Yu
- Versão: 1.1
- Atualizado: 23 novembro 2021
- Ativações: 5
如果产品有任何问题或者您需要在此产品上添加功能,请联系我
Contact/message me if you encounter any issue using the product or need extra feature to add on the base version.
To access the free demo version, please re-direct to this LINK.
To access the single pair version, please re-direct to this LINK.
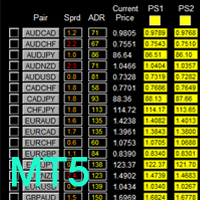
Price is likely to pullback or breakout at important support and/or resistance. This dashboard is designed to help you monitor these critical support and resistance area. Once price moves close to these important support and resistance within the warning area (warning area range is adjustable), alert or notification would be sent out, and indicator panel will be repainted to be red to make it noticeable. So you are free from watching and monitoring chart all day long.
Dashboard Super Critical Support and Resistance is an intuitive and handy graphic tool to help you to:
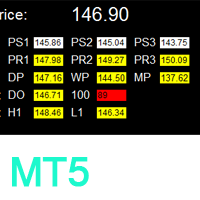
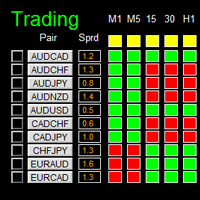
- Have the most commonly used critical support and resistance (pivot support1/2/3, pivot resistance1/2/3, daily/weekly/monthly pivot, daily open, 100 round points, and previous daily high/low) of 28 major pairs under control with one dashboard.
Features
- Ability to select usage of alert/notification function.
- Adjustable warning range for each type of critical support/resistance.
- Ability to select which critical support/resistance to use, by default, all of them are selected.
- Adjustable indicator panel position
Important Action Items before Using Dashboard
- For the first time loading Dashboard, it may take 3-5 minutes to download historical data. For subsequent loading, it only takes a few seconds.
- Make sure you have all 28 symbols in Symbol window (if your broker offers 28 pairs).
Input Parameters
- Send Alert upon Signal
- Send Notification upon Signal
- Use Pivot Support1
- True: pivot support cell panel will be repainted to be red, and alert/notification will be sent once price moves to area within pivot support warning zone
- False: no action will be triggered
- Same rule is applied to the following support/resistance
- Pivot Support1 Warning Zone
- True: pivot support cell panel will be repainted to be red, and alert/notification will be sent once price moves to area within pivot support warning zone
- Same rule is applied to the following warning zone
- Use Pivot Support2
- Pivot Support2 Warning Zone
- Use Pivot Support3
- Pivot Support3 Warning Zone
- Use Pivot Resistance1
- Pivot Resistance1 Warning Zone
- Use Pivot Resistance2
- Pivot Resistance2 Warning Zone
- Use Pivot Resistance3
- Pivot Resistance3 Warning Zone
- Use Daily Pivot
- Daily Pivot Warning Zone
- Use Weekly Pivot
- Weekly Pivot Warning Zone
- Use Monthly Pivot
- Monthly Pivot Warning Zone
- Use Daily Open
- Daily Open Warning Zone
- Use 100 Round Point
- 100 Round Point Warning Zone
- Use Previous Daily High
- Previous Daily High Warning Zone
- Use Previous Daily Low
- Previous Daily Low Warning Zone
- Suffix: suffix string of your symbol. i.e.: your symbol is ‘EURUSDx’ instead of ‘EURUSD’, input ‘x’ in suffix cell, leave prefix cell blank
- Prefix: prefix string of your symbol
Dashboard Objects
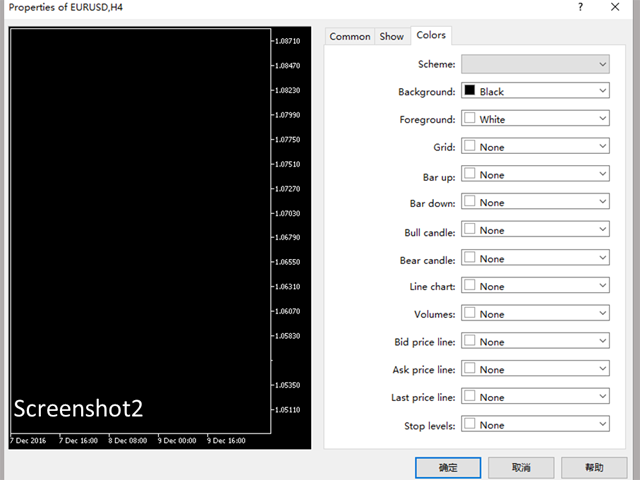
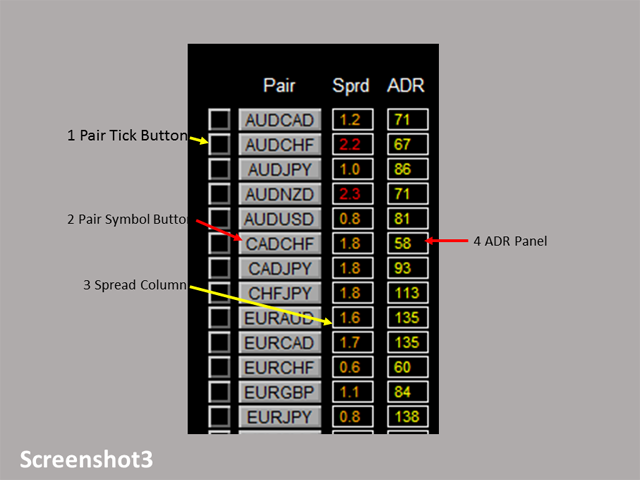
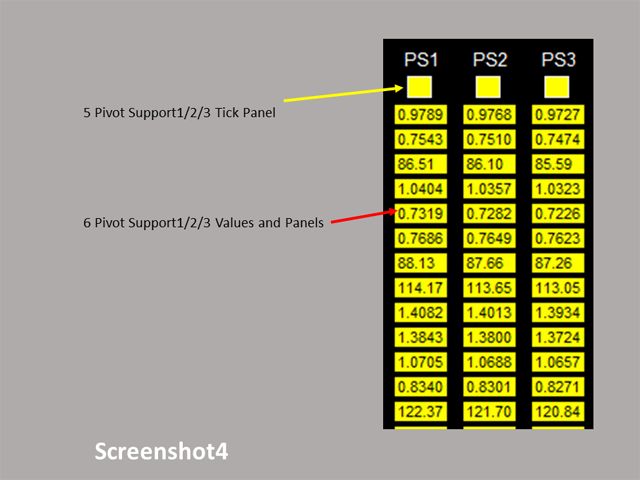
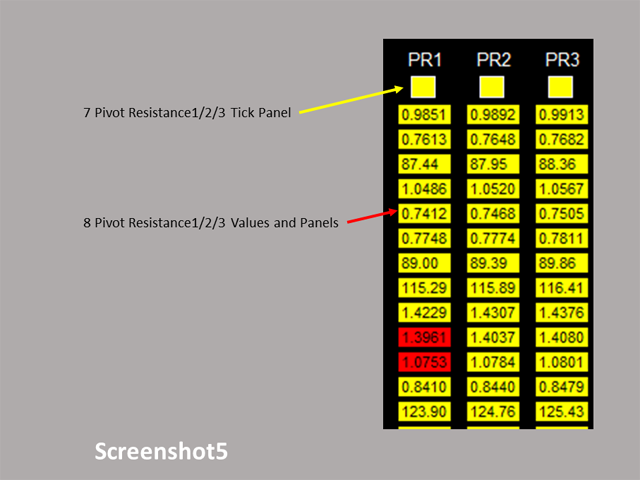
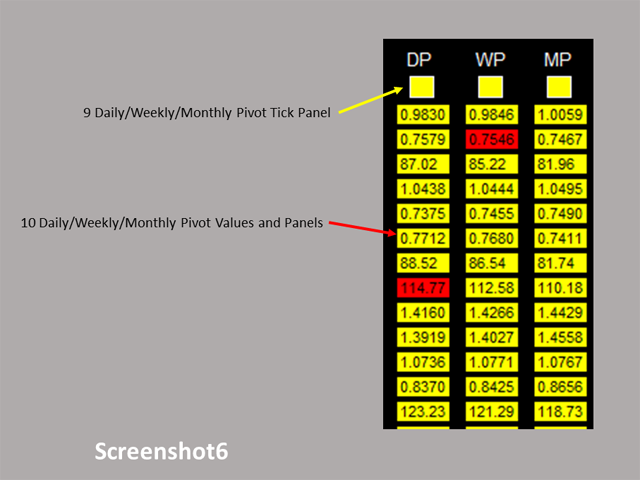
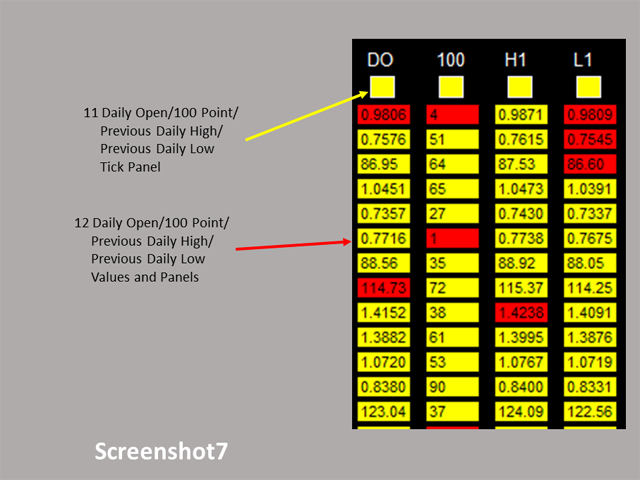
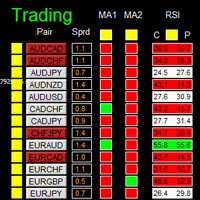
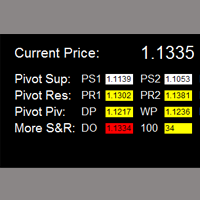
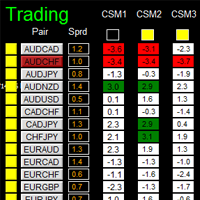
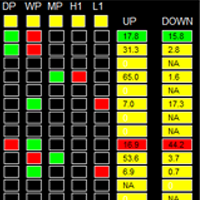
Please refer to screenshot 3 to 7.
- Pair Tick Button: Click once to active the corresponding pair for trading. Click once more to de-active.
- Pair Symbol Button:
- Click on button to open a corresponding new window chart
- Current Price Column: show current price of each pair.
- Pair/Currency Selection Button:
- All: select all 28 pairs
- None: clear all selected pairs
- EUR: select all EUR pairs, like EURUSD, EURJPY…
- Same rules applies to USD, GBP, JPY... buttons
- Pivot Support1/2/3 Tick Panel
- Pivot Support1/2/3 Values and Panels
- Pivot Resistance1/2/3 Tick Panel
- Pivot Resistance1/2/3 Values and Panels
- Daily/Weekly/Monthly Pivot Tick Panel
- Daily/Weekly/Monthly Pivot Values and Panels
- Daily Open/100 Point/Previous Daily High/Previous Daily Low Tick Panel
- Daily Open/100 Point/Previous Daily High/Previous Daily Low Values and Panels
