• Visão global
  • Comentários (23)
  • Discussão (160)
  • O que há de novo

Zup Universal ZigZag with Pesavento Patterns

4.56

The ZUP is based on two ideas.

  • Idea 1 - combine a variety of methods for identifying extremums (minimums and maximums) on the market price charts in a single indicator.
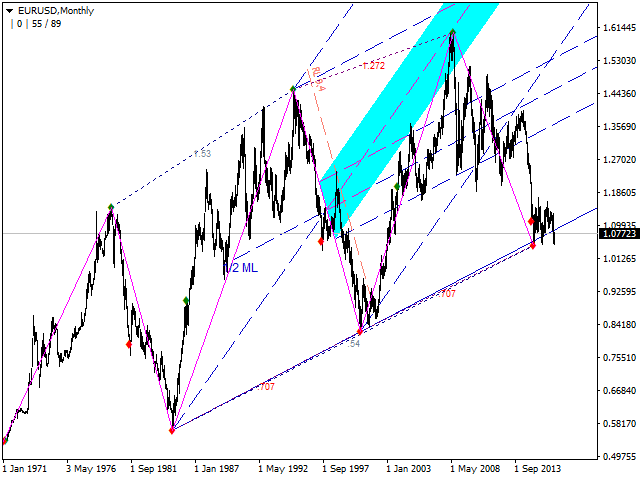
  • Idea 2 - make it possible to easily bind various graphical tools, which allow to analyze the market behavior, to the identified extremums.

To implement the first idea, the following has been made in the indicator.

Included multiple ZigZag algorithms.

Standard ZIGZAG algorithm. The basis of this algorithm is taken from the ZigZag that comes with the MetaTrader terminal.

  • ZIGZAG by Alex. Nickname on the forum is ANG...
  • ZIGZAG similar to one built into the Canadian Ensign program.
  • ZIGZAG developed by a programmer with the nickname tauber.
  • ZIGZAG corresponding to the Gann swings. The algorithm description is provided in the book by Hyerczyk.

Five DT-ZigZag modes. The DT-ZigZag name has been invented by a programmer with the nickname klot.

The main idea is to plot the zigzags on the current timeframe based on the data from the timeframes higher relative to the current one.

  • DT-ZigZag with the standard zigzag algorithm.
  • DT-ZigZag with the algorithm developed by klot.
  • DT-ZigZag with the algorithm developed by Candid.
  • DT-ZigZag based on fractal searching algorithm. In this particular case, the fractals have nothing to do with Benoit Mandelbrot. The name is taken from the corresponding indicator in the MetaTrader package.
  • DT-ZigZag with the Gann swings in the interpretation by Hyerczyk.
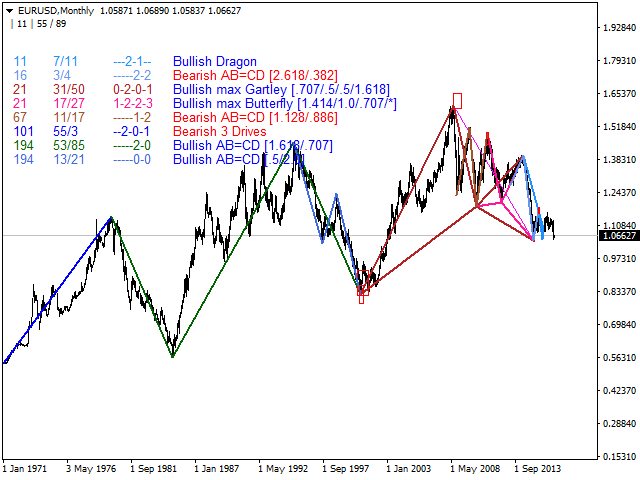
  • 7 different ZigZag algorithms in market scanning mode to search for patterns, codenamed Gartley Patterns.
  • ZIGZAG developed by a programmer with the nickname Talex.
  • SQZZ ZigZag, developed by a programmer with the nickname tovaroved (Alexander Shchukin).
  • ZZ_2L developed by a programmer with the nickname wellx.
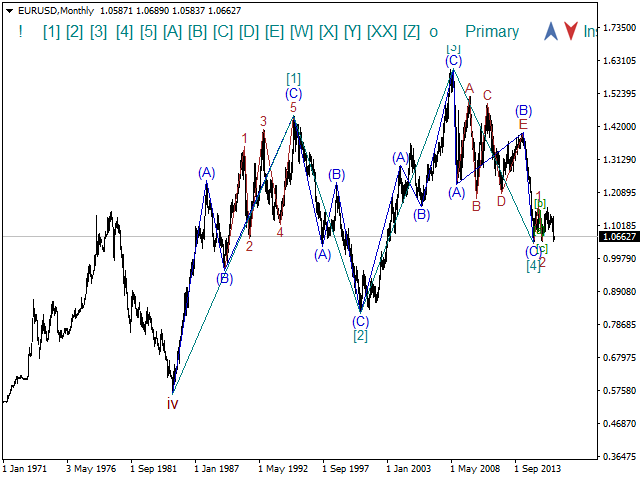
  • Wave ZigZag. This ZigZag allows to manually create a wave layout corresponding to the Elliott waves on 10 wave levels.

To implement the second idea, multiple graphical tools have been included in the indicator.

The indicator contains over 400 parameters in total.

All of the indicator parameters are divided into 16 groups to make navigation easier.

  1. Parameters for managing the built-in ZigZags
  2. Parameters for managing the Fibonacci levels
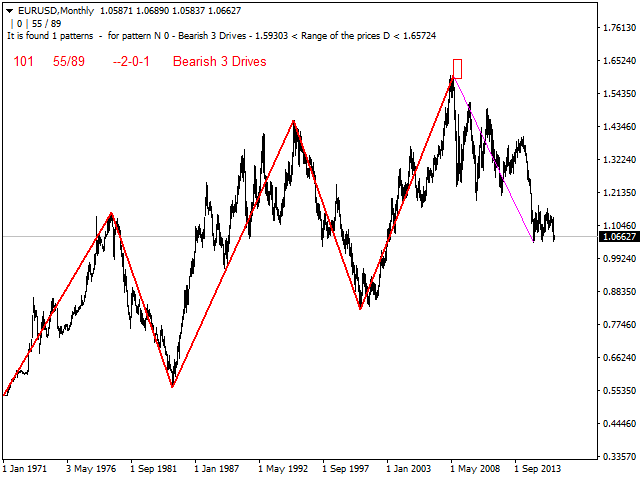
  3. Parameters for managing the Pesavento Patterns
  4. Parameters for managing the Gartley Patterns
  5. Parameters for managing the Andrews' Pitchfork
  6. Parameters for managing the micmed's channels
  7. Parameters for managing the Fibonacci fans
  8. Parameters for managing the Fibonacci extensions
  9. Parameters for managing the versum's levels
  10. Parameters for managing the Fibonacci arcs
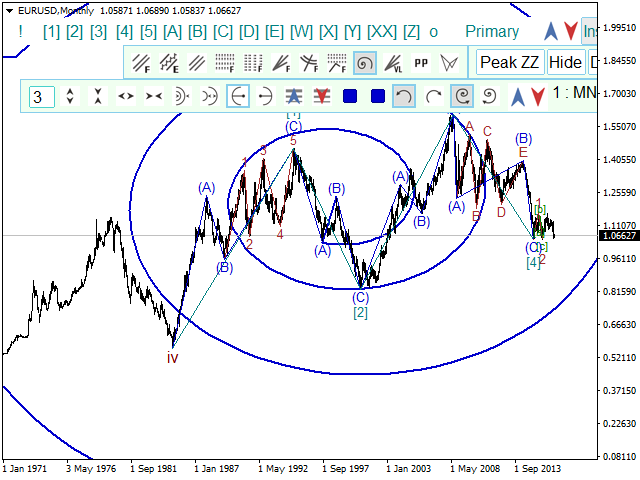
  11. Parameters for managing the logarithmic spiral
  12. Parameters for managing the Pivot ZigZag
  13. Parameters for managing the channels
  14. Parameters for managing the Fibonacci time zones
  15. Additional Parameters
  16. General Parameters

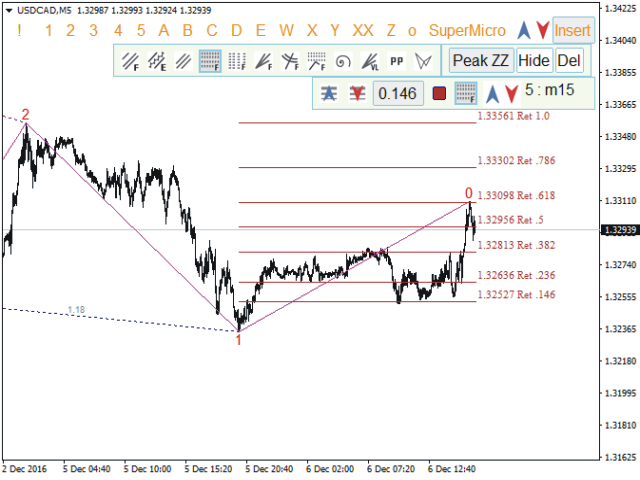
It is also possible to manage the graphical tools using the mouse and the graphical interface.

In order to use the graphical interface, it is necessary to enable the parameter ExtPanel=true.

If the panel is deleted using the ESC key, it can be restored to the chart using the SHIFT-Z key combination.

The graphical tools drawn using the mouse are binded either to the ZigZag extremums or to the wave layout.

The graphical tools drawn using the parameters are only binded to the ZigZag extremums.

They cannot be binded to the wave layout.

By default, the use of the graphical interface is enabled. For the operation to be correct, it is necessary to use MetaTrader 4 build 1014 or higher.

For the automatic search for the Gartley patterns using the parameters, it is necessary to enable ExtIndicator = 11: search Patterns

For the automatic plotting of the Andrews’ Pitchfork using the parameters, it is necessary to enable

  • ExtPitchforkDynamic = 2
  • ExtPitchforkStatic = 2

The detailed description of all parameters and methods for working with the graphical interface takes up multiple articles.

The full list of parameters is provided in the comments. The attached file contains the brief description of the ZUP.

I express my gratitude to all who participated in the creation of the ZUP.

Comentários 23
Michele Manenti
688
Michele Manenti 2022.04.25 13:21 
 

Great and powerful analysis tool to predict the movements of a cross currency, after some difficulty I managed to understand and use it, it is not easy to approach but I assure that it is worth losing time and study the operation, you get very reliable and accurate results. Congratulations to the developer, we hope to see updates in the future. Thanks

Richard Shoemake
24
Richard Shoemake 2021.04.11 03:49 
 

I would expect it to work right out of the box. It doesnt seem to work unless you set some things up. I'm still trying to get around to going through your links to make sure it's set up correctly. So, far I give it at most a 3. I may revise it lower if I can't get it to work. - I've updated my rating to 5 stars because I got good support from you guys, and it's working as expected now. Thanks again!

Fawkes7k
84
Fawkes7k 2020.05.28 12:31 
 

Один из редчайших индикаторов который действительно стоит своих денег, а цена сильно занижена. Видна колоссальная и многолетняя работа по разработке улучшению оптимизации и поддержке данного индикатора. Автору огромный респект, он явно мастер своего дела.

Produtos recomendados
TrendPlus
Sivakumar Subbaiya
4 (13)
Trend Plus   Trendplus  Indicator   Time Frame: Suitable for any time frame.  Purpose: Trend Prediction. Blue and red candle indicate the buy and sell call respectively. Buy: When the blue candle is formed buy call is initiated. close the buy trades when the next red candle will formed.   Sell: When the Red candle is formed Sell call is initiated. close the Sell trades when the next blue candle will formed.   Happy trade!!
FREE
Market Profile 3
Hussien Abdeltwab Hussien Ryad
3 (2)
Market Profile 3 MetaTrader 4 indicator  — is a classic Market Profile implementation that can show the price density over time, outlining the most important price levels, value area, and control value of a given trading session. This indicator can be attached to timeframes between M1 and D1 and will show the Market Profile for daily, weekly, monthly, or even intraday sessions. Lower timeframes offer higher precision. Higher timeframes are recommended for better visibility. It is also possible t
FREE
Candle GAP
Thushara Dissanayake
3 (1)
O indicador   Candle GAP   é uma ferramenta essencial para os traders que utilizam   Gap Trading Strategies   , pois identifica automaticamente os gaps das velas para cada dia da semana. Uma lacuna refere-se a uma diferença de nível de preço entre o fechamento e a abertura de dois dias consecutivos. Este indicador reconhece quatro tipos de padrões de gap: Comum, Breakaway, Continuação e Exaustão. Ao incorporar este indicador em qualquer gráfico, os traders podem validar seus sinais e aprimorar s
FREE
The indicator allows you to trade binary options. The recommended time frame is М1 and the expiration time is 1,2,3 minutes. The indicator suitable for auto and manual trading. A possible signal is specified as a arrows above/under a candle. You should wait until the candle closes! Arrows are not re-painted Trade sessions: TOKYO section (Half-end) Currency pairs: USD/JPY Working time frame: M1 Expiration time: 1,2,3 minutes. The indicator also shows good results when using the martingale strateg
FREE
Rainbow MT4
Jamal El Alama
Rainbow MT4 is a technical indicator based on Moving average with period 34 and very easy to use. When price crosses above MA and MA changes color to green, it’s a signal to buy. When price crosses below MA and MA changes color to red, it’s a signal to sell. The Expert advisor ( Rainbow EA MT4) based on Rainbow MT4 indicator, as you can see in the short video below is now available here .
FREE
Are you tired of drawing trendlines every time you're analyzing charts? Or perhaps you would like more consistency in your technical analysis. Then this is for you. This indicator will draw trend lines automatically when dropped on a chart. How it works Works similar to standard deviation channel found on mt4 and mt5. It has 2 parameters: 1. Starting Bar 2. Number of bars for calculation The   starting bar   is the bar which drawing of the trend lines will begin, while the   number of bars for c
FREE
Pin Bars
Yury Emeliyanov
5 (2)
Objectivo principal: "Pin Bars" destina-se a detectar automaticamente barras de pinos nos gráficos dos mercados financeiros. Uma barra de pinos é uma vela com um corpo característico e uma cauda longa, que pode sinalizar uma reversão ou correção de tendência. Como funciona: o indicador analisa cada vela no gráfico, determinando o tamanho do corpo, cauda e nariz da vela. Quando uma barra de pinos correspondente a parâmetros predefinidos é detectada, o indicador marca-a no gráfico com uma seta
FREE
This indicator alerts you when/before new 1 or 5 minute bar candle formed. In other words,this indicator alerts you every 1/5 minutes. This indicator is especially useful for traders who trade when new bars formed. *This indicator don't work propery in strategy tester.Use this in live trading to check functionality. There is more powerful Pro version .In Pro version,you can choose more timeframe and so on. Input Parameters Alert_Or_Sound =Sound ----- Choose alert or sound or both to not
FREE
Extremum Reverse Bar
Yurij Izyumov
2.8 (5)
This indicator has been created for finding the probable reversal points of the symbol price. A small candlestick reversal pattern is used it its operation in conjunction with a filter of extremums. The indicator is not redrawn! If the extremum filter is disabled, the indicator shows all points that have a pattern. If the extremum filter is enabled, the condition works – if the history Previous bars 1 candles back contains higher candles and they are farther than the Previous bars 2 candle, such
FREE
Pips forex é um sistema de negociação pronto. Este indicador mostra com setas no gráfico quando e em que direção você precisa abrir um pedido. Se a seta estiver verde, abrimos uma transação de compra e, se a seta estiver vermelha, abrimos uma transação de venda. Tudo é muito simples e bastante eficaz. TakeProfit definiu 15-25 pontos. StopLoss definido no nível de pontos. Quando os pontos se movem, cancelamos imediatamente o StopLoss. Prazo recomendado para negociar M1 e M5. Esta é uma estratégi
Predictor PRO MT4
Evgenii Aksenov
5 (2)
Indicador progressivo de nova geração da INFINITY. O Predictor PRO usa sua própria estratégia de cálculo de entrada e saída. Indicador sem redesenhar os sinais! Isso é muito importante para o comércio real. O indicador pode ser usado para qualquer par de moedas, metais, criptomoedas ou índices. O melhor horário do H1. O Predictor PRO mostra o ponto de entrada Buy / Sell e o ponto de saída Close. O cálculo do lucro em pontos ajuda a escolher as configurações ideais no período selecionado do
FREE
MegaTrends
Sivakumar Subbaiya
1 (1)
Megatrends  Indicator   Time Frame: Suitable for any time frame.  Purpose: Trend Prediction. Blue and red color indicate the buy and sell call respectively. Buy: When the blue line is originating it is opened buy call. Sell: When the Red line is origination it is opened sell call Happy trade!! this indicator is suitable for all time frame, but our recommended time frame to use 1hour and 4 hours, suitable for any chart.
FREE
Discover the power of precision and efficiency in your trading with the " Super Auto Fibonacci " MT4 indicator. This cutting-edge tool is meticulously designed to enhance your technical analysis, providing you with invaluable insights to make informed trading decisions. Key Features: Automated Fibonacci Analysis: Say goodbye to the hassle of manual Fibonacci retracement and extension drawing. "Super Auto Fibonacci" instantly identifies and plots Fibonacci levels on your MT4 chart, saving you tim
FREE
OrderBlock TS Roman
Vladislav Vlastovskii
3.8 (5)
Индикатор строит блоки заказов (БЗ) по торговой системе (ТС) Романа. Поиск блоков осуществляется одновременно на двух таймфремах: текущем и старшем (определяемым в настройках). Для оптимизации и игнорирования устаревших блоков в настройках задается ограничение количества дней в пределах которых осуществляется поиск блоков. Блоки строятся по правилам ТС состоящем из трех шагов: какую свечу вынесли (что?); какой свечой вынесли (чем?); правило отрисовки (как?).
FREE
This indicator scans for you up to 30 trading instruments and up to 8 timeframes for occurrences of the high probability reversal patterns: Double Tops/Bottoms with fake breakouts . Please read also the blog post " Professional Trading With Double Tops/Bottoms And Divergences! " which explains the concepts behind the ULTIMATE Double Top/Bottom indicator and how you can use a professional top-down approach. This FREE Version of the Scanner scans only EURUSD and GBPUSD. The full version of the sca
FREE
Toby Strategy Indicator
Ahmd Sbhy Mhmd Ahmd ʿYshh
The indicator rely on The Toby strategy >> The mother candle which is bigger in range than the previous six candles. A vertical line shows the last Toby Candle with the targets shown up and down. The strategy is about the closing price out of the range of the toby candle to reach the 3 targets..The most probable to be hit is target1 so ensure reserving your profits and managing your stop lose.
FREE
MASi Three Screens
Aleksey Terentev
5 (2)
MASi Three Screens is based on the trading strategy by Dr. Alexander Elder. This indicator is a collection of algorithms. Algorithms are based on the analysis of charts of several timeframes. You can apply any of the provided algorithms. List of versions of algorithms:     ThreeScreens v1.0 - A simple implementation, with analysis of the MACD line;     ThreeScreens v1.1 - A simple implementation, with analysis of the MACD histogram;     ThreeScreens v1.2 - Combines the first two algorithms
FREE
UPD1 X00 Levels
Vitaliy Kuznetsov
5 (8)
O indicador mostra os   níveis redondos   no gráfico. Eles também são chamados de níveis   psicológicos , bancários ou de jogador principal. Nestes níveis, há uma verdadeira luta entre touros e ursos, o acúmulo de muitas ordens, o que leva ao aumento da volatilidade. O indicador se ajusta   automaticamente   a qualquer instrumento e período de tempo. Quando o   nível 80   é rompido e testado,   nós compramos . Quando o   nível 20   é rompido e testado,   nós vendemos . A meta é 00. Atenção. Dev
FREE
Follow The Line
Oliver Gideon Amofa Appiah
4.07 (14)
FOLLOW THE LINE GET THE FULL VERSION HERE: https://www.mql5.com/en/market/product/36024 This indicator obeys the popular maxim that: "THE TREND IS YOUR FRIEND" It paints a GREEN line for BUY and also paints a RED line for SELL.  It gives alarms and alerts of all kinds. IT DOES NOT REPAINT and can be used for all currency pairs and timeframes. Yes, as easy and simple as that. Even a newbie can use it to make great and reliable trades. NB: For best results, get my other premium indicators for more
FREE
Wise Men Indicator demo
Bohdan Kasyanenko
3 (2)
The indicator displays signals according to the strategy of Bill Williams on the chart. Demo version of the indicator has the same features as the paid, except that it can work only on a demo account . Signal "First Wise Man" is formed when there is a divergent bar with angulation.  Bullish divergent bar - with lower minimum and closing price in the upper half. Bearish divergent bar - higher maximum and the closing price at the bottom half. Angulation is formed when all three lines of Alligat
FREE
Free automatic Fibonacci is an indicator that automatically plots a Fibonacci retracement based on the number of bars you select on the BarsToScan setting in the indicator. The Fibonacci is automatically updated in real time as new highest and lowest values appears amongst the selected bars. You can select which level values to be displayed in the indicator settings. You can also select the color of the levels thus enabling the trader to be able to attach the indicator several times with differe
FREE
Head and Shoulders Pattern Indicator - Your Key to Recognizing Trend Reversals Unlock the power of pattern recognition with the "Head and Shoulders Pattern Indicator." This cutting-edge tool, designed for MetaTrader, is your trusted ally in identifying one of the most powerful chart patterns in technical analysis. Whether you're a novice or an experienced trader, this indicator simplifies the process of spotting the Head and Shoulders pattern, allowing you to make informed trading decisions. Key
FREE
"Turbo Helper para scalping" é um sistema de negociação totalmente preparado. Mostra ao trader com uma seta no gráfico quando abrir uma ordem e em qual direção. Também indica ao trader com um símbolo quadrado quando fechar a negociação. Após isso, o indicador exibe no gráfico o número estimado de pontos para a negociação. Esse valor pode variar ligeiramente, pois o indicador não leva em consideração o tamanho real do spread e swap da sua corretora. No entanto, para calcular de forma mais precisa
Fx BFP Pivot Points
Maged Ait Abbi
5 (5)
A forex   pivot point   strategy could very well be a trader’s best friend as far as identifying levels to develop a bias, place stops and identify potential profit targets for a trade. Pivot points have been a go-to for traders for decades. The basis of pivot points is such that price will often move relative to a previous limit, and unless an outside force causes the price to do so, price should stop near a prior extreme. Pivot point trading strategies vary which makes it a versatile tool for
FREE
Scalping indicator. It takes into account volatility, price movement in the local interval and the direction of the current trend. Recommended timeframe - M5. Advantages: Low volatility when a signal appears ensures minimal movement against an open position. The indicator does not redraw its signals. There are alert signals. It is a great tool for day trading. Settings: Name Description Period Indicator period Range of each bar in the period (pp.) The maximum size of each candle in the indicat
FREE
O Pivot Point Fibo RSJ é um indicador que traça as linhas de suporte e resistência do dia usando as proporções   de Fibonacci. Este indicador espetacular cria até 7 níveis de suporte e resistência por meio do Pivot Point usando proporções de Fibonacci. É fantástico como os preços respeitam cada nível deste suporte e resistência, onde é possível perceber possíveis pontos de entrada / saída de uma operação. Recursos Até 7 níveis de suporte e 7 níveis de resistência Defina as cores dos níveis in
FREE
Cumulative Delta MT4
Evgeny Shevtsov
4.93 (28)
The indicator analyzes the volume scale and splits it into two components - seller volumes and buyer volumes, and also calculates the delta and cumulative delta. The indicator does not flicker or redraw, its calculation and plotting are performed fairly quickly, while using the data from the smaller (relative to the current) periods. The indicator operation modes can be switched using the Mode input variable: Buy - display only the buyer volumes. Sell - display only the seller volumes. BuySell -
FREE
This is a Sharkfin Arrows Indicator. Detailed explanation and TDI extras: https://www.mql5.com/en/blogs/post/759138 This indicator will show only Arrows. It does not have TDI symbols on chart. Please get the extras from links above for TDI indicators. Sharkfin Scanner (paid): https://www.mql5.com/en/market/product/123566 TDI Scanner Dash (paid): https://www.mql5.com/en/market/product/41826 About: This Indicator finds the Shark Fin Pattern. It will show an arrow in the current bar if R
FREE
Check my paid tools they work great and I share Ea's based on them for free please r ate The Dual Timeframe RSI (Relative Strength Index) indicator is a novel trading tool that allows traders to monitor RSI readings from two different timeframes on a single chart. This dual perspective enables traders to identify potential trend confirmations and divergences more effectively. For instance, a trader might use a 1-hour RSI alongside a daily RSI to ensure that short-term trades align with the bro
FREE
QualifiedEngulfing
Ashkan Hazegh Nikrou
QualifiedEngulfing - é a versão gratuita do indicador ProEngulfing ProEngulfing - é a versão paga do indicador Advance Engulf, faça o download aqui. Qual a diferença entre a versão gratuita e paga do ProEngulfing ? A versão gratuita tem a limitação de um sinal por dia. Apresentamos o QualifiedEngulfing - Seu indicador profissional de padrões Engulf para o MT4 Desbloqueie o poder da precisão com o QualifiedEngulfing, um indicador de última geração projetado para identificar e destacar padrões En
FREE
Os compradores deste produto também adquirem
Actualmente 20% OFF ! A melhor solução para qualquer novato ou comerciante especializado! Este software de painel de instrumentos está a funcionar em 28 pares de moedas. É baseado em 2 dos nossos principais indicadores (Advanced Currency Strength 28 e Advanced Currency Impulse). Dá uma grande visão geral de todo o mercado Forex. Mostra valores avançados de força da moeda, velocidade de movimento da moeda e sinais para 28 pares de divisas em todos os (9) períodos de tempo. Imagine como a sua
FX Volume
Daniel Stein
4.58 (33)
Ganhe uma verdadeira vantagem no Forex com o Volume FX: O melhor indicador de volume O FX Volume é o primeiro e único indicador de volume a revelar o sentimento genuíno do mercado a partir de uma perspetiva interna. Ao fornecer informações exclusivas sobre como os participantes do mercado institucional e os corretores estão posicionados, o FX Volume permite que você negocie com a previsão geralmente reservada para os principais participantes. Diga adeus aos atrasos dos relatórios COT - o FX Vo
TPSproTREND PrO
Roman Podpora
4.79 (19)
TPSpro TREND PRO   é um indicador de tendência que analisa automaticamente o mercado e fornece informações sobre a tendência e cada uma de suas mudanças, além de dar sinais para entrar em negociações sem redesenhar! O indicador utiliza cada vela, analisando-as separadamente. referindo-se a diferentes impulsos - impulso para cima ou para baixo. Pontos de entrada exatos em transações de moedas, criptomoedas, metais, ações, índices! Versão MT5                   DESCRIÇÃO COMPLETA DO INDICADOR    
MetaBands M4
Vahidreza Heidar Gholami
5 (3)
MetaBands utiliza algoritmos poderosos e únicos para desenhar canais e detectar tendências, a fim de fornecer aos traders pontos potenciais para entrar e sair de negociações. É um indicador de canal mais um indicador de tendência poderoso. Inclui diferentes tipos de canais que podem ser mesclados para criar novos canais simplesmente usando os parâmetros de entrada. O MetaBands usa todos os tipos de alertas para notificar os usuários sobre eventos de mercado. Recursos Suporta a maioria dos algori
Gann Swing Structure
Kirill Borovskii
5 (1)
This indicator is based on the mathematics of the great trader W.D. Ganna. With its help, you can easily find strong levels by analyzing swings to find the optimal entry point. The indicator works on all instruments and all timeframes. The indicator is fully manual and has control buttons. All you need to do is press the NEW button, a segment will appear, which you can place on any movement, swing or even 1 candle that you want to analyze. By placing the segment, press the OK button. A grid (th
Dynamic Forex28 Navigator
Bernhard Schweigert
5 (4)
Dynamic Forex28 Navigator - A ferramenta de negociação Forex de última geração. ATUALMENTE 49% DE DESCONTO. Dynamic Forex28 Navigator é a evolução dos nossos indicadores populares de longa data, combinando o poder de três em um: Indicador Advanced Currency Strength28 (695 avaliações) + Advanced Currency IMPULSE com ALERTA (520 avaliações) + Sinais CS28 Combo (Bônus). Detalhes sobre o indicador https://www.mql5.com/en/blogs/post/758844 O que o Next-Generation Strength Indicator oferece?  T
RelicusRoad Pro
Relicus LLC
4.64 (102)
Manual do usuário do RelicusRoad + vídeos de treinamento + acesso ao grupo de discórdia privado + status VIP UMA NOVA FORMA DE OLHAR PARA O MERCADO O RelicusRoad é o indicador de negociação mais poderoso do mundo para forex, futuros, criptomoedas, ações e índices, oferecendo aos traders todas as informações e ferramentas necessárias para se manterem rentáveis. Fornecemos análises técnicas e planos de negociação para ajudar cada trader a ter sucesso, do iniciante ao avançado. É um indicador
Advanced Supply Demand
Bernhard Schweigert
4.91 (295)
Atualmente com 33% de desconto! A melhor solução para qualquer Trader Novato ou especialista! Este indicador é uma ferramenta de negociação exclusiva, de alta qualidade e acessível porque incorporamos uma série de recursos proprietários e uma nova fórmula. Com esta atualização, você poderá mostrar fusos horários duplos. Você não só será capaz de mostrar um TF mais alto, mas também mostrar ambos, o TF do gráfico, MAIS o TF mais alto: MOSTRANDO ZONAS ANINHADAS. Todos os traders de Oferta e Demanda
Automated Trendlines
Georgios Kalomoiropoulos
5 (16)
As linhas de tendência são a ferramenta mais essencial de análise técnica na negociação forex. Infelizmente, a maioria dos traders não os desenha corretamente. O indicador Automated Trendlines é uma ferramenta profissional para traders sérios que o ajudam a visualizar o movimento de tendências dos mercados. Existem dois tipos de Trendlines Bullish Trendlines e Bearish Trendlines. Na tendência de alta, a linha de tendência Forex é desenhada através dos pontos de oscilação mais baixos do m
TPSpro RFI Levels
Roman Podpora
4.82 (22)
INSTRUÇÕES         Russo   -        ENG       R   ecomendado para uso com um indicador       -       TPSpro   TREND PRO -   Versão MT4         Um elemento-chave na negociação são as zonas ou níveis a partir dos quais as decisões de comprar ou vender um instrumento de negociação são tomadas. Apesar das tentativas dos principais participantes de esconder sua presença no mercado, eles inevitavelmente deixam rastros. Nossa tarefa era aprender como identificar esses rastros e interpretá-los corretame
FX Dynamic - O único indicador ATR de que você sempre precisará Pronto para turbinar suas estratégias de negociação com precisão e perceção incomparáveis? Conheça o FX Dynamic , o primeiro e único indicador ATR projetado para análise baseada em moeda e o ajuste automático para mudanças de GMT dos corretores . Diga adeus às ferramentas ultrapassadas e abrace a solução definitiva para dominar a volatilidade do mercado. Por que o FX Dynamic é um divisor de águas Análise ATR baseada em moeda -
FX Power MT4 NG
Daniel Stein
5 (14)
Desbloquear todo o poder do FX Power NG: o derradeiro medidor de força da moeda Durante mais de oito anos, o FX Power capacitou os operadores de todo o mundo com uma análise fiável e precisa da força da moeda. Agora, o FX Power NG leva esta ferramenta de confiança para o próximo nível, oferecendo funcionalidades avançadas que proporcionam uma precisão, personalização e conhecimentos inigualáveis à sua negociação. O que faz do FX Power NG uma ferramenta indispensável para os operadores sérios
EARLY REMINDER: The Starting price is 65 price will rise soon up to 365$ after first 10 copies of sales. Grab this offer now! Introduction Hello, traders! Welcome to the demonstration of the Forex Beast Indicator , a comprehensive tool designed to assist aspiring traders in navigating the complexities of the forex market. This indicator incorporates seven essential components to provide a well-rounded trading experience: Moving Averages Colored Zones Support and Resistance Levels (Previous Hig
Enigmera
Ivan Stefanov
5 (3)
ENIGMERA: O núcleo do mercado https://www.enigmera.com Introdução Este indicador e sistema de negociação é uma abordagem notável aos mercados financeiros. ENIGMERA utiliza os ciclos fractais para calcular com precisão os níveis de suporte e resistência. Mostra a autêntica fase de acumulação e dá direcções e objectivos.  Um sistema que funciona quer estejamos numa tendência ou numa correção.  Como é que funciona? O ENIGMERA é composto por três linhas: a linha de suporte/resistência, a linha
Supply and Demand Dashboard PRO
Bernhard Schweigert
4.8 (20)
Actualmente 20% OFF ! Este painel é uma peça de software muito poderosa que trabalha em múltiplos símbolos e até 9 prazos. Baseia-se no nosso principal indicador (Melhores críticas: Advanced Supply Demand ).   O tablier dá uma óptima visão geral. Mostra:   Valores filtrados da Oferta e da Procura, incluindo a classificação da força da zona, Distâncias de/para as zonas e dentro das zonas, Destaca as zonas aninhadas, Dá 4 tipos de alertas para os símbolos escolhidos em todos os (9) períodos d
Atomic Analyst
Issam Kassas
5 (2)
Primeiramente, vale ressaltar que este Indicador de Negociação não repinta, não redesenha e não apresenta atrasos, tornando-o ideal tanto para negociação manual quanto automatizada. Manual do utilizador: configurações, entradas e estratégia. O Analista Atômico é um Indicador de Ação de Preço PA que utiliza a força e o momentum do preço para encontrar uma vantagem melhor no mercado. Equipado com filtros avançados que ajudam a remover ruídos e sinais falsos, e aumentam o potencial de negociação.
Este painel mostra os últimos padrões harmónicos disponíveis para os símbolos seleccionados, pelo que poupará tempo e será mais eficiente / versão MT5 . Indicador gratuito: Basic Harmonic Pattern Colunas do indicador Symbol : aparecem os símbolos seleccionados Trend : de alta ou de baixa Pattern : tipo de padrão (gartley, borboleta, morcego, caranguejo, tubarão, cifra ou ABCD) Entry : preço de entrada SL: preço de paragem de perda TP1: preço do 1º take profit TP2: preço do 2º take profit TP
Descubra os níveis de FX: O seu melhor indicador de suporte e resistência para o sucesso da negociação O FX Levels é mais do que apenas um indicador de suporte e resistência; é um divisor de águas para traders sérios que desejam precisão, confiabilidade e funcionalidade contínua em todos os símbolos de negociação - sejam pares de moedas, índices, ações ou commodities. Construído com base no comprovado método Lighthouse e aprimorado com adaptabilidade dinâmica e em tempo real, o FX Levels traz
Entry Points Pro
Yury Orlov
4.6 (167)
Este é um indicador para MT4 que fornece sinais precisos para entrar em uma negociação sem redesenhar. Ele pode ser aplicado a qualquer ativo financeiro: forex, criptomoedas, metais, ações, índices. Ele fornecerá estimativas bastante precisas e informará quando é melhor abrir e fechar um negócio. Assista o vídeo (6:22) com um exemplo de processamento de apenas um sinal que compensou o indicador! A maioria dos traders melhora seus resultados de negociação durante a primeira semana de negociação c
LEIA AS INFORMAÇÕES ABAIXO ANTES DE COMPRAR O PRODUTO! Apollo Pips PLUS SP é um produto único! É PARA QUEM QUER ADQUIRIR MEU NOVO INDICADOR "APOLLO PIPS" MAIS BÔNUS "SUPER PACK" COM ACESSO A TODOS OS MEUS INDICADORES DE NEGOCIAÇÃO! Ao adquirir o produto Apollo Pips PLUS SP você está na verdade adquirindo uma versão absolutamente nova do meu indicador Apollo Pips. Esta versão do indicador possui um algoritmo aprimorado e um parâmetro fácil de usar que lhe dá a oportunidade de usar o indicador em
All in One Trade
Alexey Minkov
4.48 (27)
The All-in-One Trade Indicator (AOTI) determines daily targets for EURUSD, EURJPY, GBPUSD, USDCHF, EURGBP, EURCAD, EURAUD, AUDJPY, GBPAUD, GBPCAD, GBPCHF, GBPJPY, AUDUSD, and USDJPY. All other modules work with any trading instruments. The indicator includes various features, such as Double Channel trend direction, Price channel, MA Bands, Fibo levels, Climax Bar detection, and others. The AOTI indicator is based on several trading strategies, and created to simplify market analysis. All-in-One
Cycle Sniper
Elmira Memish
4.39 (36)
NEW YEAR SALE PRICE FOR LIMITED TIME!!! Please contact us after your purchase and we will send you the complimentary indicators to complete the system Cycle Sniper is not a holy grail but when you use it in a system which is explained in the videos, you will feel the difference. If you are not willing to focus on the charts designed with Cycle Sniper and other free tools we provide, we recommend not buying this indicator. We recommend watching the videos about the indiactor and system before pu
Blahtech Supply Demand
Blahtech Limited
4.61 (33)
Was: $299  Now: $99   Supply Demand uses previous price action to identify potential imbalances between buyers and sellers. The key is to identify the better odds zones, not just the untouched ones. Blahtech Supply Demand indicator delivers functionality previously unavailable on any trading platform. This 4-in-1 indicator not only highlights the higher probability zones using a multi-criteria strength engine, but also combines it with multi-timeframe trend analysis, previously confirmed swings
Best Currency Strength Indicator
Tumelo Patrick Rakotsoane
4.59 (46)
Advanced Currency Strength Indicator The Advanced Divergence Currency Strength Indicator. Not only it breaks down all 28 forex currency pairs and calculates the strength of individual currencies across all timeframes , but, You'll be analyzing the WHOLE forex market in 1 window (In just 1 minute) . This indicator is very powerful because it reveals the true movements of the market.  It is highly recommended to  analyze charts knowing the performance of individual currencies or the countries ec
Scalper Inside PRO
Alexey Minkov
4.75 (59)
An exclusive indicator that utilizes an innovative algorithm to swiftly and accurately determine the market trend. The indicator automatically calculates opening, closing, and profit levels, providing detailed trading statistics. With these features, you can choose the most appropriate trading instrument for the current market conditions. Additionally, you can easily integrate your own arrow indicators into Scalper Inside Pro to quickly evaluate their statistics and profitability. Scalper Inside
Scalping Signal NO Repaint NO Lag
Martin Alejandro Bamonte
5 (1)
"Scalping Signal No Repaint No Lag" é o único indicador no mercado que, ao ser arrastado para qualquer gráfico, carrega automaticamente todos os indicadores necessários sem a necessidade de carregar qualquer template ou outros indicadores. Ele configura automaticamente o gráfico para que fique exatamente como na imagem fornecida. Este indicador garante sinais sem repintura ou atraso, tornando-o ideal para estratégias de scalping em todos os pares de moedas e intervalos de tempo (TF). Funcionali
Este indicador foi projetado para se integrar com a teoria das Ondas de Elliott, oferecendo dois métodos distintos de operação: Trabalho Automático: Nesse modo, o indicador opera autonomamente detectando todas as cinco ondas motrizes no gráfico de acordo com a teoria das Ondas de Elliott. Ele oferece previsões e identifica zonas potenciais de reversão. Além disso, possui a capacidade de gerar alertas e mensagens de push para notificar os traders sobre desenvolvimentos significativos. Essa funcio
PipFinite Trend PRO
Karlo Wilson Vendiola
4.88 (2245)
Breakthrough Solution For Trend Trading And Filtering With All Important Features Built Inside One Tool! Trend PRO's smart algorithm detects the trend, filters out market noise and gives entry signals with exit levels. The new features with enhanced rules for statistical calculation improved the overall performance of this indicator. Important Information Revealed Maximize the potential of Trend Pro, please visit www.mql5.com/en/blogs/post/713938 The Powerful Expert Advisor Version Automa
Currency Strength Exotics
Bernhard Schweigert
4.87 (31)
ACTUALMENTE 20% DE DESCONTO ! A melhor solução para qualquer novato ou comerciante especializado! Este Indicador é especializado para mostrar a força da moeda para quaisquer símbolos como Pares Exóticos de Commodities, Índices ou Futuros. É o primeiro do seu género, qualquer símbolo pode ser adicionado à 9ª linha para mostrar a verdadeira força da moeda de Ouro, Prata, Petróleo, DAX, US30, MXN, TRY, CNH etc. Esta é uma ferramenta de negociação única, de alta qualidade e acessível, porque in
Ultimate Sniper Dashboard
Hispraise Chinedum Abraham
4.82 (22)
Desconto de $299! Os preços podem aumentar no futuro! Leia a descrição abaixo! Melhor Sistema de Entrada para Ultimate Sniper Dashboard: NÍVEIS DINÂMICOS FINAIS. (Por favor, verifique os meus produtos) O Ultimate Sniper Dashboard só funciona em mercados ao vivo devido aos limites de teste MT4 em várias moedas. Apresentamos o painel de instrumentos de Ultimate-Sniper! O nosso melhor, que contém tanto HA-Sniper, MA-Sniper. e muitos modos especiais. O Ultimate Sniper Dashboard é uma besta
Mais do autor
SPAs
Eugeni Neumoin
Программу можно использовать как советник для ручной и полуавтоматической торговли. Или как индикатор для выявления структуры рынка. В торговой части программы отсутствуют ордера Sell, Buy. А также лимитные и стоповые ордера. Вместо этого на график выводится торговая рамка для сделок на продажу -  SELL  или на покупку - BUY . У торговой рамки имеются три уровня. Уровень открытия будущего ордера. Уровень стопа и уровень профита. Влево от торговой рамки выводятся три линии. Перемещая данные линии
Filtro:
allexflame4848
19
allexflame4848 2022.11.07 13:29 
 

Отличная работа ..Пожалуй самая лучшая работа , которую я встречал по тех.анализу .Работает отлично ..Спасибо автору

Leoarab
33
Leoarab 2022.09.19 21:58 
 

need alot of help to understand it. i guess template also would be helpful to have it clear.a help would be appreciated.

Michele Manenti
688
Michele Manenti 2022.04.25 13:21 
 

Great and powerful analysis tool to predict the movements of a cross currency, after some difficulty I managed to understand and use it, it is not easy to approach but I assure that it is worth losing time and study the operation, you get very reliable and accurate results. Congratulations to the developer, we hope to see updates in the future. Thanks

Richard Shoemake
24
Richard Shoemake 2021.04.11 03:49 
 

I would expect it to work right out of the box. It doesnt seem to work unless you set some things up. I'm still trying to get around to going through your links to make sure it's set up correctly. So, far I give it at most a 3. I may revise it lower if I can't get it to work. - I've updated my rating to 5 stars because I got good support from you guys, and it's working as expected now. Thanks again!

Eugeni Neumoin
6518
Resposta do desenvolvedor Eugeni Neumoin 2021.04.20 08:54
Write what you need to configure. Everyone using ZUP has different requests. If you set it up for all requests, then the graph will contain a lot of unnecessary information. For example, I use Andrews' pitchfork, fibo levels, Pesavento patterns, channels. Sometimes I create wave counting. I don't use Gartley pattern search. Write what interests you.
=============
In a simplified form, to enable the search for Gartley patterns on the graphical interface panel, press the Insert - ZZ- 11 buttons. For better understanding -
you can read articles https://www.mql5.com/en/articles/2966 https://www.mql5.com/en/articles/2990
But after the release of the second article, there were some changes in the interface. Instead of the Select button, the Default button and the "Choice and creation of 5 dot patterns" button appeared And you can read about it in Russian https://www.mql5.com/ru/articles/6363 Also, more than 10 years ago, two articles were published for working with ZUP without a graphical interface.
https://www.mql5.com/en/articles/1468
https://www.mql5.com/en/articles/1470
faithdefender
1736
faithdefender 2021.01.09 20:56 
 

O usuário não deixou nenhum comentário para sua avaliação

Andrey Belchenko
63
Andrey Belchenko 2020.06.04 15:34 
 

Отличный индикатор, Евгений. Было бы здорово еще на него поставить Алерт (Push-сообщение, чтобы получать на смартфон) при торговле "ExtIndicator = 11: search Patterns", с установками по тайм-фреймам)

Eugeni Neumoin
6518
Resposta do desenvolvedor Eugeni Neumoin 2021.04.28 20:21
Это давно сделано.
Fawkes7k
84
Fawkes7k 2020.05.28 12:31 
 

Один из редчайших индикаторов который действительно стоит своих денег, а цена сильно занижена. Видна колоссальная и многолетняя работа по разработке улучшению оптимизации и поддержке данного индикатора. Автору огромный респект, он явно мастер своего дела.

Profit_Trader
88
Profit_Trader 2020.03.13 20:04 
 

The system in complicated but it works! Thank you!

Heiner G.
530
Heiner G. 2020.02.14 19:56 
 

O usuário não deixou nenhum comentário para sua avaliação

Jebs siptungkha
947
Jebs siptungkha 2019.08.22 12:44 
 

O usuário não deixou nenhum comentário para sua avaliação

Christoph Michael Hoelzel
128
Christoph Michael Hoelzel 2019.05.02 17:29 
 

O usuário não deixou nenhum comentário para sua avaliação

Peter
1093
Peter 2019.04.18 07:49 
 

Still learning about this excellent tool and great support.

[Excluído] 2019.04.16 11:54 
 

O usuário não deixou nenhum comentário para sua avaliação

Barour Bilal
2433
Barour Bilal 2019.04.08 14:16 
 

O usuário não deixou nenhum comentário para sua avaliação

Aravind Kolanupaka
9040
Aravind Kolanupaka 2019.04.08 12:36 
 

O usuário não deixou nenhum comentário para sua avaliação

xusim
34
xusim 2019.01.01 11:55 
 

Excellent !!!

Shaheen Hassanali
6678
Shaheen Hassanali 2018.12.02 15:35 
 

O usuário não deixou nenhum comentário para sua avaliação

[Excluído] 2018.11.25 21:13 
 

O usuário não deixou nenhum comentário para sua avaliação

[Excluído] 2018.11.18 20:55 
 

O usuário não deixou nenhum comentário para sua avaliação

TipMyPip
2643
TipMyPip 2018.09.15 17:04 
 

O usuário não deixou nenhum comentário para sua avaliação

12
Responder ao comentário
Versão 154.224 2024.09.24
Подкорректировал вывод экранных форм
Versão 154.223 2024.09.19
Для зигзагов в режиме DT добавлено значение параметра ExtLabel=3
Versão 154.222 2024.09.12
Внесены изменения для совместимости с другими программами.
Versão 154.21 2024.05.12
Исправлено масштабирование графических объектов для разных мониторов.
Versão 154.20 2024.02.19
Исправлен вывод small menu при редактировании параметров вил Эндрюса
Versão 154.19 2024.02.16
Исправлен вывод small menu при задании параметров вил Эндрюса.
Versão 154.18 2023.07.22
В некоторых случаях при создании графического объекта через графический интерфейс объект не создается.
Во вкладке Эксперты в данном случае будет выводиться сообщение: "Unable to create object. Choose another anchor point." - Невозможно создать объект. Выберите другую точку привязки.
Versão 154.17 2023.07.21
Исправлена ошибка, связанная с пропуском котировок.
Versão 154.16 2023.07.21
Исправил вывод цвета линий UWL и LWL в вилах Эндрюса.
Versão 154.15 2023.06.29
Исправлен вывод графических объектов при ExtIndicator = 15
Versão 154.14 2023.06.29
Исправлен вывод графических объектов при ExtIndicator = 15
Versão 154.13 2023.02.03
Исправил в мониторе паттернов цвет надписей с названиями паттернов. Цвет надписей стал соответствовать цвету паттернов на графике.
Versão 154.12 2022.11.23
Исправлена "работа" параметров ExtFractal и ExtFractalEnd.
Сделал по умолчанию вывод следующих графических объектов:
паттерны Песавенто, поиск паттернов Gartley, динамических и статических уровней Фибоначчи, динамических и статических комплектов вил Эндрюса.
Для отключения перечисленных графических инструментов необходимо устновить параметры со следующими значениями:
ExtHidden=0
ExtIndicator=0
ExtFiboDynamic=false
ExtFiboStatic=false
ExtPitchforkDynamic=0
ExtPitchforkStatic=0
Versão 154.11 2022.11.23
Исправлена "работа" параметров ExtFractal и ExtFractalEnd.
Сделал по умолчанию вывод следующих графических объектов:
паттерны Песавенто, поиск паттернов Gartley, динамических и статических уровней Фибоначчи, динамических и статических комплектов вил Эндрюса.
Для отключения перечисленных графических инструментов необходимо устновить параметры со следующими значениями:
ExtHidden=0
ExtIndicator=0
ExtFiboDynamic=false
ExtFiboStatic=false
ExtPitchforkDynamic=0
ExtPitchforkStatic=0
Versão 154.10 2022.11.23
Исправлена "работа" параметров ExtFractal и ExtFractalEnd.
Сделал по умолчанию вывод следующих графических объектов:
паттерны Песавенто, поиск паттернов Gartley, динамических и статических уровней Фибоначчи, динамических и статических комплектов вил Эндрюса.
Для отключения перечисленных графических инструментов необходимо устновить параметры со следующими значениями:
ExtHidden=0
ExtIndicator=0
ExtFiboDynamic=false
ExtFiboStatic=false
ExtPitchforkDynamic=0
ExtPitchforkStatic=0
Versão 154.9 2022.11.11
Удален код преобразования базы данных из первых верси ZUP с графическим интерфейсом в более поздние версии. Как устаревший.
Испрравлено выделение символов волновой разметки на графике для перемещения символа или удаления символа. При нажатии клавиши CTRL и левой кнопки мыши на символе волны.
Исправлена работа с комбинацией клавиш SHIFT-S.
Versão 154.7 2022.05.29
В данной версии корректируются параметры линий реакции динамических и статических вил Эндрюса, которые были неверно преобразованы после версии 154.3
Versão 154.6 2022.05.28
Исправлена ошибка преобразования значения линий реакции динамических вил Эндрюса при переходе с версии 154.3 на последующие версии.
Versão 154.5 2022.05.07
Исправлена ошибка расчета красной зоны в вилах Эндрюса.
Versão 154.4 2022.02.06
Исправлены ошибки.
Versão 154.3 2021.07.07
Сделаны небольшие изменения, улучшающие работу программы.
Versão 154.2 2021.06.11
Проведена небольшая оптимизация. Исправлены ошибки.
Versão 154.1 2021.06.10
Исправлены ошибки.
Versão 154.0 2021.06.08
Изменен формат хранения графических объектов в файлах в папке //MQL4/Files/ZUP/Objects/
Это сделано для привязки цвета объектов к цвету волнового уровня, если объект был создан с привязкой к вершинам какого-либо волнового уровня. Но если в дальнейшем цвет объекта будет изменен вручную, то произойдет отвязка цвета объекта от волнового уровня.

Также изменена структура хранения параметров в файлах.

В пункты меню Default графических инструментов добавлена возможность корректировки параметров зигзага ExtIndicator=0.

Добавлен параметр FiboFan для включения вывода произвольных фибо вееров. Ранее включение данного графического инструмента осуществлялось изменением цвета.
Аналогичные параметры добавлены для Versum level - VLStatic и VLDynamic.

Появилась возможность вывода на один график до 10 экземпляров ZUP. При этом все 10 индикаторов можно настраивать с помощью графического интерфейса.
Каким образом это делается.
Важно - все экземпляры ZUP должны иметь уникальные номера параметра ExtSet. Этот параметр для удобства настройки переведен в начало списка параметров индикатора. При выводе второго и последующих экземпляров индикатора необходимо задать уникальное значение данного параметра.
Первому экземпляру будет присвоен номер панели графического интерфейса 0.
Второму и последующим экземплярам от 1 до 9. Но не рекомендуется устанавливать большое количество эземпляров. Это повышает нагрузку на процессор компьютера. Лучше обходиться одним экземпляром.

Каким образом производится переключение графических панелей между экземлярами.
Это производится с помощью комбинации клавиш SHIFT - 0, SHIFT - 1 и так далее вторая клавиша соответствует номеру графической панели.

Как узнать, какой экземпляр индикатора подключен к графической панели.
В левом верхнем углу окна с графиком на графической панели выведена кнопка в виде восклицательного знака.
При наведении курсору мыши на данную кнопку во всплывающей подсказке номер окна с графиком, номер графической панели и значение параметра ExtSet.
Номер окна с графиком заносится в названия файлов, которые ZUP создает в данном окне с графиком.

Также эти три параметра выводятся в меню Common в конце списка. То есть внизу четвертой колонки параметров данного меню.

Исправлены замеченные ошибки. Например, ошибка возникавшие при создании волновой разметки. И другие.
Versão 153.60 2021.02.13
Добавлена возможность включения/выключения <small menu> с помощью сочетания клавиш SHIFT-S.
Внесены изменения при выборе канала ExtTypeChannals=3
Versão 153.59 2020.08.08
Немного доработан алгоритм вывода канала при ExtTypeChannels=3
Versão 153.58 2020.07.16
Для стандартного зигзага (ExtIndicator=0) в меню Default равноудаленных каналов добавлена возможность редактирования параметров зигзага также как в меню Default вил Эндрюса. Это позволяет быстро выявить структуру движений рынка.
Versão 153.57 2020.07.15
Исправлена работа каналов в динамическом режиме.
Versão 153.56 2020.07.09
Исправлена ошибка.
Versão 153.55 2020.07.07
Исправлена ошибка.
Versão 153.53 2020.07.04
Добавлены еще два вида каналов.
При ExtTypeChannels=3 формируется такой же канал как и при ExtTypeChannels=2, но на трех лучах зигзага.
При ExtTypeChannels=4 можно выводить на первых 10 лучах зигзага такой же канал, как при создании канала путем привязки к экстремумам зигзага или к волновой разметке с помощью графического интерфейса. Но без жесткой привязки.

Исправлены ошибки.
Versão 153.52 2020.07.04
Добавлены еще два вида каналов.
При ExtTypeChannels=3 формируется такое же канал, но на трех лучах зигзага.
При ExtTypeChannels=4 можно выводить на первых 10 лучах зигзага такой же канал, как при создании канала путем привязки к экстремумам зигзага или к волновой разметке с помощью графического интерфейса. Но без жесткой привязки.
Versão 153.51 2020.06.25
Исправил равноудаленные каналы.
Versão 153.49 2020.05.26
Исправлен алгоритм расширенного режима.
Versão 153.48 2020.05.14
Исправлен вывод каналов. Два вида каналов были включены в ZUP примерно в 2007 году. Трендовый канал ранее выводился на график иногда с ошибками.
Доработан алгоритм расширенного режима для графических инструментов, привязываемых к двум точкам.
Versão 153.47 2020.04.27
Исправил задание расчета зигзага через графический интерфейс при значении ExtMaxBar=0.
При данном значении зигзаг рассчитывается на всей доступной истории.
Versão 153.46 2020.04.12
Исправил вывод статических вил при значении ExtPitchforkStatic=3
Versão 153.45 2020.04.04
Исправил вывод ценовых меток в вилах Эндрюса, созданных с помощью графического интерфейса.
Versão 153.44 2020.04.04
Исправил вывод ценовых меток в вилах Эндрюса, созданных с помощью графического интерфейса.
Versão 153.43 2020.02.11
В маленькое меню Default корректировки параметров вил Эндрюса в режиме поиска паттернов (ExtIndicator=11 и AlgorithmSearchPatterns=0) добавлены параметры настройки зигзагов: ParametresZZforDMLEWA, minBars и ExtBackstep.
Versão 153.42 2020.02.11
В маленькое меню Default корректировки параметров вил Эндрюса в режиме поиска паттернов (ExtIndicator=11) добавлены параметры настройки зигзагов: ParametresZZforDMLEWA, minBars и ExtBackstep.
Versão 153.41 2019.08.26
Исправил вывод паттернов
Versão 153.40 2019.08.22
Изменил вывод паттернов Gartley
Versão 153.39 2019.08.22
Добавлена в меню Common всплывающая подсказка с номером фибо уровня в поле редактирования параметра ExtFiboTypeFree
Versão 153.38 2019.08.21
Восстановил рамку потенциальной разворотной зоны паттернов Gartley
Versão 153.37 2019.08.21
Исправлена прорисовка паттернов Gartley
Versão 153.36 2019.08.20
Исправлено вывод фибо уровней.
Добавлено значение параметра ParametresZZforDMLEWA=9
Versão 153.35 2019.08.19
Исправлена в меню Common корректировка параметра ExtFiboTypeFree
Versão 153.34 2019.08.14
Исправлен вывод динамических патттернов Песавенто.
Versão 153.33 2019.08.01
Внесены небольшие исправления
Versão 153.32 2019.07.22
Внесены небольшие исправления.
Versão 153.30 2019.07.06
Если значение параметра Save Parameters в меню Common равно 0 или 1, изменение любых параметров вызывает изменение соответствующих параметров ZUP на всех связанных графиках.
Versão 153.29 2019.07.06
Исправил логику работы с параметром Save Parameters в меню Common.
Versão 153.28 2019.06.18
Исправлен вывод на график паттернов Песавенто.
Versão 153.27 2019.06.13
Оптимизировал вывод на график паттернов Песавенто.
Versão 153.26 2019.06.13
Исправлен вывод паттернов Песавенто.
Versão 153.25 2019.06.12
Внесены исправления по замечаниям пользователей.
Versão 153.24 2019.06.10
Исправил работу редактора паттернов.
Versão 153.23 2019.06.10
В меню Common графического интерфейса добавлены кнопки для редактирования параметров изменения стиля вывода зигзагов: ExtStyleZZ, ExtColorZigzag, ExtWidthZigzag, ExtStyleZigzag.
Откорректирован инамический вывод паттернов Песавенто.
Versão 153.22 2019.06.07
Сделаны небольшие исправления.
Versão 153.21 2019.06.01
Откорректировал редактирование параметра GrossPeriod в маленьком меню Default для вил Эндрюса.
Versão 153.20 2019.05.31
Откорректирована работа динамических графических инструментов.
Исправлена работа ZUP при отключенном графическом интерфейсе.
Versão 153.19 2019.05.23
Исправлены ошибки
Versão 153.18 2019.05.15
Исправлена логика работы параметра maxBarToD
Versão 153.17 2019.05.14
Исправил вывод на график графического инструмента Versum level
Versão 153.16 2019.05.08
Исправил логику работы программы с параметром ExtIndicator
Versão 153.15 2019.05.05
Исправлена ошибка.
Versão 153.14 2019.05.05
Исправлены граничные значения параметров.
Versão 153.13 2019.05.04
Исправлены ошибки.
Versão 153.12 2019.04.27
Добавил всплывающие подсказки для зависимых кнопок редактирования параметров.
Например, с помощью кнопки minBars для ExtIndicator=0 можно редактировать параметр minBars только когда параметр ParametresZZforDMLEWA=0.
При наведении на число в кнопке minBars во всплывающей подсказке выводится значение параметра ParametresZZforDMLEWA, при котором можно редактировать параметр minBars.

Некоторые зависимые параметры могут выводиться в меню Default только после того, как параметр от которого они зависят примет допустимое значение.
Versão 153.11 2019.04.23
Сделаны небольшие исправления.
Versão 153.10 2019.04.18
Исправил работу с поверхностью создания паттернов.
Versão 153.9 2019.04.16
Сделаны небольшие изменения при работе с поверхностью создания паттернов.
Versão 153.8 2019.04.15
Добавлен вывод монитора паттернов совместно с панелями графического интерфейса.
Включается в меню Default для паттернов Gartley кнопкой MonitorPatterns. По умолчанию включен.

Добавлены всплывающие подсказки к некоторым кнопкам меню.
У кнопки ZZ во всплывающей подсказке выводится текущее значение ExtIndicator.
У кнопки ! в левом верхнем углу во всплывающей подсказке выводится номер окна с графиком. Например номер 123456789.
Программа сложная. Не искючаю, что может возникнуть аварийное завершение при каких-то значениях параметров, установленных с помощью графического интерфейса. Можно попробовать переключить таймфрейм для восстановления работы. Если это не поможет, то необходимо удалить один или два файла.

Для этого открыть каталог с данными. Зайти в папку MQL\Files\ZUP. В этой папке удалить файл spR_123456789.bin. Если он там будет находиться. Этого файла может и не быть.
В папке MQL\Files\ZUP\SaveParametrs удалить файл pE123456789.bin с параметрами для ZUP, установленного в этом окне. Номер окна может быть любым. Здесь взят условный номер для примера. Этот номер буде при значении кнопки Save Parameters = 2 в меню Common.

Создано маленькое меню Default для оперативной настройки вил Эндрюса. Включается кнопкой small menu.
В этом меню находятся самые необходимые кнопки с параметрами для быстрой настройки вил Эндрюса и кнопки настройки зигзагов для быстрого нахождения экстремумов, к которым вилы привязываются.


Исправлены замеченные ошибки.
Versão 153.7 2019.04.09
Восстановил работу выбора параметра в окне создания паттернов с помощью графического интерфейса.
В 153 версии данное окно подключается кнопкой "Choice and creation of 5 dot patterns".
Ранее эта кнопка называлась "Select".
Versão 153.6 2019.04.09
Изменил вывод паттернов Песавненто.
Versão 153.5 2019.04.09
Внесено небольшое изменение при вызове меню Default.

------------------------------------------------------------------------
Существенное изменение в 153 версии ZUP.

При подключенном графическом интерфейсе (ExtPanel=true) на работу ZUP влияют параметры, задаваемые через графический интерфейс. Графический интерфейс подключен по умолчанию. Поэтому, например, на поиск паттернов при подключенном графическом интерфейсе не влияют параметры, заданные через окно изменения параметров. Для поиска паттернов необходимо нажать кнопку ZZ и потом выбрать кнопку 11. При нажатии на кнопку 11 подключается режим ExtIndicator=11 - режим поиска паттернов. И в меню, выводимом у кнопки 11 настраиваются параметры поиска паттернов. Кнопки с номерами соответствуют режимам ExtIndicator. И меню подключаемые этими кнопками будут настраивать соответствующие зигзаги.
А с помощью меню Default настраиваются параметры графических инструментов.
В меню Common настраиваются все остальные параметры.
Есть параметры, которые настраиваются только через окно настройки параметров.
Перечислю их.
Для поиска паттернов:
CustomPattern
NameCustomPattern
minXB
maxXB
minAC
maxAC
minBD
maxBD
minXD
maxXD

Для вил Эндрюса:
ExtCustomStaticAP
AutoMagnet
AMBars
ExtPitchforkCandle
ExtDateTimePitchfork_1
ExtDateTimePitchfork_2
ExtDateTimePitchfork_3
ExtPitchfork_1_HighLow

Другие параметры:
chHL_PeakDet_or_vts
NumberOfBars
NumberOfVTS
NumberOfVTS1

ExtObjectColor
ExtObjectStyle
ExtObjectWidth


ZigZagHighLow

ExtSave
info_comment
infoTF

ExtVisible
ExtReset
ExtPanel
ExtSet


Если отключить (ExtPanel=false) графический интерфейс, то настраивать параметры можно, как и раньше, через окно настройки параметров.
Versão 153.4 2019.04.08
Добавлено удаление объектов меню с графика
Versão 153.3 2019.04.07
Сделал контроль ввода допустимых значений в параметр ExtPitchforkStaticNum.
Исправил замеченные ошибки.
Versão 153.2 2019.04.05
Добавил кнопку SelectPattern в меню редактирования параметров паттернов Gartley.
Исправил удаление символов волновой разметки на графике.
Versão 153.1 2019.04.03
Большинство параметров стало возможно настраивать через графический интерфейс.
Для настройки параметра ExtIndicator добавлена кнопка ZZ. Параметры каждого зигзага стало возможно настраивать индивидуально. Настройка осуществляется мгновенно.
Для настройки параметров графических инструментов добавлена кнопка Default. Для настройки спиралей эта кнопка называется D.
Все остальные параметры настраиваются через кнопку Common.
Небольшое количество параметров не настраивается через графический интерфейс.
Это параметры, которые потеряли актуальность после создания графического интерфейса, параметры, которые не соответствуют идеологии ZUP (VTS), параметры, которые при настройке через графический интерфейс могут создать тупиковую ситуацию (ExtSet, ExtPanel...).


Добавлены в графический интерфейс несколько новых параметров для удобства.
Например, в группе Common, параметр Save Parameters позволяет сохранять настройки, то есть все параметры.
Save Parameters = 0 - при такой настройке параметры может использовать любой экземпляр ZUP терминала.
Save Parameters = 1 - при такой настройке параметры используются для настройки отпереленного финансового инструмента, например, валютной пары EURUSD.
Save Parameters = 2 - настройка по умолчанию. Параметры сохраняются только для текущего окна с графиком финансового инструмента.

Важно!
При нажатии на выше приведенные кнопочки выпадает меню со списками параметров. Меню имеют определенный размер по вертикали. Чтобы все строки меню умещались на экране, необходимо чтобы монитор по вертикали имел настройку не менее 800 точек.

Настройка параметров производится с помощью кнопок.
С помощью стрелок около кнопок можно перебирать значения параметра из допустимого диапазона или из списка и редактировать - изменять значение параметра. Но, например, при настройке списков фибо уровней или списков наборов цветов стрелками выбирается значение из списка. Но редактировать выбранное значение можно при нажатии на кнопку со значением фибо уровня или после нажатия на кнопку с цветом.
Все кнопки, на которых выводится какое-либо числовое значение можно редактировать как с помощью стрелок, так и при нажатии на кнопку.
Кнопки параметров со списком "битов" - выводится список 1 и 0 - редактируются при нажатии на 1 или на 0. После этого изменяется соответствующее значение на 0 или на 1. При подведении курсора мыши к значению бита во всплывающей подсказке выводится, на что влияет значение этого бита.

Для удобства некоторые меню разбиваются на несколько страниц. Количество страниц зависит от разрешения монитора по горизонтали. С помощью кнопки Page выбирается страница. Также можно выбрать отдельную колонку меню с помощью кнопки Column. Это сделано для того, чтобы окно с меню не перекрывало график.

Versão 152.21 2019.01.22
Исправил работу с цветом при выводе вил Эндрюса.
Versão 152.20 2018.12.03
Добавлена возможность изменения порядка расположения кнопок на меню выбора графических инструментов.
Для изменения порядка расположения кнопок необходимо нажать на кнопку Insert. Нажимаем на кнопку одного из 12 графических инструментов. Нажимаем на клавиши SHIFT и стрелка вправо на чистовой клавиатуре для перемещения кнопки вправо. Или нажимаем SHIFT и стрелка влево для перемещения кнопки влево. Одно нажатие на стрелку вызывает одно перемещение позиции кнопки.

Versão 152.19 2018.11.25
Добавлено.
Если на меню выбора графических инструментов задана работа с фибо проекциями, то при нажатии на графике на линию фибо уровня в графическом инструменте фибо проекции, созданного с помощью графического интерфейса ZUP, на дополнительном меню для фибо проекций будет выведено значение фибо уровня для этой линии.
Versão 152.18 2018.11.25
Добавлено.
Если на меню выбора графических инструментов задана работа с фибо каналами, то при нажатии на графике на линию фибо уровня в графическом инструменте фибо каналы, созданного с помощью графического интерфейса ZUP, на дополнительном меню для фибо каналов будет выведено значение фибо уровня для этой линии.
Versão 152.17 2018.11.06
Отрегулировал работу кнопок Hide и Del на графическом интерфейсе.
Если надпись на кнопке черного цвета, то кнопка работает.
Если серого цвета, то кнопка не работает.
Versão 152.16 2018.11.04
Отрегулировал работу кнопок "Target Line" для канала Фибоначчи и равноудаленного канала и кнопки "Target" для вил Эндрюса в графическом интерфейсе. Надписи на данных кнопках стали выводиться черным или серым цветом. Серым цветом надпись выводится в том случае, когда не имеет смысла или не предусматривается работа кнопок.
Versão 152.15 2018.10.30
Добавлено.
Если на меню выбора графических инструментов задана работа с фибо уровнями, то при нажатии на графике на линию фибо уровня, созданного с помощью графического интерфейса ZUP, на дополнительном меню для фибо уровней будет выведено значение фибо уровня для этой линии.
Versão 152.14 2018.10.24
Добавлены всплывающие подсказки к линиям Шиффа в комплекте вил Эндрюса.
Versão 152.13 2018.09.14
Добавлены возможность корректировки волновой разметки с помощью графического интерфейса.
После нанесения на график символов волновой разметки необходимо подвести курсор мыши к символу волновой разметки. Далее нажать комбинацию клавиша CTRL и левая кнопка мыши. Появится меню.
Стрелками можно изменить волновой уровень волны, к которой относится выбранный символ. Или волновой уровень волны и всех волн, входящих в структуру выбранной волны.
Также можно удалить. Для удаления внизу меню расположено 5 кнопок.
S - удаление выбранного символа.
W - удаление волны, в состав которой входит выбранный символ.
St - удаление волны, в состав которой входит выбранный символ, и всех волн входящих в структуру этой волны. Удаление структуры.
L - удаление всех символов волнового уровня, к которому относится выбранный символ.
M - удаление всей разметки.
Перед удалением появляется предупреждающее окно. В данном окне необходимо подтвердить согласие или не согласие с предложенными действиями.
При наведении на любой пункт меню курсора мыши появляются всплывающие подсказки.

Добавлено множество небольших исправлений в графическом интерфейсе.
Versão 152.12 2018.07.30
Добавлены всплывающие подсказки для линий VectorOfAMirrorTrend и для рамки PointD при выводе паттернов.
Versão 152.11 2018.07.26
Исправлена логика работы параметра ExtSet
Versão 152.10 2018.07.24
Added tooltips for Equilibrium, Reaction1 and Reaction2 lines when displaying five-dot Gartley patterns.
Fixed errors occurring in case of big ExtMaxBar values.
Versão 152.9 2018.05.14
Fixed the display of price labels in the Andrews' Pitchfork.
Versão 152.8 2018.03.08
Added a tooltip when hovering the mouse cursor over PivotZZ line
Versão 152.7 2018.01.23
Fixed bugs.
Versão 152.6 2017.12.14
Fixed display of target labels in Andrews' Forks created using the graphics interface.
Versão 152.5 2017.10.23
Fixed the button that shows/hides the Fibonacci projection graphics tool in Fibonacci projections editing menu.
Versão 152.4 2017.10.11
Fixed an error in processing of extremums.
Versão 152.3 2017.09.12
Fixed the error with the output of wave character highlight when applying the wave layout to the chart.
Versão 152.2 2017.07.13
Added the ability to create new five-point patterns by editing parameters of one of the 33 patterns built into the indicator. When editing is complete, it is suggested to save the new pattern to an external CSV file.

Fixed the logic of connection to pattern search using the graphical interface.

Fixed known bugs.
Versão 152.1 2017.06.27
Added graphical interface controls for patter search.
Using the GUI, it is now possible to:
1. enable or disable search for different patterns;
2. create new patterns;
3. edit pattern parameters;
4. save newly created patterns to a file;
5. enable search for patterns from the selected file;
6. create lists of patterns for search.
Versão 151.9 2017.03.20
Changed the algorithm of binding the wave symbols to extremums of the price bars.
Versão 151.8 2017.03.14
Made changes to the pattern search algorithm
Versão 151.7 2017.03.09
Fixed the pattern search algorithm
Versão 151.6 2017.02.13
Fixed the algorithm for fractal filtering of the wave layout.
Earlier, the fractal filtering hid the wave layout, when certain timeframes were missing quotes.
Versão 151.5 2017.02.09
Fixed saving of the number of the wave layout attached to the chart.
Added a monthly check for presence of files with object archives for the deleted windows with charts.
In case such files are found, they are deleted.

Fixed names of the colors in the color selection table.
Versão 151.4 2017.01.31
Fixed the deletion of one wave level of the wave layout.
There was the following error. If one wave level was created, and then only this level was deleted, the ZigZag was removed but the symbols of the wave level remained on the chart until the indicator was reloaded or timeframe was changed.
Versão 151.3 2017.01.09
Added. When hovering over the pattern lines created using parameters, the tooltip displays the range of timeframes where the tooltips can be displayed without distortions.
Also, when hovering the pattern name in the pattern monitor, the tooltip displays a similar range of timeframes.
Fixed known bugs.