AnyChart MT4
- Utilitários
- Irek Gilmutdinov
- Versão: 1.1
- Atualizado: 24 novembro 2021
- Ativações: 10
AnyChart is a multifunctional tool allowing you to work with non-standard charts in MetaTrader 4. It includes collector of ticks and generator of charts for trading (hst files) and testing (fxt files). Supported chart types are second, tick and renko ones.
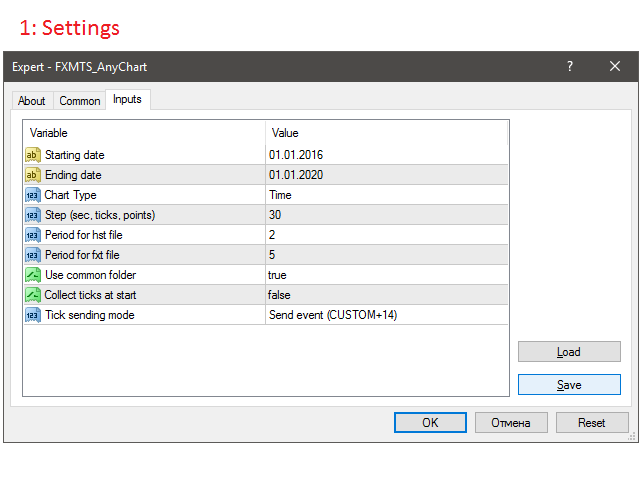
Settings
- Starting Date - start date for chart plotting.
- Ending Date - end date for chart plotting.
- Chart Type - chart type:
- Time - time chart, each bar contains a certain time interval;
- Tick - volume chart, each bar contains a certain number of ticks;
- Renko-real - renko chart, each bar contains a certain price range. Only actual prices are used;
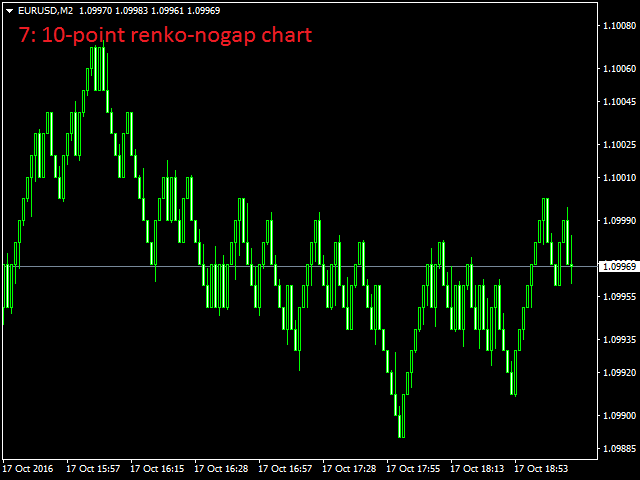
- Renko-nogaps - smoothed renko chart, each bar contains a certain price range. Gaps are closed by synthetic bars, open and close prices are smoothed.
- Step (sec, ticks, points) - bar step (in seconds, ticks, points).
- Period for hst file - offline chart period (should be non-standard).
- Period for fxt file - tester file period (should be standard).
- Use common folder - use common data folder for writing/reading tick history.
- Collect ticks at start - start collecting ticks immediately after the launch.
- Tick sending mode - mode of sending a new tick to an offline chart:
- Off - do not send;
- Send event (CUSTOM+14) - send as a custom event.
Description
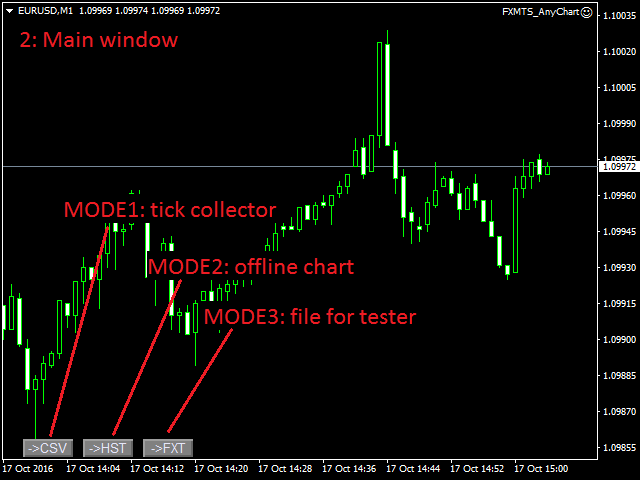
The program interface consists of three buttons (screenshot 2).
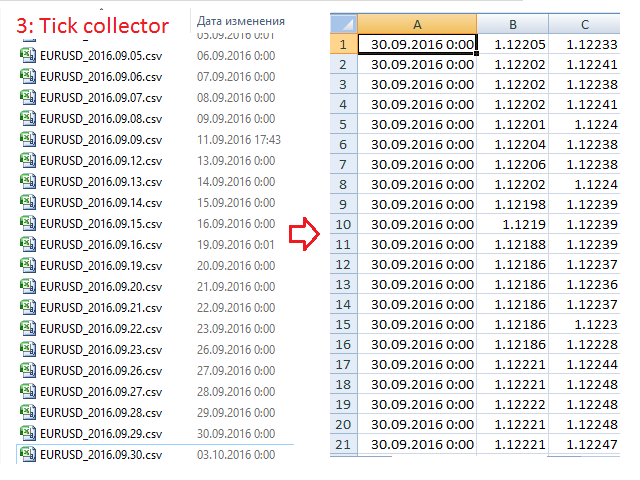
Mode 1 - collecting ticks (screenshot 3):
The mode is activated by ->CSV button. If Collect ticks at start = true, the mode is enabled automatically during the launch, otherwise it should be activated manually.
Use common folder defines the folder the files should be saved to - the common terminal folder or the current terminal one.
Tick history files are csv files containing three columns - time, bid and ask - located in the ..\Files\ subdirectory.
Tick collection is recommended to be performed daily on a separate computer (VPS).
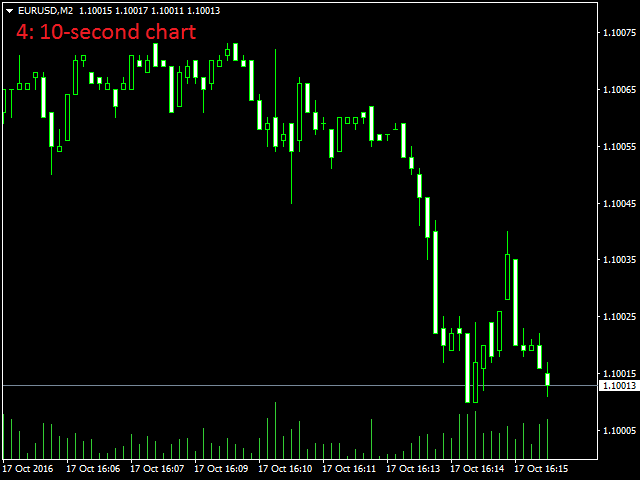
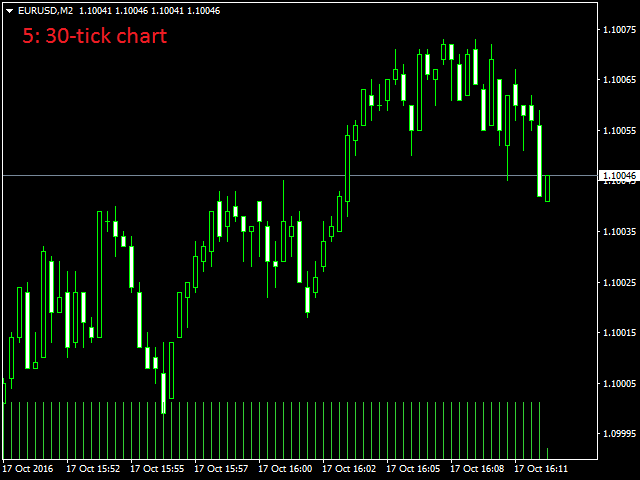
Mode 2 - offline chart (screenshots 4-7):
When clicking ->HST, the program generates an offline chart using the available tick history, opens it and updates it in real time based on incoming price data.
The chart type is defined by Chart Type and Step settings, Period for hst file should be non-standard. Start and end dates are defined by Starting Date and Ending Date.
All indicators on the chart will be updated correctly. However, some changes should be made in the code to let EAs operation. The entire EA logic should be moved from the OnTick() handler to OnChartEvent().
{
//take all EA logic from here
}
void OnChartEvent(const int id,
const long &lparam,
const double &dparam,
const string &sparam)
{
if (id == CHARTEVENT_CUSTOM+14)
{
//and place it right here
}
}
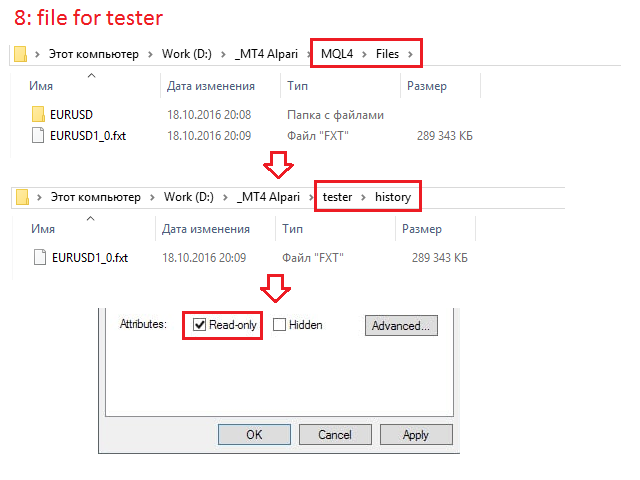
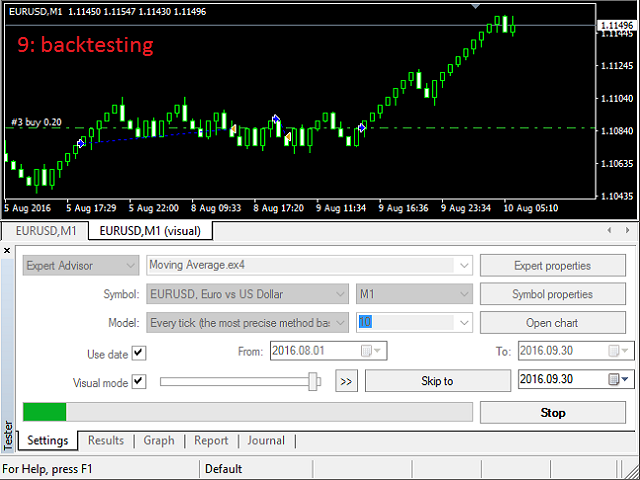
Mode 3 - tester file (screenshots 8-9):
When clicking ->FXT, the program generates the tester file using the available tick history.
The chart type is defined by Chart Type and Step settings, Period for txt file should be standard. Start and end dates are defined by Starting Date and Ending Date.
The file is created in the ..\MQL4\Files\ subdirectory. Move it to ..\tester\history\ manually and apply the read-only attribute (so that it is not overwritten by the tester).
Note! A saved ask price is not applied when testing. Testing can only be performed with a fixed spread set in the tester settings!





























O usuário não deixou nenhum comentário para sua avaliação