• Visão global
  • Comentários
  • Discussão (10)
  • O que há de novo

Pan PrizMA

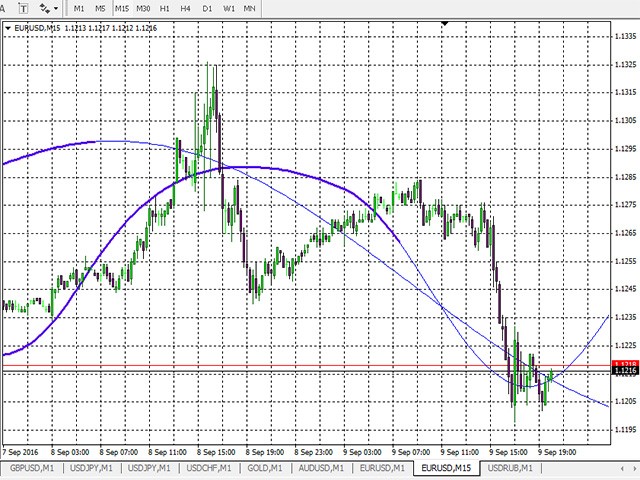
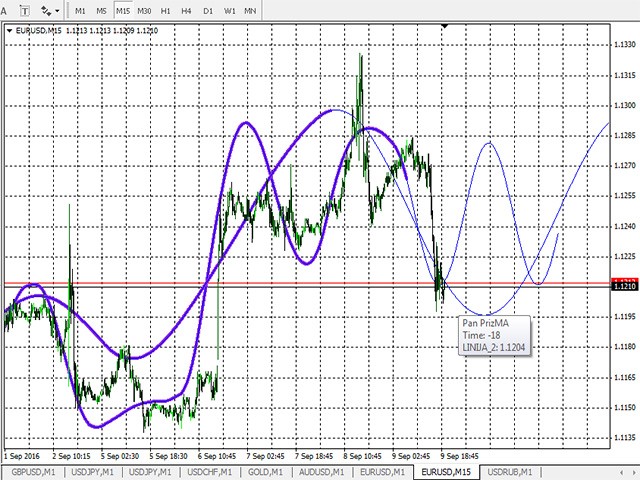
At the very least, this indicator is able to entertain you. It builds a moving line based on interpolation by a polynomial of 1-4 powers and/or a function consisting of a sum of 1-5 sine curves. Various combinations are possible, for example, a sum of three sine curves about a second order parabola. The resulting line can be extrapolated by any of the specified functions and for various distances both as a single point at each indicator step (unchangeable line), and as a specified (re-painted) function segment for visualization.

The indicator involves four lines. Each successive indicator line is based on the results of a previous one. Each line, except the first one, can be averaging or extrapolating depending on a specified direction: (-1) - averaging or (1) - extrapolation.


Linear interpolation

We need at least two points for a straight line, three points for a square parabola, four ones for a cubic parabola, etc.

A straight line is an arithmetic progression allowing you to obtain a third point after the first two ones:

E3 = (E2-E1)+E2 = 2*E2 – E1 is a difference first-order equation for equidistant points (similar to the equation after the reduction of all Lagrange equation ratios).


Trigonometric interpolation

Use the double angle sine equation: Sin 2a = 2 * Cos a * Sin a. We can prove its validity geometrically as Sin 2a = 2 * Cos a * Sin a - 0 and Sin 3a = 2 * Cos a * Sin 2a - Sin a, etc., where Cos a is a one step angle cosine, while Sin is in fact the appropriate chart value. In that case, a difference first-order equation for the sine curve about zero looks as follows: E3 = 2 * Cos a * E2 - E1. Here we can see a perfect analogy with the straight line equation. In the indicator, transition from trigonometric equations to linear ones is performed by assigning the period equal to one. Cos 360 is equal to 1 turning the equation into a linear one.


External variables (using the first two lines as examples)

  • line_1_power =12 - interpolating line power. For the trigonometric function, power 2 corresponds to a single sine curve about the constant. Power 3 corresponds to a single sine curve about the inclined line. Power 4 corresponds either to a single sine curve about the square parabola, or two sine curves about the constant, etc. In this case, power 12 at the six periods specified below corresponds to the function comprised of 6 sinusoids about the constant.
  • line_1_leverage =10 - interpolation leverage. The equivalent of the smoothing period. In particular, the line of interpolation by the power of one fully corresponds to standard EMA with a double period value.
  • line_1_interval =1 - interval between adjacent points used in the calculation (not to be confused with the leverage). In particular, the straight line connects three points (two of them being adjacent, while the remaining one is at the leverage distance).
  • line_1_period_1=6 - sinusoid curve period if the function is trigonometric. If the function is linear, the value of 1 is set.
  • line_1_period_2=7.5
  • line_1_period_3=10
  • line_1_period_4=20
  • line_1_period_5=60
  • line_1_period_6=240
  • line_1_shift =0 - indicator line shift. Positive values are shifted to the right, while negative ones - to the left. By default, the lines are plotted considering the leverage shift.
  • XXXXXXXXXXXXXXXXXXXXXXXX1=2 - separator for parameters of different lines, for clarity.
  • line_2_trend =1 - line calculation direction: (-1) - smoothing, (1) - extrapolation.
  • line_2_power =10 - interpolating line power. If the remaining parameters are similar to the smoothing ones, the second line passes through the last bar open point. Powers 1001, 1002, 1003-1009, 1010 extrapolate the function segment. The function segment is re-painted at each bar and is necessary only for visualization.
  • line_2_leverage =8 - interpolation leverage, at each value the indicator draws one point at the distance of this leverage, which is not redrawn during the bar formation, as it is based on the opening price. In case of powers 1001, 1002, 1003-1009, 1010, it sets the plotted function segment line.
  • line_2_interval =1 - interval between adjacent points used in the calculation.
  • line_2_period_1 =6 - sinusoid curve period if the function is trigonometric. If the function is linear, the value of 1 is set.

There may be external parameter combinations taking the line far away from the current price (high power values, large leverage, unsuitable combination of a sine curve and a leverage). This is not a program error. The easiest way is to open a beginning of a chart and examine the line. For example, interpolation using a polynomial greater than the fourth power is mathematically possible. However, the oscillation amplitude of the smoothed line grows quickly resembling a resonance.

Produtos recomendados
Vol MACD
Calin Adrian David
The MACD indicator is based on volume , which can offer us a very valuable type of information (it marks the long or short strength of each candle), es pecially if we are operating in shorter time frames.  Green = bullish signal; Red = bearish  signal; Blue = MACD  volume Parameters: Fast: Numbers of bars used for fast period calculations  Slow: Numbers of bars used for slow period calculations 
RoboTradeSoft Bands
Volodymyr Hrybachov
The Expert Advisor with strategy based on the Bollinger Bands indicator. When the price is above or below the Bollinger Bands and the channel expands by the specified range, a trade is opened. For example, if the Ask price is less than the lower band of the indicator and the difference between the upper and lower bands of the indicator exceeds the distance of Delta, the EA will open a buy. For sell trades it is the opposite: if the Bid price is greater than the upper band of the indicator and th
This indicator is based on the classical indicator  Parabolic SAR  and will be helpful for those who love and know how to use not a visual, but digital representation of the indicator.  All TimeFrames PSAR MT5  indicator shows values from each timeframe (M1, M5, M15, M30, H1, H4, D1, W1 and MN1). You will be able to change the main input parameters for each Stochastic from every TF. Example for M1: sTF1 = M1 pStep1 = 0.02 pMax1 = 0.2
10 cópias a 149 $! O próximo preço será $ 499. SYDNEY TRADE X aplica a tecnologia inteligente de ponta da BTN TECHNOLOGY para ajudá-lo a criar resultados ideais para suas negociações. Em particular, o Modo Perfeito permite que você negocie vitórias de 100% (mas é necessário garantir fundos suficientes). Se o Modo Perfeito for para usuários avançados, iniciantes ou aqueles que preferem negociação segura podem usar o Modo de Segurança. O Modo de segurança faz a liquidação em um horário de
Super Martingale
Volodymyr Hrybachov
3 (2)
This Expert Advisor uses martingale and order grid. An initial deal is opened when the price touches or breaks a price channel. The price channel is modified by timer in seconds. The following deals are opened by specified parameters. The EA flexibly configures step and volume, multiplier factor, amount of market orders to start increasing a step or a volume to open new orders. The EA has been adapted for 4-5-digit quotes. The EA is recommended for use on EURUSD, GBPUSD, AUDUSD, USDJPY, USDCHF,
The Last Fractals , is a trading system that uses fractals to determine market corrections. The Last Fractals, is a system that detects an entry point and initiates an operational algorithm. This algorithm is different if the input is correct or wrong. From the inputs you can control the initial loting of the algorithm, if the trade goes against you the lotage is maintained, but if it goes in your favor the lotage is increased to improve your profit. You can download the demo and test it
"Price Action Scalping EA" is a professional forex robot designed for strategic scalping trading on the XAUUSD currency pair on the M5 timeframe. Each trade of the robot is accompanied by a stop loss and a trailing stop, which increases the level of security when trading. The name "Price Action Scalping EA" corresponds to the high quality standards of the robot: accuracy, speed and trading efficiency. Price action is a technical analytics tactic based on the analysis of the previous price actio
Jet Punch
Didit Haryadi Saputra
Jet Punch is another best expert advisor for MT4,  can help you make money while you sleep by automatically entering and exiting trades. It trades by opening trades every day and closing them at the right time to ensure you always earn a profit. The software is very simple and can be used by both beginner and experienced traders.  Jet Punch was tested and has successfully passed the stress test with slippage and commission approximate to the real market condition. Recommendations: Currency pair
Fx4lights
Vladimir Deryagin
The Expert Advisor consists of four popular indicators: MovingAverage Stochastic MACD ZigZag It is possible to use all four indicators both together, and individually, selecting the necessary combination. Basic settings of the Expert Advisor Magic - order magic number Volume - volume for opened trades Slippage - price slippage when opening orders. StopLoss - close orders after reaching a certain loss in points, TakeProfit - desired profit in points. TrailingStop - move StopLoss to order's open
The block of bars is collected under condition of divergence . If the divergence conditions are not met, the block is deleted. More precisely, the condition is the transition of the block of bars from the state of divergence to the state of convergence . Blocks are formed selectively with gaps. Gaps are characterized by the state of convergence of bars. The indicator shows the value and direction of the price in the divergence block . To determine the divergence value, see here , the line of ex
GG TrendBar Indicator
Biswarup Banerjee
5 (1)
GG TrendBar Indicator - Your Multitimeframe ADX Trading Solution Experience the power of multi-timeframe trading with the "GG TrendBar Indicator." This versatile tool, built upon the ADX indicator, offers precise insights by considering multiple timeframes, ensuring you make well-informed trading decisions. Basic Details : Indicator Type : GG TrendBar Indicator (Multi-Timeframe ADX) Key Metrics : Real-time ADX analysis across multiple timeframes. Customization : Enable or disable specific timefr
Laboratory.Money GBP/CHF M30 Автоматическая Торговая Система из серии Energy Drive GBP/CHF M30 Вся активность эксперта проявляется только на реальной торговле. Его нет толку проверять в тестере стратегий. Запрещается бонус от брокера к вашему депозиту. Эксперт торгует с теми деньгами которые могут уйти в просадок, бонус в просадке не участвует, это приведёт к потере всего вашего депозита. Данный эксперт очень подходит для программы "Rebate" от вашего брокера. Все изменения в на
Price Action Trader EA mz
DMITRII GRIDASOV
5 (1)
Price Action Trader EA - é um sistema de negociação automático perfeito baseado na pesquisa de ação de preço! Este é o Expert Advisor "configure e esqueça" que está fazendo todo o trabalho de negociação para você! 7 Conjunto de arquivos disponíveis! A ideia de negociação é baseada no famoso e poderoso padrão Price Action   - PinBar ! Price Action Trader EA é um investimento muito bom - funcionará anos e anos para você, todos os Set_files têm expectativa matemática positiva! Use Definir
Simply System Trend Line
Szymon Palczynski
5 (1)
I personally love trading robots, but there are many situations where semi-auto trading is superior to automation. The system is very simple and effective.  Trend lines are typically used with price charts, however they can also be used with a range of technical analysis charts such as CCI and RSI.  What is the trend line?  Trend line is a bounding line for the price movement. It is formed when a diagonal line can be drawn between a minimum of three or more price pivot points. A line c
SystemBinaryM1
Andrey Spiridonov
SystemBinaryM1 - a professional indicator for trading short-term binary options, is a complete, self-contained author's strategy for working in the binary options market. The unique algorithm for analyzing the foreign exchange market is based on the calculation of reference points on three different time periods M15, M5. M1. Thus, the indicator simultaneously analyzes the long-term, medium-term and short-term price behavior before issuing a signal. The indicator is set in the usual way and work
King Grid
Luis Mariano Vazquez Marcos
King Gold Grid Presentamos con orgullo el revolucionario Asesor Experto de Sistema Grid, una obra maestra creada por  Mr Beast. Este excepcional producto se distingue como uno de los mejores en su categoría, destacando por su magnífica gestión de riesgos y especialización en el trabajo con el oro. Diseñado meticulosamente para optimizar la eficiencia y maximizar los beneficios, este asesor experto se erige como un líder indiscutible en el mundo de los sistemas de rejilla. Su capacidad para adapt
Trend Channel is a Forex trend arrow indicator for identifying potential entry points. I like it, first of all, because it has a simple operating mechanism, adaptation to all time periods and trading tactics. Created based on a regression channel with filters. We display the signals of the Trend Channel indicator on the price function chart using a mathematical approach. How it works: when the price breaks through the overbought/oversold zone (channel levels), a buy or sell signal is generate
MA Crosses PRO MT4
Volodymyr Hrybachov
5 (1)
MA CROSSES PRO MT4 é um indicador de seta cruzada de média móvel. Os parâmetros do indicador têm nomes intuitivos e cada uma das linhas é configurada separadamente. O indicador pode sinalizar um sinal exibindo setas, emitindo um sinal sonoro, enviando uma notificação para terminais móveis e e-mail. O indicador NÃO é redesenhado Sinais apenas no fechamento da vela Excelente para escalpelamento Funciona em qualquer par e qualquer período de tempo Quanto mais antigo for o prazo, melhor será
Based on Trend Following Strategy, QCAFE SUITE was built to get more accurate signal for Traders to decide whether to enter trades, included in the SUITE is QCAFE+ filter to eliminate false signals.  The Signals are generated based on formula of Hull Moving Average ( HMA ) to minimize the lag of a traditional moving average - developed by Alan Hull in 2005 Setting: Limited Bars of back test Fast Period Low Period  Fast/Low period to generate Buy/Sell signal Based MA Period B ased Moving Averag
AlibabaFX
Van Hoa Nguyen
5 (2)
AlibabaEA is an advanced grid system that has been running on real accounts for many years. Instead of adjusting the system to reflect historical data (like most people do), the system is designed to exploit existing market weaknesses. Therefore, this is not a "pure scalping" system, but this system exists only by using DCA at high-reversal price zones. At the same time, this system uses real market mechanisms to its advantage to make profits. Note: Price will increase by $20 every 24h or 48h S
Girtab
Volodymyr Hrybachov
5 (1)
Strategy is based on the position of the previous bar relative to the Moving Average indicator. Working timeframe is М30. Features The template features an adaptive forecast algorithm based on history data of price action; It has multiple filters for opening new orders; Compatible with any trading strategy, both manual or automatic (Expert Advisors); It has the maximum possible and compatible functionality: adaptive order grid, locking, averaging, rebuying. Expert Advisor Installation The quot
DYJ GlobalTradeGameTheory(Power)  is based on   Bulls   and  Bears  indicator. It can be used for any currency pair and timeframe. Power: Market entry condition  Power attempts to gauge bullish and bearish forces in the market by using two separate measures, one for each type of directional pressure. The  EA's BearsIndex  attempts to measure the market's appetite for lower prices The EA's BullsIndex attempts to measure the market's appetite for higher prices It also uses  Laguerre filtering fa
Macd Pro I
Steve Zoeger
MACD Pro I EA https://youtu.be/2wCzTFIGNp4 =============== This Robot is fully automated and has been created for everyone. The Robot works also on cent accounts. The Ea is based on the MACD Indicator and 3 more and has been kept simple. ========================================= Maybe better to go for small profit, set it on higher time frames then you can use it for more pairs at the same time. =========================================== => works on all Time Frames but i would recommend
New, more accurate version of the Xmaster indicator. More than 200 traders from around the world have conducted more than 15,000 tests of different combinations of this indicator on their PCs in order to get the most effective and accurate formula. And here we present to you the "Xmaster formula indicator forex no repaint" indicator, which shows accurate signals and does not repaint. This indicator also sends signals to the trader by email and push. With the arrival of each new tick, it constan
IRobot Alligators
Paranchai Tensit
IRobot Alligators is an Expert Advisor based on the chaos theory and the Alligator technical indicator. This expert advisor consists of three lines, overlaid on a price chart, that represent the jaw, the teeth and the lips of the Alligator. It was designed to help confirm that a trend is in effect and in what direction. As with all moving averages, the shortest one (green) moves first, followed by the middle (red) and then longer average (blue). If the three lines are entwined, then the Alligato
Extremums Max
Vitalii Zakharuk
Extremums  Max  is an indicator of trend and trading signals, based on the principle of a combined analysis of calculated reference points within the channel as well as overbought and oversold levels. The indicator forms arrows (by default, red and blue). The indicator is set in the usual way to any trading symbol with any time interval. Indicator Benefits High accuracy; Work with any trade symbols; It works at any time intervals; Not redrawn. Input parameters Period - indicator period; Lev
VolumeDayTrader
Thomas Bradley Butler
DAYTRADING apenas para AÇÕES (CFD's). Negociar dá trabalho. Não há atalhos ou indicadores que dirão todas as entradas e saídas. O lucro vem do estado de espírito. Os indicadores são ferramentas a serem usadas em conjunto com a gestão do dinheiro e a psicologia do sucesso. Encontre desequilíbrios no perfil de volume. Desequilíbrios de volume de preços de comércio. Muitos desequilíbrios acontecem no fechamento e na abertura e nas notícias. Veja os compradores versus vendedores em ações. Use e
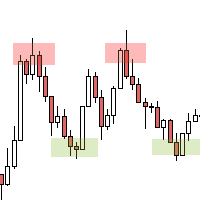
Uma implementação pessoal de blocos de pedidos, uma estratégia de negociação de posição simples, mas eficaz. O negociador deve entrar no mercado ou procurar negociações na direção do último bloco de ordem, se a faixa de preço não foi violada na direção oposta ao rompimento. Blocos abertos não são desenhados para maior clareza. [ Guia de instalação | Guia de atualização | Solução de problemas | FAQ | Todos os produtos ] Um bloco aberto de alta é a primeira barra de alta após uma nova baixa do m
Exp Tick Hamster MT4
Vladislav Andruschenko
3.5 (14)
Especialista em otimização automática de todos os parâmetros de qualquer símbolo de negociação para MetaTrader 4. T rading EA sem configurações! Tick   Hamster     - Este é um   especialista em negociação automatizado para iniciantes e usuários que não desejam configurar um consultor! Experimente negociações automatizadas sem complicações com nosso consultor especialista para iniciantes. Não precisa se preocupar com configurações complicadas – nosso especialista cuida de tudo para você. Comece s
Trend Filter MT4
KEENBASE SOFTWARE SOLUTIONS
"The trend is your friend" is one of the oldest and best-known sayings in financial markets. However, this message only represents half of the picture. The correct saying should be, "The trend is your friend only until it ends." KT Trend Filter solves this problem by clearly indicating the start of an Uptrend and Downtrend using an averaging equation on the price series. If the trend direction is not clear, it shows the trend as sideways showing the uncertainty in the market. Features Get a
Os compradores deste produto também adquirem
Gann Made Easy
Oleg Rodin
4.88 (100)
Gann Made Easy é um sistema de negociação Forex profissional e fácil de usar, baseado nos melhores princípios de negociação usando a teoria do sr. W. D. Gann. O indicador fornece sinais precisos de COMPRA e VENDA, incluindo níveis de Stop Loss e Take Profit. Você pode negociar mesmo em movimento usando notificações PUSH. Entre em contato comigo após a compra! Vou compartilhar minhas dicas de negociação com você e ótimos indicadores de bônus de graça! Provavelmente você já ouviu muitas vezes sobr
Trend Punch
Mohamed Hassan
4.92 (24)
This indicator is unstoppable when combined with our other indicator called  Support & Resistance . After purchase, send us a message and you will get it   for  FREE as a BONUS! Introducing Trend Punch , the revolutionary forex trend indicator that will transform the way you trade! Trend Punch is uniquely designed to provide precise buy and sell arrows during strong market trends, making your trading decisions clearer and more confident. Whether you're trading major currency pairs or exotic sym
Gold Stuff
Vasiliy Strukov
4.9 (270)
Gold Stuff-um indicador de tendência projetado especificamente para o ouro, também pode ser usado em qualquer instrumento financeiro. O indicador não é redesenhado ou atrasado. O timeframe recomendado é H1. O EA Gold Stuff Expert Advisor está escrito neste indicador, você pode encontrá-lo no meu perfil. Importante! Entre em contato comigo imediatamente após a compra para obter instruções e bônus!  Você pode obter uma cópia gratuita do nosso indicador Strong Support e Trend Scanner, envie um
FX Power MT4 NG
Daniel Stein
5 (13)
Receba a sua atualização diária do mercado com detalhes e screenshots através do nosso Morning Briefing aqui no mql5 e no Telegram ! O FX Power MT4 NG é a próxima geração do nosso medidor de força de moeda muito popular de longa data, o FX Power. E o que é que este medidor de força da próxima geração oferece? Tudo o que adorou no FX Power original MAIS Análise de força GOLD/XAU Resultados de cálculo ainda mais precisos Períodos de análise configuráveis individualmente Limite de cálculo personal
LEIA AS INFORMAÇÕES ABAIXO ANTES DE COMPRAR O PRODUTO! Apollo Pips PLUS SP é um produto único! É PARA QUEM QUER ADQUIRIR MEU NOVO INDICADOR "APOLLO PIPS" MAIS BÔNUS "SUPER PACK" COM ACESSO A TODOS OS MEUS INDICADORES DE NEGOCIAÇÃO! Ao adquirir o produto Apollo Pips PLUS SP você está na verdade adquirindo uma versão absolutamente nova do meu indicador Apollo Pips. Esta versão do indicador possui um algoritmo aprimorado e um parâmetro fácil de usar que lhe dá a oportunidade de usar o indicador em
TPSproTREND PrO
Roman Podpora
4.79 (19)
TPSpro TREND PRO   é um indicador de tendência que analisa automaticamente o mercado e fornece informações sobre a tendência e cada uma de suas mudanças, além de dar sinais para entrar em negociações sem redesenhar! O indicador utiliza cada vela, analisando-as separadamente. referindo-se a diferentes impulsos - impulso para cima ou para baixo. Pontos de entrada exatos em transações de moedas, criptomoedas, metais, ações, índices! Versão MT5                   DESCRIÇÃO COMPLETA DO INDICADOR    
Trend Pulse
Mohamed Hassan
5 (5)
Please contact me after purchase to immediately get your PDF strategy + documentation for Trend Pulse !  Official release price of $89  (2 /50 copies left). Next price is $199 . Introducing Trend Pulse , a unique and robust indicator capable of detecting bullish, bearish, and even ranging trends! Trend Pulse uses a special algorithm to filter out market noise with real precision. If the current symbol is moving sideways, Trend Pulse will send you a ranging signal, letting you know that it'
Scalper Inside PRO
Alexey Minkov
4.75 (60)
An exclusive indicator that utilizes an innovative algorithm to swiftly and accurately determine the market trend. The indicator automatically calculates opening, closing, and profit levels, providing detailed trading statistics. With these features, you can choose the most appropriate trading instrument for the current market conditions. Additionally, you can easily integrate your own arrow indicators into Scalper Inside Pro to quickly evaluate their statistics and profitability. Scalper Inside
Atomic Analyst
Issam Kassas
5 (3)
Primeiramente, vale ressaltar que este Indicador de Negociação não repinta, não redesenha e não apresenta atrasos, tornando-o ideal tanto para negociação manual quanto automatizada. Manual do utilizador: configurações, entradas e estratégia. O Analista Atômico é um Indicador de Ação de Preço PA que utiliza a força e o momentum do preço para encontrar uma vantagem melhor no mercado. Equipado com filtros avançados que ajudam a remover ruídos e sinais falsos, e aumentam o potencial de negociação.
Trend Screener
STE S.S.COMPANY
4.82 (92)
Indicador de tendência, solução única inovadora para negociação e filtragem de tendências com todos os recursos de tendências importantes construídos dentro de uma ferramenta! É um indicador multi-timeframe e multi-moedas 100% sem repintura que pode ser usado em todos os símbolos/instrumentos: forex, commodities, criptomoedas, índices e ações. O Trend Screener é um indicador eficiente que segue a tendência do indicador que fornece sinais de tendência de seta com pontos no gráfico. Os recursos qu
Currency Strength Wizard é um indicador muito poderoso que fornece uma solução completa para uma negociação bem-sucedida. O indicador calcula o poder deste ou daquele par forex usando os dados de todas as moedas em vários intervalos de tempo. Esses dados são representados em uma forma de índice de moeda fácil de usar e linhas de energia de moeda que você pode usar para ver o poder desta ou daquela moeda. Tudo o que você precisa é anexar o indicador ao gráfico que deseja negociar e o indicador mo
- Real price is 80$ - 40% Discount ( It is 49$ now ) Contact me for instruction, any questions! Introduction The breakout and retest strategy is traded support and resistance levels. it involves price breaking through a previous level.  The break and retest strategy is designed to help traders do two main things, the first is to avoid false breakouts. Many false breakouts start with a candlestick that breaks out of a level but ends with an immediate candlestick that brings the price back into t
Actualmente 20% OFF ! A melhor solução para qualquer novato ou comerciante especializado! Este software de painel de instrumentos está a funcionar em 28 pares de moedas. É baseado em 2 dos nossos principais indicadores (Advanced Currency Strength 28 e Advanced Currency Impulse). Dá uma grande visão geral de todo o mercado Forex. Mostra valores avançados de força da moeda, velocidade de movimento da moeda e sinais para 28 pares de divisas em todos os (9) períodos de tempo. Imagine como a sua
Clear Breakout
Martin Alejandro Bamonte
5 (1)
O indicador "Breakout Buy-Sell" foi desenvolvido para identificar e destacar potenciais oportunidades de compra e venda com base em rompimentos de preços durante diferentes sessões de mercado (Tóquio, Londres e Nova York). Este indicador ajuda os traders a visualizar claramente as zonas de compra e venda, bem como os níveis de take-profit (TP) e stop-loss (SL). Estratégia de Uso O indicador pode ser usado da seguinte maneira: Configuração Inicial : Selecione a sessão do mercado e ajuste o offset
ACTUALMENTE COM 26% DE DESCONTO A melhor solução para qualquer novato ou comerciante especializado! Este Indicador é uma ferramenta comercial única, de alta qualidade e acessível, porque incorporámos uma série de características proprietárias e uma nova fórmula. Com apenas UM gráfico, pode ler a força da moeda para 28 pares de Forex! Imagine como a sua negociação irá melhorar porque é capaz de apontar o ponto exacto do gatilho de uma nova tendência ou oportunidade de escalada? Manual do u
O sistema PRO Renko é um sistema de negociação altamente preciso especialmente concebido para a negociação de gráficos RENKO. Trata-se de um sistema universal que pode ser aplicado a vários instrumentos de negociação. O sistema neutraliza eficazmente o chamado ruído de mercado, dando-lhe acesso a sinais de inversão precisos. O indicador é muito fácil de usar e tem apenas um parâmetro responsável pela geração de sinal. Você pode facilmente adaptar a ferramenta a qualquer instrumento de negoc
Gold Channel   é um indicador baseado na volatilidade, desenvolvido com um algoritmo de tempo especifico para o par XAUUSD que consiste em encontrar possíveis correções no mercado. Este indicador mostra duas linhas exteriores, uma interior (linha de retração) e um sinal de seta, onde a teoria do canal consiste em ajudar a identificar condições de sobrecompra e sobrevenda no mercado. O preço do mercado cairá geralmente entre os limites do canal. Se os preços tocarem ou se moverem para fora do can
Antes de tudo, vale ressaltar que esta Ferramenta de Negociação é um Indicador Não Repintante, Não Redesenhante e Não Atrasado, o que a torna ideal para negociação profissional. Curso online, manual do utilizador e demonstração. O Indicador de Conceitos de Ação de Preço Inteligente é uma ferramenta muito poderosa tanto para traders novos quanto experientes. Ele combina mais de 20 indicadores úteis em um único, combinando ideias avançadas de negociação como Análise do Trader do Círculo Interno e
ACTUALMENTE 31% DE DESCONTO!! A melhor solução para qualquer novato ou comerciante especializado! Este indicador é uma ferramenta comercial única, de alta qualidade e acessível, porque incorporámos uma série de características proprietárias e uma fórmula secreta. Com apenas UM gráfico, dá alertas para todos os 28 pares de moedas. Imagine como a sua negociação irá melhorar porque é capaz de identificar o ponto exacto de desencadeamento de uma nova tendência ou oportunidade de escalada! Con
NAM Order Blocks
NAM TECH GROUP, CORP.
5 (1)
Indicador de detecção de blocos de pedidos de multi-timeframe MT4. Características - Totalmente personalizável no painel de controle do gráfico, fornece interação completa. - Oculte e mostre o painel de controle onde quiser. - Detectar OBs em vários períodos de tempo. - Selecione a quantidade de OBs para exibir. - Interface de usuário de OBs diferente. - Filtros diferentes em OBs. - Alerta de proximidade OB. - Linhas ADR de alta e baixa. - Serviço de notificação (alertas de
RelicusRoad Pro
Relicus LLC
4.73 (141)
Agora US $ 147 (aumentando para US $ 499 após algumas atualizações) - Contas ilimitadas (PCs ou Macs) Manual do usuário do RelicusRoad + vídeos de treinamento + acesso ao grupo de discórdia privado + status VIP UMA NOVA FORMA DE OLHAR PARA O MERCADO O RelicusRoad é o indicador de negociação mais poderoso do mundo para forex, futuros, criptomoedas, ações e índices, oferecendo aos traders todas as informações e ferramentas necessárias para se manterem rentáveis. Fornecemos análises técnica
PZ Trend Trading
PZ TRADING SLU
4.8 (5)
O Trend Trading é um indicador projetado para lucrar o máximo possível com as tendências que ocorrem no mercado, cronometrando retrocessos e rupturas. Ele encontra oportunidades de negociação analisando o que o preço está fazendo durante as tendências estabelecidas. [ Guia de instalação | Guia de atualização | Solução de problemas | FAQ | Todos os produtos ] Negocie mercados financeiros com confiança e eficiência Lucre com as tendências estabelecidas sem ser chicoteado Reconhecer retrocesso
TPSpro RFI Levels
Roman Podpora
4.83 (24)
Reversal First Impulse levels (RFI)    INSTRUCTIONS        RUS       -       ENG              R ecommended to use with an indicator   -   TPSpro  TREND PRO -  Version MT5 A key element in trading is zones or levels from which decisions to buy or sell a trading instrument are made. Despite attempts by major players to conceal their presence in the market, they inevitably leave traces. Our task was to learn how to identify these traces and interpret them correctly. Main functions: Displaying activ
Break and Retest
Mohamed Hassan
4.17 (18)
This Indicator only places quality trades when the market is really in your favor with a clear break and retest. Patience is key with this price action strategy! If you want more alert signals per day, you increase the number next to the parameter called: Support & Resistance Sensitivity.  After many months of hard work and dedication, we are extremely proud to present you our  Break and Retest price action indicator created from scratch. One of the most complex indicators that we made with ove
Order Block Hunter
Noha Mohamed Fathy Younes Badr
5 (2)
Order block hunter indicator is the best indicator for  hunt the order blocks that area where there has been a large concentration of limit orders waiting to be executed Order blocks are identified on a chart by observing previous price action and looking for areas where the price experienced significant movement or sudden changes in direction .This indicator does that for you by using very complicated codes and helps you to take the best areas To buy and sell because it make marks at the best a
Scalper Vault
Oleg Rodin
5 (29)
Scalper Vault é um sistema profissional de escalpelamento que fornece tudo o que você precisa para um escalpelamento bem-sucedido. Este indicador é um sistema de negociação completo que pode ser usado por comerciantes de forex e opções binárias. O período de tempo recomendado é M5. O sistema fornece sinais de seta precisos na direção da tendência. Ele também fornece sinais superiores e inferiores e níveis de mercado Gann. Os indicadores fornecem todos os tipos de alertas, incluindo notificações
IX Power MT4
Daniel Stein
5 (6)
O IX Power traz finalmente a precisão imbatível do FX Power para símbolos não-Forex. Determina com exatidão a intensidade das tendências a curto, médio e longo prazo nos seus índices, acções, mercadorias, ETFs e até criptomoedas favoritos. Pode analisar tudo o que o seu terminal tem para oferecer. Experimente e veja como o seu timing melhora significativamente quando negoceia. Características principais do IX Power Resultados de cálculo 100% precisos e sem repintura - para todos os símb
Desenhe automaticamente os níveis de apoio e resistência MAIS espaços de velas de propulsão no seu gráfico, para que possa ver para onde é provável que o preço se dirija a seguir e/ou potencialmente inverta. Este indicador foi concebido para ser utilizado como parte da metodologia de negociação de posições ensinada no meu website (The Market Structure Trader) e exibe informação chave para a segmentação e potenciais entradas. Existem 2 características CORE no indicador e 4 características ad
M1 Arrow
Oleg Rodin
4.73 (15)
Uma estratégia intradiária baseada em dois princípios fundamentais do mercado. O algoritmo é baseado na análise de volumes e ondas de preços usando filtros adicionais. O algoritmo inteligente do indicador dá um sinal apenas quando dois fatores de mercado se combinam em um. O indicador calcula ondas de um determinado intervalo no gráfico M1 usando os dados do período de tempo mais alto. E para confirmar a onda, o indicador utiliza a análise por volume. Este indicador é um sistema de negociação pr
Torne-se um Negociador Breaker e lucre com as mudanças na estrutura do mercado à medida que o preço reverte. O indicador de quebra de bloco de pedidos identifica quando uma tendência ou movimento de preço está chegando à exaustão e pronto para reverter. Ele o alerta sobre mudanças na estrutura do mercado, que normalmente ocorrem quando uma reversão ou uma grande retração está prestes a ocorrer. O indicador usa um cálculo proprietário que identifica rupturas e momento do preço. Toda vez que
Mais do autor
Pan PrizMA CD Phase is an analogue of the МetaТrader 5 indicator , and is an option based on the Pan PrizMA indicator. Details . Averaging by a quadric-quartic polynomial increases the smoothness of lines, adds momentum and rhythm. Extrapolation by the sinusoid function near a constant allows adjusting the delay or lead of signals. The value of the phase - wave status parameter (which is close in meaning to the trigonometric phase or the angle of the radius-vector rotation in the trigonometric p
Pan PrizMA
Aleksey Panfilov
The indicator builds a moving line based on interpolation by a polynomial of 1-4 powers and/or a function consisting of a sum of 1-5 sine curves. Various combinations are possible, for example, a sum of three sine curves about a second order parabola. The resulting line can be extrapolated by any of the specified functions and for various distances both as a single point at each indicator step (unchangeable line), and as a specified (re-painted) function segment for visualization. More details:
The Expert Advisor and the video are attached in the Discussion tab . The robot applies only one order and strictly follows the signals to evaluate the indicator efficiency. Pan PrizMA CD Phase is an option based on the Pan PrizMA indicator. Details (in Russian). Averaging by a quadric-quartic polynomial increases the smoothness of lines, adds momentum and rhythm. Extrapolation by the sinusoid function near a constant allows adjusting the delay or lead of signals. The value of the phase - wave s
Filtro:
Sem comentários
Responder ao comentário
Versão 1.3 2020.03.31
Обновление по текущей версии терминала.
Versão 1.2 2017.03.06
Re-written in a new style.
Versão 1.1 2016.10.12
Added translation to external variables.
Added correction of the entry point to sufficient.
Changed the default values.
And now I am ready to tell about another option of the indicator.