VolumeDeltaM1 MT5
- Indicadores
- Stanislav Korotky
- Versão: 1.7
- Atualizado: 4 fevereiro 2021
- Ativações: 5
This indicator provides the analysis of tick volume deltas. It monitors up and down ticks and sums them up as separate volumes for buys and sells, as well as their delta volumes. In addition, it displays volumes by price clusters (cells) within a specified period of bars. This indicator is similar to VolumeDeltaMT5, which uses almost the same algorithms but does not process ticks and therefore cannot work on M1. This is the reason for VolumeDeltaM1 to exist. On the other hand, VolumeDeltaMT5 can show its signals on the history because it reads M1 volumes for calculations on higher timeframes, while VolumeDeltaM1 collects "tick" statistics on M1 online and can show signals only for the periods when the indicator was online and saved live data to special files (one file per day).
The indicator can work on any higher timeframe, by reading the data collected on M1. This mode only reads the file. To store new ticks to a file, it is still necessary to have an instance of the indicator on M1.
This is a limited substitution of market delta analysis based on real volumes, which are not available on Forex.
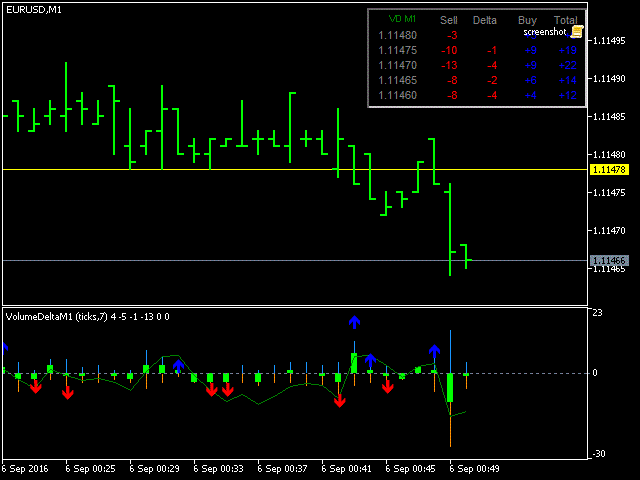
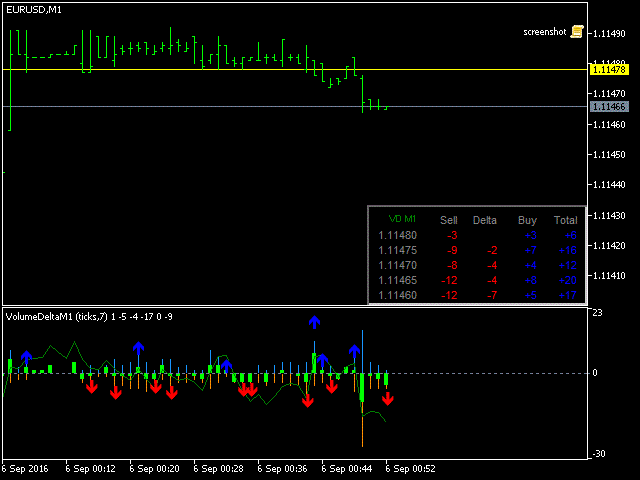
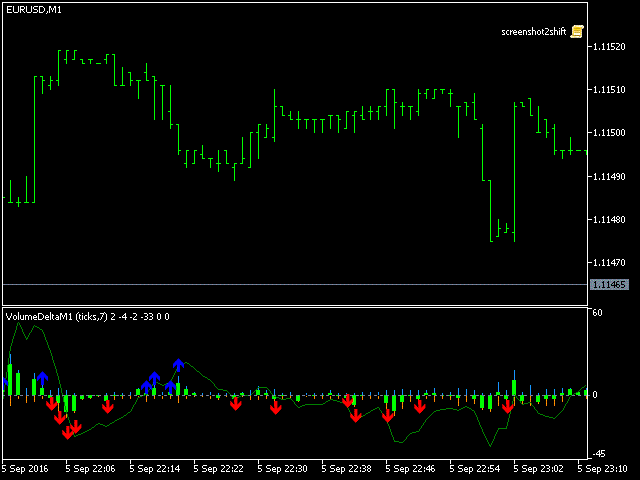
The indicator displays the following data in its sub-window:
- light-blue histogram - buy (long) volumes;
- orange histogram - sell (short) volumes;
- light green histogram - delta between buys and sells;
- green line - cumulative delta, EMA of delta; its values are multiplied by CumulativePeriod for scale adjustment - this makes it approximately the same size as the histograms;
- blue and red arrows - mark those bars where volume direction contradicts price direction, that may be considered as a short-term signal for the next bar;
Also, the indicator displays a table of split volumes for the last CumulativePeriod bar in the main window. The table rows correspond to price clusters. The table contains the following columns:
- price (a range of prices from specified value up to the next range);
- sell volume;
- delta of buy and sell volumes (positives are blue, negatives are red);
- buy volume;
- total volume (cells with values near the maximum one are highlighted in green).
Parameters
- FileNamePrefix - name prefix of the file with ticks statistics; file name has the following structure: VDM1[T|P]-Prefix-Symbol-YYYYMMDD.csv; default - none, empty prefix; T or P denotes the Mode used (see below);
- Mode - ticks, pips, real_volumes; in ticks mode, only the number of price changes is used; in pips mode, the size of every price change in pips is taken into account; real_volumes takes real volumes into account (if they are provided); default - ticks;
- TesterReadOnlineData - default - false - means that the indicator works in tester similar to online mode; if set to true, the indicator reads data from existing csv files, which should be copied into tester/files folder from the MQL4/Files folder. This mode allows you to view real stats in the tester. NB: 0-th bar is always calculated based on generated ticks, but once it moves to the 1st position, its data is loaded from the file;
- PointsPerCell - number of points forming a single price cluster; every cluster is shown as a row in a table with split volumes (this is a kind of "Time and Sales" feed); default value - 5;
- CumulativePeriod - period for calculation of cumulative delta by EMA; default - 7;
- ShowTable - show/hide the table with volume clusters; default - false;
- ShowMark - show/hide price marks for clusters with maximal total volume (green) and maximal delta (yellow); default - false;
- ShowAskBidInTable - highlight the table rows that correspond to current Ask and Bid prices; default - false;
- Corner - corner of the main window to display the table; default value - top right corner;
- CellWidth - width of the table cells; default - 40;
- CellHeight - height of the table cells; default - 15;
- ColorBG - table background color; default - black;
- FontSize - table font size; default - 8;
- Method - special selector for ticks categorization method, can be: ask_versus_bid (default) or ask_and_bid. It takes effect for tick volumes only (the parameter Mode should be set to ticks or pips, but not real_volumes). When set to ask_versus_bid, the volumes are considered for buy if Ask price increases, and considered for sell if Bid decreases. However, on some accounts the Bid changes occur more frequently than the Ask changes, which introduces a negative bias. To solve this problem, use ask_and_bid, which analyses the changes in the sum of Ask and Bid.
Supported timeframes: M1 (full-function mode), M5 and higher (reading data from M1).


