• Visão global
  • Comentários (15)
  • Discussão (102)
  • O que há de novo

ZigZag Lines MTF

4.38
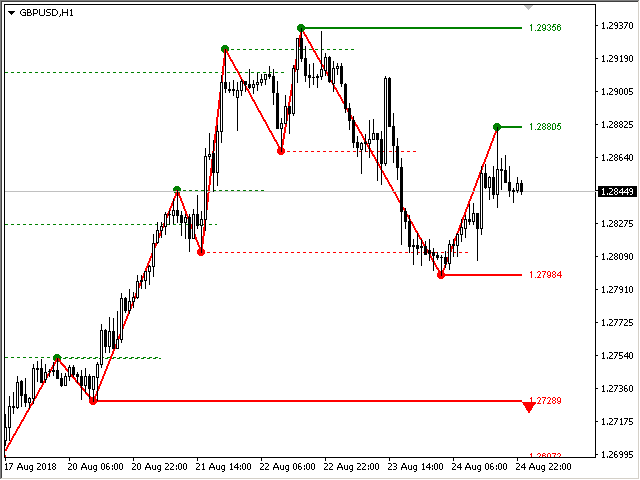
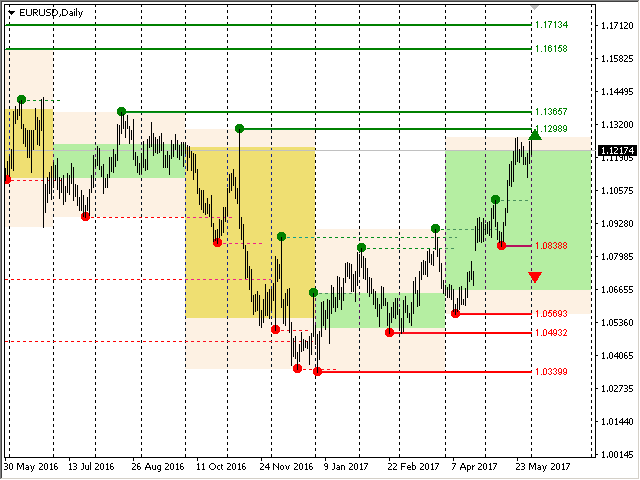
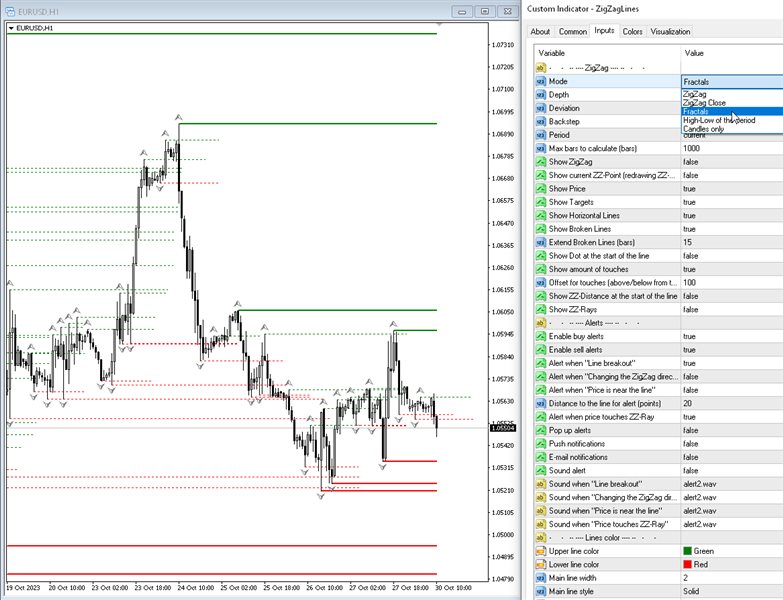
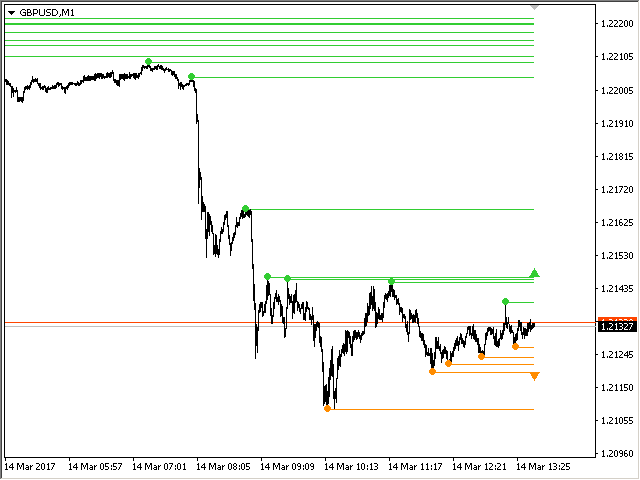
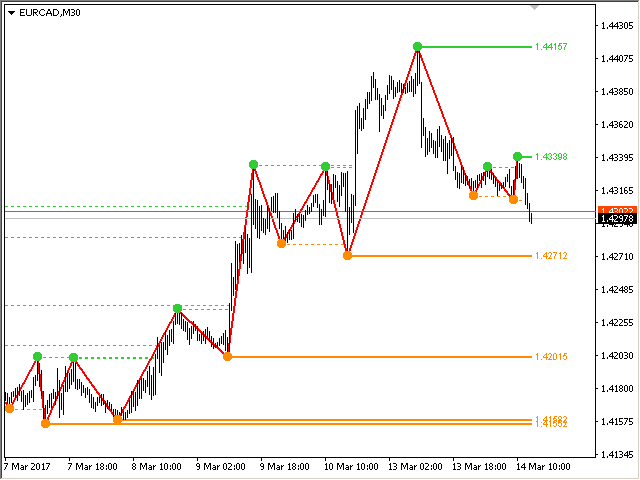
Indicador ZigZag de vários períodos de tempo. Ele exibe as linhas horizontais de suporte/resistência e seus rompimentos, bem como desenha as metas atuais do mercado. Também pode exibir linhas do indicador Fractais e velas de outros períodos (até Trimestral).

O indicador redesenha o último ponto (atual) e, em alguns casos, pode alterar os últimos 2-3 pontos.

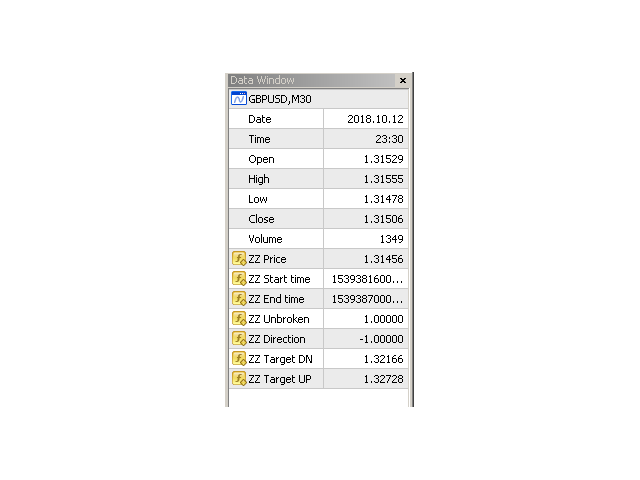
Todas as linhas são desenhadas como objetos (não buffers de indicadores, mas existe a possibilidade de receber os dados para o EA).
Quando usado em um Expert Advisor, você pode ler pontos ZigZag usando iCustom.

Configurações

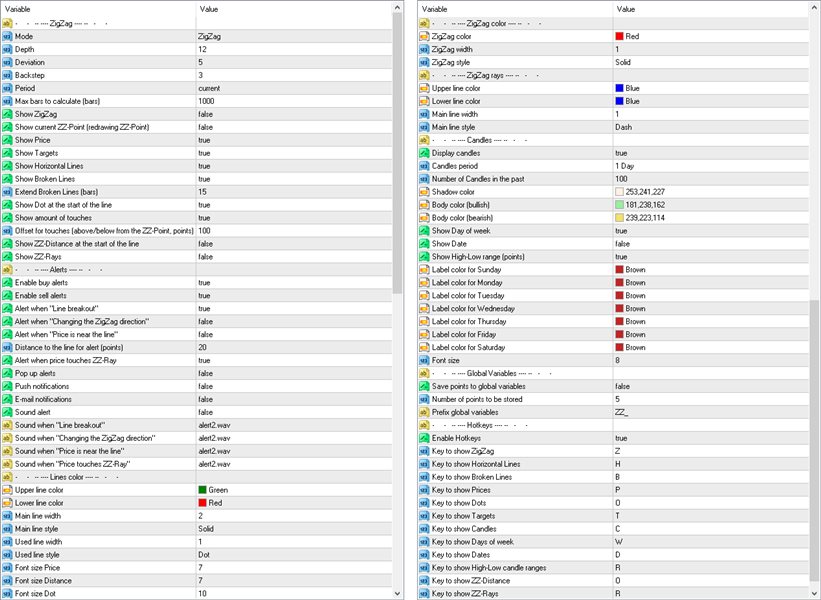
Mode — desenhe níveis de suporte e resistência com base em:
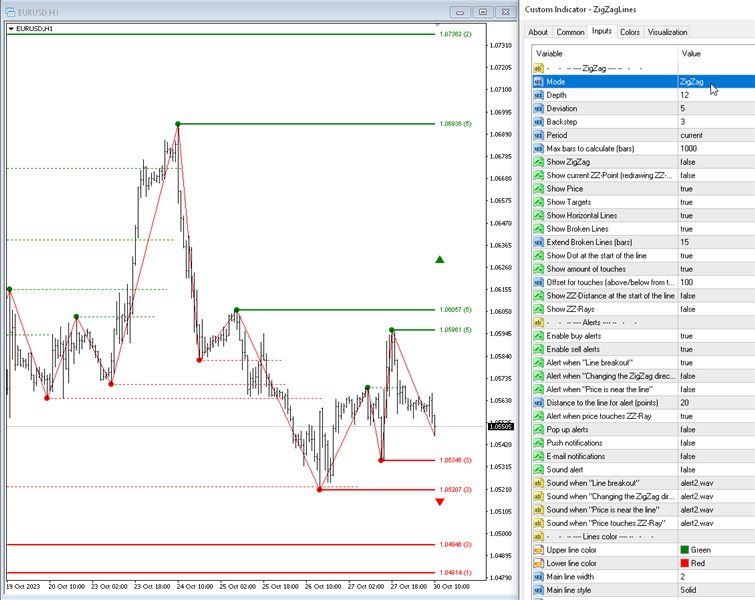
—  Zig Zag — o indicador ZigZag;
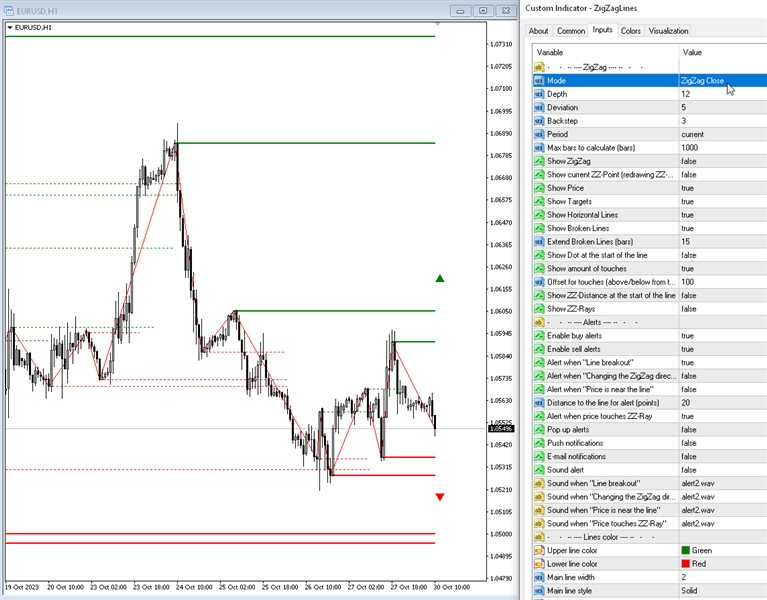
—  ZigZag Close — o indicador ZigZag Close;
—  Fractals — o indicador Fractais;
—  High-Low of the period — construção de um indicador por níveis high-low. O prazo é especificado no parâmetro Período;
—  Candles only — desenhe apenas velas;
Depth — número mínimo de velas, para as quais o Zigzag não sorteará o segundo máximo (ou mínimo), se o último for Desvio menor (ou maior) que o anterior;
Deviation — o número mínimo de pontos entre os Máximos/Mínimos de duas velas adjacentes para que o Ziguezague forme um topo/fundo local;
Backstep — o número mínimo de velas entre os máximos/mínimos locais;
Period — período para cálculo do ZigZag de Fractais;
Max bars to calculate (bars) — o número máximo de barras para cálculo. Esta limitação é introduzida para agilizar os cálculos;

Exibir no gráfico

Show Zigzag — mostra o Ziguezague;
Show current ZZ-point (redrawing point) — mostrar ponto atual (último);
Show Price — mostra o preço dos níveis;
Show Targets — mostra as metas atuais (para onde o mercado está indo);
Show broken lines) — mostra os níveis quebrados;

Check the breakout of the Lines by price — Confira o desdobramento das Linhas por preço:
  • High-Low (current bar) — Alto-Baixo (barra atual)
  • High-Low (previous bar) — Alto-baixo (barra anterior)
  • Close (previous bar) — Fechar (barra anterior)
  • Open (current bar) — Aberto (barra atual)
Extend broken lines (bars) — estende as linhas quebradas para a direita pelo número especificado de barras;
Show Dot at the start of the line — exibe pontos nos pontos de viragem do indicador;
Show amount of touches — mostra a quantidade de toques próximo ao preço da linha;
Offset for touches (above/below from the ZZ-point, points) — a faixa na qual o ponto ZZ será considerado como tocando o nível.

Alertas

Pop up alerts — alerta pop-up ao tocar em um nível;
Push notifications — Notificação push;
E-mail notifications — notificação por e-mail;
Sound alert — alerta sonoro ao tocar em um nível;
Alert when "Line breakout" — alerta quando o nível do ZigZag for rompido;
Alert when "Changing the ZigZag direction" — alerta ao mudar a direção do ZigZag;
Alert when "Price is near the line" — alerta se o preço estiver próximo do nível (uma vez na barra, o ponto atual do ZigZag não é verificado);
Distance to the line for alert (points) — distância para alerta (em pontos);

Cores

Upper line color — cor das linhas superiores;
Lower line color — cor das linhas inferiores;
Main line width — largura da linha principal;
Main line style — estilo da linha principal;
Used line width — largura da linha usada;
Used line style — estilo da linha usada;
Font size price — tamanho da fonte dos Preços;
Font size dot — tamanho da fonte dos pontos;
ZigZag color — cor do ZigZagа;
ZigZag width — largura das linhas ZigZag;
ZigZag style — estilo das linhas ZigZag;

Velas

Display candles — habilita a exibição de velas de outros períodos;
Candles period — período das velas, todas padrão mais Trimestral;
Number of Candles in the past — o número de velas no gráfico;
Shadow color — vela dos pavios da vela;
Body color (bullish) — vela do corpo de uma vela de alta;
Body color (bearish) — cor do corpo de uma vela de baixa;
Save points to global variables — armazena pontos nas Variáveis Globais do terminal;
Number of points to be stored — número de pontos a serem armazenados (o ponto atual é zero);
Prefix global variables — prefixo para nomes de variáveis globais.


Comentários 15
Max
1328
Max 2024.10.06 12:36 
 

This is a brilliant indicator with a huge versatility in specific options. It can draw zigzag from a higher time frame and candles from a higher timeframe, whilst showing levels from the zigzag (or fractals etc.) Colours and so on can be individually specified to give what you need and keep a clean chart. It has too many uses to go into details but an invaluable tool if you use zigzag, candles or liquidity levels. Taras is helpful and skilled, he was able to update to show candles only closed of htf, which I suggested, in a few hours. Look at his other items too!

Nicolas Dobrovsky
804
Nicolas Dobrovsky 2024.08.11 09:46 
 

Truly one of the best indicators you can find for finding liquidity. Great support.

John Mlay
181
John Mlay 2024.03.26 21:26 
 

Good support

Produtos recomendados
Introduction to Smart Renko The main characteristics of Renko Charting concern price movement. To give you some idea on its working principle, Renko chart is constructed by placing a brick over or below when the price make the movement beyond a predefined range, called brick height. Therefore, naturally one can see clear price movement with less noise than other charting type. Renko charting can provide much clearer trend direction and it helps to identify important support and resistance level
Power Renko is an indicator which plots Renko bricks underneath the chart using a histogram. You can select the brick size and the timeframe of the Renko bricks as well as whether or not to use the close price or the high/low price of the candles. Renko bricks are based on price alone, not time, therefor the Renko bricks will not be aligned with the chart's time. They are extremely useful for trend trading and many different strategies can be formed from them. Buffers are provided allowing you t
Median Renko Terminator works best with renko charts if you do not have a renko chart generator I will email it to you for free and give you the correct settings for scalping or to swing trade NON-REPAINT  COMES WITH ALERTS WHEN THERE IS A SIGNAL Conditions to sell: big purple arrow shows you the direction first then you take the small purple arrow to enter the same direction of the purple arrow. Conditions to buy: big white arrow shows you the up direction first then you take small white arrow
The indicator displays Renko bars on the chart, uses their data to calculate and display the moving average, PriceChannel and generates buy/sell signals. Renko is a non-trivial price display method. Instead of displaying each bar within a time interval, only the bars where the price moved a certain number of points are shown. Renko bars do not depend on a time interval, therefore the indicator works on any timeframe without losing its efficiency. The PriceChannel indicator displays the upper, lo
Identify Take
Oleksii Ferbei
4.5 (2)
Identify Take - trend trading strategy, market noise filtering and all necessary functions built into one tool! The system itself shows in the form of arrows when to buy and when to sell. Uses only one setting parameter. Simple, visual and effective trend detection. The intelligent algorithm of the Identify Take indicator shows the points of a potential market reversal. Most often, a good trend can be seen visually on the price chart. But an experienced trader must clearly understand the curr
The Bullish and Bearish Engulfing Pattern Screener for MetaTrader 4 is a powerful tool designed for traders looking to identify key reversal patterns in the financial markets. This indicator scans price charts for bullish and bearish engulfing patterns, which signal potential trend reversals. Key Features: Real-time Scanning : Continuously analyzes price data to provide instant alerts when engulfing patterns are detected. Customizable Settings : Allows users to adjust parameters to fit their tra
FREE
Holy Renko PRO
Bianca Seara
3.5 (2)
About  Holy Renko is a trend identifier capable of identify small and long market movements. This indicator should be use in Renko Charts. VIDEO (information and tips) [HERE] How to install Renko Charts [HERE] Features Developed for Renko Charts Easy to analyze Fast signals Not repaint (when candle close)  Statistics panel Filters false signals Alerts, emails and push notifications  Advantages of Renko Chart Easy to install Easy to analyze Filter out the noise of wicks  Easy i
Rira Renko
Vitor Palmeira Abbehusen
RENKO on Time Chart This indicator is an enhanced Renko, so you can watch the Renko bricks on the chart to understand price movement more clearly the other improvement is automated box size according to ATR (Average True Range) period you can set the ATR number as you want and the box size of Renko changes automatically based on price movement Inputs Mode: Box size is the input to specify the size of the Renko box you want to print on the chart. This input lets you choose the fixed b
This indicator displays the ZigZag Pointer Fibonacci Expansion Triangle movements timeframes only M1-W1. Parameters InDepth: Displays the Depth movements. InDeviation: Displays the Deviation movements. InBackstep: Displays the Backstep movements. Fibonacci Expansion: Displays the Fibonacci Expansion movements. Fibonacci Expansion true.(false) Triangle: Displays the Triangle movements. Triangle true.(false) How to understand the status: If the Triangle is green, trend is up. If the Triangle is
CyberZingFx Volume
Afsal Meerankutty
4.74 (35)
CyberZingFx Volume Indicator is designed to help traders find market reversals with ease. This powerful tool uses a unique strategy that combines both volume and historical price to provide accurate signals for potential market reversals. The indicator displays volume BUY and SELL power values on the right side of the chart for both BUY and SELL. With customizable settings, you can set alerts at different levels to suit your trading style. The most recent alert value is displayed as Alert High,
FREE
The Renko indicator is a technical analysis tool used in the forex market to visualize price movements and trends by eliminating market "noise." Unlike traditional candlestick or bar charts, Renko is built based on price changes of a specified number of points, called the "brick size." When the price moves by this amount of points, a new "brick" is added to the chart. This indicator ignores time and volume, focusing exclusively on price changes. The main features of the Renko indicator include:
This is an indicator for additional signal filtering. It can be used as an additional filter in a trading system. The indicator does not redraw its data and can be used both in forex trading and with binary options. It has 3 operation modes and flexible sensitivity settings. The indicator uses multiple buffers, therefore it can be easily used in various Expert Advisors.
极大的提升了交易感官,一目了然的走势展示,简洁高效。 极大的突出展示了行情的趋势脉络,跟随时间周期适应变化,替用户交易者研判了行情走势,简洁高效 同时我们还提供了主窗口和副窗口的展现,有需要可以联系我作者本人,感谢支持。 像传统的renko,又不是传统的renko,技术在发展,同样的砖图可以有不一样的绘制和计算展现。 希望可以帮到大家的交易,再次感谢。 极大的提升了交易感官,一目了然的走势展示,简洁高效。 极大的突出展示了行情的趋势脉络,跟随时间周期适应变化,替用户交易者研判了行情走势,简洁高效 同时我们还提供了主窗口和副窗口的展现,有需要可以联系我作者本人,感谢支持。 像传统的renko,又不是传统的renko,技术在发展,同样的砖图可以有不一样的绘制和计算展现。 希望可以帮到大家的交易,再次感谢。
Chaos Trader Lite
John Davis
1 (1)
Chaos Trader Lite attempts to use aspects of chaos theory to place trades in the marketplace. This Expert Advisor, in particular, draws upon theories made by Bill Williams. Every version of MetaTrader contains the Bill Williams indicators. I wondered why was he deemed so important as to have his own set of indicators added to MetaTrader with name attribution. Conducting research I found that Bill Williams wrote a book using chaos theory to trade the markets. The Bill Williams indicators are usef
FREE
Velas RENKO
Ramon Sobrevals Arce
Immediately plots renko bars in an external/indicator window.  One of the distinctive advantages Renko charts offer is the fact that they are not time dependent. Therefore, the new Renko blocks are only traced when the price moves higher or lower by the specified number of points.  For example, a 10 pip (100 points) Renko chart would plot the blocks when price moves 10 pips higher in an uptrend or 10 pips lower in a downtrend. Renko charts removes "noises" from the Market and i t helps to ident
Trade Direction
Gevorg Hakobyan
5 (1)
The oscillator shows trend direction using its own algorithm, which is based on calculating price values ​​by analyzing prices of separate currencies (original valuation of currencies). The histogram shows the average value of physical price change over the selected period. When the histogram has a positive value, the trend is rising, if negative - the trend id falling. The indicator uses standard RSI to determine the current market direction on a selected period as follows: the default value of
Bigger chart labels would allow the user to be entirely aware of which chart he/she is on. Each chart window is unique, containing different patterns and economic motives so acknowledging the chart window would be absolutely essential! There are well known Economic Time Zones included in clear view, by choice!    Simple does it! Use your computing mouse scroller, clicking with the right finger on the label, in order to customize the label properties. From there, choose your preferred color, fon
FREE
Market Imbalance
Scott Edward Merritt
4.71 (14)
What Is Market Imbalance? Market Imbalance, also known as "IPA" or Improper Price Action, is when price moves so quick in one direction with no orders on the other side of the market to mitigate the price movement. We all know Big Banks, or "Smart Money", can move the market by placing huge orders which in turn can move price significantly. They can do this because Big Banks are the top 10 Forex traders in the world . But unfortunately, the Big Banks cannot leave these orders in drawdown and mus
The Penta-O is a 6-point retracement harmonacci pattern which usually precedes big market movements. Penta-O patterns can expand and repaint quite a bit. To make things easier this indicator implements a twist: it waits for a donchian breakout in the right direction before signaling the trade. The end result is an otherwise repainting indicator with a very reliable trading signal. The donchian breakout period is entered as an input. [ Installation Guide | Update Guide | Troubleshooting | FAQ | A
MultiFiboDynamicMT4 is a powerful, professional indicator for estimating the most important support and resistance levels. The main advantage is that it plots the Fibonacci levels at all timeframes simultaneously, which allows the trader to see the full picture of the possible price movement of the trading instrument! Advantages of the indicator The indicator is perfect for scalping and trading binary options. Suitable for beginners and experienced traders. Works on all timeframes. Works on an
FREE
MASi Three Screens
Aleksey Terentev
5 (2)
MASi Three Screens is based on the trading strategy by Dr. Alexander Elder. This indicator is a collection of algorithms. Algorithms are based on the analysis of charts of several timeframes. You can apply any of the provided algorithms. List of versions of algorithms:     ThreeScreens v1.0 - A simple implementation, with analysis of the MACD line;     ThreeScreens v1.1 - A simple implementation, with analysis of the MACD histogram;     ThreeScreens v1.2 - Combines the first two algorithms
FREE
Smart ZigZag
Nikolay Likhovid
Smart ZigZag indicator is a ZigZag, for which the market is actually not accidental. This is not mere words, as this can be confirmed by displayed charts comparing Smart ZigZag and HZZ parameters. But before I describe the screenshots, let's examine a few details concerning Smart ZigZag. This indicator analyzes the chart and identifies certain activity horizons assigning numbers to them. This can be called ranking. For example, M1 EURUSD chart from 4.01.1999 to 3.12.2013 has the average segment
Master Scalping M1 é um indicador inovador que usa um algoritmo para determinar a tendência de forma rápida e precisa. O indicador calcula o tempo de abertura e fechamento de posições, os algoritmos do indicador permitem encontrar os momentos ideais para entrar em uma negociação (comprar ou vender um ativo), o que aumenta o sucesso das transações para a maioria dos traders. Benefícios do indicador: Fácil de usar, não sobrecarrega o gráfico com informações desnecessárias. Pode ser usado como filt
Renko Bars 3in1
Yuriy Shatsckiy
5 (2)
The Renko_Bars_3in1 is designed for plotting 3 types of Offline Renko charts. Standard Renko Bar (the reversal bar is twice the size of the bar). Renko Range Bar (the size of all bars is the same). Renko Bars with the ability to adjust the size of the reversal bar. Attention : The demo version for review and testing can be downloaded here . Note . A chart with the M1 period is necessary to build an offline chart. When the indicator is attached to a chart, the offline chart is opened automaticall
Ultimate Renko
Artur Zas
4.62 (13)
Ultimate Renko is a full implementation of a robust Renko style charting solution for MT4. It enables creating custom live charts resembling Median Renko , Mean Renko , Turbo Renko , and Better Renko candles as well as Vanilla Renko and Renko with wicks , PointO charts, and many more. This all-in-one package provides all of the signals needed by day traders, scalpers, and even long-term traders. You can apply all of the standard and custom indicators and technical studies as well as templates to
Renko, Heiken Ashi, Ticks Bar, Range Bar.    Easy switching, easy setup, all in one window.        Place the Custom Chart indicator and view Renko, Heiken Ashi, Tick bar, Range bar charts in real time at real chart.    Position the offline chart window so that the indicator control panel is visible.    Switch the chart mode by click of a button.    Connect to the output chart any indicator, expert advisor without any restrictions.    No, it doesn't work in the tester.    Yes, you can use an
Chaser
Thebo Junior Mahlangu
Introduction  This Indicator Is Based On Average Price/Maximum Price Moves, And Using Moving Bollinger Bands And Moving Averages. The Advantage Of Using It With YOUR own Analysis Will Confirm Potential Supports And Resistances While it Compliments With Your Analysis  The Indicator Is Non-Repainting AND Along With Our Special Trend METRE that Changes With The Conditions OF A Bullish Or Bearish Trend....  Recommend Time-Frames: H1  H4 M15 Usage: The Indicator Is Very Profitable I
FREE
MetaWaves
Stanislav Korotky
This indicator was inspired by М & W Wave Patterns by A. Merrill. 5 extremums or 4 edges of ZigZag are enough to build M or W pattern at arbitrary offset in the history. The classical approach includes a table of predefined figures of ZigZag waves, which can transform into each other under special rules—so that next edge can be forecasted based on these rules. Unlike to this approach, the indicator analyses available history and builds statistics for all M and W patterns, which differ in their c
The indicator displays Renko bars on the chart, uses their data to calculate and display the Bollinger Bands, MACD oscillator and generates buy/sell signals. Renko is a non-trivial price display method, in which a bar within a time interval is shown on the chart only if the price has moved a certain number of points. Renko bars do not depend on a time interval, therefore the indicator works on any timeframe without losing its efficiency. When attached to a chart, the indicator checks for presenc
EMACrossRenko
Hong Ling Mu
1 (1)
<LOGIC> The EMA RENKO EA should run in Renko chart to show the best performance. The EA will entry based on 2 EMA line cross. (it is changeable in parameter.) As a result of FT , the best box size for XAUUSD (GOLD) is BOX 60 to 100.  Renko box size should be larger than spread value. Normally 3 times of spread. Please decide your box size with yourself. The EA will place addtional order as Grid if the trend move  to xxx pips from the last order. You can turn on/off in the parameter. T
Os compradores deste produto também adquirem
Gann Made Easy
Oleg Rodin
4.83 (93)
Gann Made Easy é um sistema de negociação Forex profissional e fácil de usar, baseado nos melhores princípios de negociação usando a teoria do sr. W. D. Gann. O indicador fornece sinais precisos de COMPRA e VENDA, incluindo níveis de Stop Loss e Take Profit. Você pode negociar mesmo em movimento usando notificações PUSH. Entre em contato comigo após a compra! Vou compartilhar minhas dicas de negociação com você e ótimos indicadores de bônus de graça! Provavelmente você já ouviu muitas vezes sobr
Bull versus Bear
Mohamed Hassan
4.71 (7)
Official Release price of $65 for the first 54 /60   copies ( 6  copies left). Next price is $120 !  Send us a message after your purchase to receive more information on how to get your  BONUS  for FREE  that works in great combination with Bull vs Bear ! Bull versus Bear is an easy-to-use Forex indicator that gives traders clear and accurate signals based on clear trend retests . Forget about lagging indicators or staring at charts for hours because  Bull vs Bear provides real-time entries
- Real price is 80$ - 40% Discount ( It is 49$ now ) Contact me for instruction, add group and any questions! Related Products:  Bitcoin Expert , Gold Expert Introduction The breakout and retest strategy is traded support and resistance levels. it involves price breaking through a previous level.  The break and retest strategy is designed to help traders do two main things, the first is to avoid false breakouts. Many false breakouts start with a candlestick that breaks out of a level but ends w
FX Volume
Daniel Stein
4.58 (33)
Receba a sua atualização diária do mercado com detalhes e screenshots através do nosso Morning Briefing aqui no mql5 e no Telegram ! O Volume FX é o PRIMEIRO e ÚNICO indicador de volume que fornece uma visão REAL do sentimento do mercado do ponto de vista de um corretor. Ele fornece uma visão incrível de como os participantes do mercado institucional, como corretores, estão posicionados no mercado Forex, muito mais rápido do que os relatórios COT. Ver essas informações diretamente no seu gráfi
Trend Punch
Mohamed Hassan
4.95 (20)
Halloween Promotion   until Monday 11-04-24  with a 40% discount on the original price!  This indicator is unstoppable when combined with our other indicator called  Support & Resistance . After purchase, send us a message and you will get it   for  FREE as a BONUS! Introducing Trend Punch , the revolutionary forex trend indicator that will transform the way you trade! Trend Punch is uniquely designed to provide precise buy and sell arrows during strong market trends, making your trading d
Gold Stuff
Vasiliy Strukov
4.89 (242)
Gold Stuff-um indicador de tendência projetado especificamente para o ouro, também pode ser usado em qualquer instrumento financeiro. O indicador não é redesenhado ou atrasado. O timeframe recomendado é H1. O EA Gold Stuff Expert Advisor está escrito neste indicador, você pode encontrá-lo no meu perfil. Importante! Entre em contato comigo imediatamente após a compra para obter instruções e bônus!  Você pode obter uma cópia gratuita do nosso indicador Strong Support e Trend Scanner, envie um
FX Power MT4 NG
Daniel Stein
5 (13)
Receba a sua atualização diária do mercado com detalhes e screenshots através do nosso Morning Briefing aqui no mql5 e no Telegram ! O FX Power MT4 NG é a próxima geração do nosso medidor de força de moeda muito popular de longa data, o FX Power. E o que é que este medidor de força da próxima geração oferece? Tudo o que adorou no FX Power original MAIS Análise de força GOLD/XAU Resultados de cálculo ainda mais precisos Períodos de análise configuráveis individualmente Limite de cálculo personal
Trend Screener
STE S.S.COMPANY
4.81 (88)
Indicador de tendência, solução única inovadora para negociação e filtragem de tendências com todos os recursos de tendências importantes construídos dentro de uma ferramenta! É um indicador multi-timeframe e multi-moedas 100% sem repintura que pode ser usado em todos os símbolos/instrumentos: forex, commodities, criptomoedas, índices e ações. OFERTA POR TEMPO LIMITADO: O indicador Support and Resistance Screener está disponível por apenas US$ 50e vitalício. (Preço original US$ 250) (oferta este
Atomic Analyst
Issam Kassas
5 (2)
Primeiramente, vale ressaltar que este Indicador de Negociação não repinta, não redesenha e não apresenta atrasos, tornando-o ideal tanto para negociação manual quanto automatizada. Manual do utilizador: configurações, entradas e estratégia. O Analista Atômico é um Indicador de Ação de Preço PA que utiliza a força e o momentum do preço para encontrar uma vantagem melhor no mercado. Equipado com filtros avançados que ajudam a remover ruídos e sinais falsos, e aumentam o potencial de negociação.
Scalper Inside PRO
Alexey Minkov
4.73 (56)
An exclusive indicator that utilizes an innovative algorithm to swiftly and accurately determine the market trend. The indicator automatically calculates opening, closing, and profit levels, providing detailed trading statistics. With these features, you can choose the most appropriate trading instrument for the current market conditions. Additionally, you can easily integrate your own arrow indicators into Scalper Inside Pro to quickly evaluate their statistics and profitability. Scalper Inside
TPSproTREND PrO
Roman Podpora
4.79 (19)
TPSpro TREND PRO   é um indicador de tendência que analisa automaticamente o mercado e fornece informações sobre a tendência e cada uma de suas mudanças, além de dar sinais para entrar em negociações sem redesenhar! O indicador utiliza cada vela, analisando-as separadamente. referindo-se a diferentes impulsos - impulso para cima ou para baixo. Pontos de entrada exatos em transações de moedas, criptomoedas, metais, ações, índices! Versão MT5                   DESCRIÇÃO COMPLETA DO INDICADOR    
Trend Pulse
Mohamed Hassan
5 (4)
Halloween Promotion   for   24 hours only   with a   40%   discount on the original price!  $̶6̶5̶  $39 ONLY!  Please contact me after purchase to immediately get your PDF strategy + documentation for Trend Pulse !  Introducing Trend Pulse , a unique and robust indicator capable of detecting bullish, bearish, and even ranging trends! Trend Pulse uses a special algorithm to filter out market noise with real precision. If the current symbol is moving sideways, Trend Pulse will send you a
O FX Levels é um indicador de suporte e resistência excecionalmente preciso que funde o método tradicional do Lighthouse com uma abordagem dinâmica inovadora, funcionando sem falhas em todos os símbolos de negociação. Isto inclui pares de moedas, índices, acções ou mercadorias. O FX Levels identifica pontos de inversão e apresenta-os no gráfico, que podem ser utilizados de forma ideal como objectivos de lucro nas suas actividades de negociação. Ao desenvolver o FX Levels, usámos a nossa vasta e
The Stochastic Basket Currency Strenght  brings the Stochastic indicator to a new level.  Expanding the boundaries of TimeFrames and mono-currency analysis, the SBCS take the movements of each currency that composes the cross and confront them in the whole basket of 7 crosses.  The indicator works with any combination of AUD, CAD, CHF, EUR, GBP, JPY, NZD, USD pairs and with full automation takes in account every stochastic value (main line) for the selected Time Frame.  After that, the indicator
Stratos Pali
Michela Russo
5 (1)
Stratos Pali Indicator   is a revolutionary tool designed to enhance your trading strategy by accurately identifying market trends. This sophisticated indicator uses a unique algorithm to generate a complete histogram, which records when the trend is Long or Short. When a trend reversal occurs, an arrow appears, indicating the new direction of the trend. Important Information Revealed Leave a review and contact me via mql5 message to receive My Top 5 set files for Stratos Pali at no cost! D
Reversal-Arrow: Identifique Pontos de Reversão com Precisão e Confiabilidade Reversal-Arrow é um indicador avançado projetado para auxiliar traders de todos os níveis a identificar possíveis pontos de reversão de tendência. Focado em fornecer sinais visuais claros, este indicador ajuda você a entender melhor o contexto do mercado, reduzindo a incerteza e facilitando a tomada de decisões. Reversal-Arrow é otimizado especificamente para os pares XAUUSD e XAUEUR nos períodos de 1 minuto, 5 minutos
TPSpro RFI Levels
Roman Podpora
4.82 (22)
INSTRUÇÕES         Russo   -        ENG       R   ecomendado para uso com um indicador       -       TPSpro   TREND PRO -   Versão MT4         Um elemento-chave na negociação são as zonas ou níveis a partir dos quais as decisões de comprar ou vender um instrumento de negociação são tomadas. Apesar das tentativas dos principais participantes de esconder sua presença no mercado, eles inevitavelmente deixam rastros. Nossa tarefa era aprender como identificar esses rastros e interpretá-los corretame
Dynamic Forex28 Navigator
Bernhard Schweigert
5 (2)
Dynamic Forex28 Navigator - A ferramenta de negociação Forex de última geração. ATUALMENTE 49% DE DESCONTO. Dynamic Forex28 Navigator é a evolução dos nossos indicadores populares de longa data, combinando o poder de três em um: Indicador Advanced Currency Strength28 (695 avaliações) + Advanced Currency IMPULSE com ALERTA (520 avaliações) + Sinais CS28 Combo (Bônus). Detalhes sobre o indicador https://www.mql5.com/en/blogs/post/758844 O que o Next-Generation Strength Indicator oferece?  T
Advanced Supply Demand
Bernhard Schweigert
4.91 (295)
Atualmente com 33% de desconto! A melhor solução para qualquer Trader Novato ou especialista! Este indicador é uma ferramenta de negociação exclusiva, de alta qualidade e acessível porque incorporamos uma série de recursos proprietários e uma nova fórmula. Com esta atualização, você poderá mostrar fusos horários duplos. Você não só será capaz de mostrar um TF mais alto, mas também mostrar ambos, o TF do gráfico, MAIS o TF mais alto: MOSTRANDO ZONAS ANINHADAS. Todos os traders de Oferta e Demanda
Este painel mostra os últimos padrões harmónicos disponíveis para os símbolos seleccionados, pelo que poupará tempo e será mais eficiente / versão MT5 . Indicador gratuito: Basic Harmonic Pattern Colunas do indicador Symbol : aparecem os símbolos seleccionados Trend : de alta ou de baixa Pattern : tipo de padrão (gartley, borboleta, morcego, caranguejo, tubarão, cifra ou ABCD) Entry : preço de entrada SL: preço de paragem de perda TP1: preço do 1º take profit TP2: preço do 2º take profit TP
Currency Strength Exotics
Bernhard Schweigert
4.87 (31)
ACTUALMENTE 20% DE DESCONTO ! A melhor solução para qualquer novato ou comerciante especializado! Este Indicador é especializado para mostrar a força da moeda para quaisquer símbolos como Pares Exóticos de Commodities, Índices ou Futuros. É o primeiro do seu género, qualquer símbolo pode ser adicionado à 9ª linha para mostrar a verdadeira força da moeda de Ouro, Prata, Petróleo, DAX, US30, MXN, TRY, CNH etc. Esta é uma ferramenta de negociação única, de alta qualidade e acessível, porque in
Apresentando       Quantum Trend Sniper Indicator   , o inovador Indicador MQL5 que está transformando a maneira como você identifica e negocia as reversões de tendência! Desenvolvido por uma equipe de traders experientes com experiência comercial de mais de 13 anos,       Indicador de Atirador de Tendência Quântica       foi projetado para impulsionar sua jornada de negociação a novos patamares com sua forma inovadora de identificar reversões de tendência com precisão extremamente alta. ***C
Actualmente 20% OFF ! A melhor solução para qualquer novato ou comerciante especializado! Este software de painel de instrumentos está a funcionar em 28 pares de moedas. É baseado em 2 dos nossos principais indicadores (Advanced Currency Strength 28 e Advanced Currency Impulse). Dá uma grande visão geral de todo o mercado Forex. Mostra valores avançados de força da moeda, velocidade de movimento da moeda e sinais para 28 pares de divisas em todos os (9) períodos de tempo. Imagine como a sua
Antes de tudo, vale ressaltar que esta Ferramenta de Negociação é um Indicador Não Repintante, Não Redesenhante e Não Atrasado, o que a torna ideal para negociação profissional. Curso online, manual do utilizador e demonstração. O Indicador de Conceitos de Ação de Preço Inteligente é uma ferramenta muito poderosa tanto para traders novos quanto experientes. Ele combina mais de 20 indicadores úteis em um único, combinando ideias avançadas de negociação como Análise do Trader do Círculo Interno e
Deixe um comentário após a compra para receber 4 indicadores de alta qualidade como bônus. O indicador Chart Patterns All-in-One ajuda os traders a visualizar vários padrões gráficos comumente usados na análise técnica. Este indicador auxilia na identificação de comportamentos potenciais do mercado, mas não garante rentabilidade. Recomenda-se testar o indicador no modo demo antes de comprar. Oferta atual : Desconto de 50% no indicador "Chart Patterns All in One". Padrões incluídos : Padrão 1-2-3
ACTUALMENTE 31% DE DESCONTO!! A melhor solução para qualquer novato ou comerciante especializado! Este indicador é uma ferramenta comercial única, de alta qualidade e acessível, porque incorporámos uma série de características proprietárias e uma fórmula secreta. Com apenas UM gráfico, dá alertas para todos os 28 pares de moedas. Imagine como a sua negociação irá melhorar porque é capaz de identificar o ponto exacto de desencadeamento de uma nova tendência ou oportunidade de escalada! Con
Enigmera
Ivan Stefanov
5 (3)
ENIGMERA: O núcleo do mercado https://www.enigmera.com Introdução Este indicador e sistema de negociação é uma abordagem notável aos mercados financeiros. ENIGMERA utiliza os ciclos fractais para calcular com precisão os níveis de suporte e resistência. Mostra a autêntica fase de acumulação e dá direcções e objectivos.  Um sistema que funciona quer estejamos numa tendência ou numa correção.  Como é que funciona? O ENIGMERA é composto por três linhas: a linha de suporte/resistência, a linha
LEIA AS INFORMAÇÕES ABAIXO ANTES DE COMPRAR O PRODUTO! Apollo Pips PLUS SP é um produto único! É PARA QUEM QUER ADQUIRIR MEU NOVO INDICADOR "APOLLO PIPS" MAIS BÔNUS "SUPER PACK" COM ACESSO A TODOS OS MEUS INDICADORES DE NEGOCIAÇÃO! Ao adquirir o produto Apollo Pips PLUS SP você está na verdade adquirindo uma versão absolutamente nova do meu indicador Apollo Pips. Esta versão do indicador possui um algoritmo aprimorado e um parâmetro fácil de usar que lhe dá a oportunidade de usar o indicador em
Scalper Vault
Oleg Rodin
5 (27)
Scalper Vault é um sistema profissional de escalpelamento que fornece tudo o que você precisa para um escalpelamento bem-sucedido. Este indicador é um sistema de negociação completo que pode ser usado por comerciantes de forex e opções binárias. O período de tempo recomendado é M5. O sistema fornece sinais de seta precisos na direção da tendência. Ele também fornece sinais superiores e inferiores e níveis de mercado Gann. Os indicadores fornecem todos os tipos de alertas, incluindo notificações
Master Pullback
TDINVEST LLP
5 (3)
- 50% OFF - Telegram group : https://t.me/+5RIceImV_OJmNDA0 MT5 version : https://www.mql5.com/en/market/product/85917?source=Site+Market+Product+Page Master Pullback is a complete system that gives unique trading opportunities and a clear indication of the market: trend, signals as well as stop loss and take profit levels. This system has been designed to be as simple as possible and detects extreme overbought and oversold zones, support and resistance levels, as well as the major trend. You
Mais do autor
ZigZag Lines MTF for MT5
Taras Slobodyanik
5 (10)
Indicador ZigZag de vários períodos de tempo. Ele exibe as linhas horizontais de suporte/resistência e seus rompimentos, bem como desenha as metas atuais do mercado. Também pode exibir linhas do indicador Fractais e velas de outros períodos (até Trimestral). O indicador redesenha o último ponto (atual) e, em alguns casos, pode alterar os últimos 2-3 pontos. Todas as linhas são desenhadas como objetos (não buffers de indicadores, mas existe a possibilidade de receber os dados para o EA). Qua
ZigZag Dashboard for MT4
Taras Slobodyanik
4.75 (4)
Modificação multimoeda e multitimeframe do indicador ZigZag. Exibe a direção atual do mercado, a altura do último movimento, o número de barras neste movimento e a quebra do ponto anterior do ZigZag (linha horizontal). Este é o scanner MTF. Você pode especificar quaisquer moedas e prazos desejados nos parâmetros. Além disso, o painel pode enviar notificações quando o ZigZag mudar de direção ou quando houver um rompimento do ponto anterior. Ao clicar em uma célula com ponto final, este símbolo
Modificação multimoeda e multitimeframe do Oscilador Estocástico. Você pode especificar quaisquer moedas e prazos desejados nos parâmetros. O painel exibe os valores atuais e as interseções das linhas — Sinal e Principal (cruzamento estocástico). Além disso, o indicador pode enviar notificações ao cruzar os níveis de sobrecompra e sobrevenda. Ao clicar em uma célula com ponto final, este símbolo e ponto final serão abertos. Este é o scanner MTF. Semelhante ao Medidor de Força da Moeda, o Painel
Symbol Manager for MT5
Taras Slobodyanik
5 (1)
Symbol Manager or Grid Manager, designed to group orders into one position (by symbol and by direction). This utility will be useful to multi-currency traders, who can have multiple orders on several pairs. You will be able to see the total number of lots, the total profit, and set virtual stop loss and virtual take profit. To set a real TP (or SL), you must first set the virtual value, and then enter the command in this cell: "set". If you want to set real TP/SL for all orders at once, then en
Time Scale for MT5
Taras Slobodyanik
4.64 (22)
The indicator draws the time scale on the chart. You can specify the time offset, adjust the size and font to display on the chart ( it is displaying your local time on your chart instead of MT time ). You can also select the desired format for displaying the date and time. You may be interested in my other product , which contains a more advanced version of the Time Scale . Parameters Hours (time shift) — time shift (hours); Minutes (time shift) — time shift (minutes); Show time on mouse — sh
FREE
CCI Dashboard for MT5
Taras Slobodyanik
5 (1)
Modificação multimoeda e multitimeframe do indicador Commodity Channel Index (CCI). Você pode especificar quaisquer moedas e prazos desejados nos parâmetros. Além disso, o painel pode enviar notificações ao cruzar níveis de sobrecompra e sobrevenda. Ao clicar em uma célula com ponto final, este símbolo e ponto final serão abertos. Este é o scanner MTF. A chave para ocultar o painel do gráfico é “D” por padrão. Parâmetros CCI Period — período médio. CCI Applied price — tipo de preço. Cle
MACD Dashboard
Taras Slobodyanik
Indicador MACD de múltiplas moedas e vários prazos. O painel pode exibir o MACD tradicional (verdadeiro) e o MACD integrado ao MetaTrader. No painel você pode ver o estado atual do indicador — a direção do movimento das linhas MACD, sua interseção e uma janela pop-up com o gráfico do indicador. Nos parâmetros você pode especificar quaisquer pares de símbolos e prazos desejados. O scanner também pode enviar notificações sobre linhas que se cruzam e sobre linhas que cruzam o nível Zero. Ao clic
Modificação multimoeda e multitimeframe do indicador Bollinger Bands. No painel você pode ver os rompimentos e toques das Bandas de Bollinger. Nos parâmetros você pode especificar quaisquer moedas e prazos desejados. O indicador também pode enviar notificações quando o preço toca as Bandas de Bollinger, quando a volatilidade atual muda (expande ou cai) e quando o preço toca todas as bandas. Ao clicar em uma célula com ponto final, este símbolo e ponto final serão abertos. Este é o scanner MTF.
Gann Square of 144
Taras Slobodyanik
5 (5)
A Gann Box (ou Gann Square) é um método de análise de mercado baseado no artigo "Fórmula matemática para previsões de mercado" de WD Gann. Este indicador pode representar três modelos de Quadrados: 90, 52(104), 144. Existem seis variantes de grades e duas variantes de arcos. Você pode plotar vários quadrados em um gráfico simultaneamente. Parâmetros Square — seleção de um modelo quadrado: 90 — quadrado de 90 (ou quadrado de nove); 52 (104) — quadrado de 52 (ou 104); 144 — quadrado universal
MA Dashboard MT5
Taras Slobodyanik
5 (4)
Modificação multimoeda e multitimeframe do indicador Moving Average (MA). No painel você pode ver o estado atual do indicador - rompimentos e toques (por preço) do MA Rápido e MA Lento, bem como a intersecção das linhas MA entre si (cruzamento da média móvel). Nos parâmetros você pode especificar quaisquer moedas e prazos desejados. Além disso, o indicador pode enviar notificações sobre o preço tocando as linhas e sobre o seu cruzamento. Ao clicar em uma célula com ponto final, este símbolo e p
Modificação multimoeda e multitimeframe do indicador Índice de Força Relativa (RSI). Você pode especificar quaisquer moedas e prazos desejados nos parâmetros. Além disso, o painel pode enviar notificações ao cruzar níveis de sobrecompra e sobrevenda. Ao clicar em uma célula com ponto final, este símbolo e ponto final serão abertos. Este é o scanner MTF. A chave para ocultar o painel do gráfico é “D” por padrão. Semelhante ao Medidor de Força da Moeda, o Painel pode selecionar automaticament
Indicador de múltiplas moedas e multiprazos Inside Bar (IB). Nos parâmetros, você pode especificar quaisquer moedas e prazos desejados. O painel exibe o último padrão da barra interna (e da barra mãe) encontrado, a posição atual do preço e o rompimento dos níveis das barras mãe e interna. Você pode definir o tamanho e a cor das barras e do texto nas células. O indicador também pode enviar notificações quando os níveis são quebrados. Ao clicar em uma célula com ponto final, o símbolo e ponto fin
Indicador Heikin Ashi multimoeda e multitimeframe. Mostra o estado atual do mercado. No painel do scanner você pode ver a direção, força e número de barras da tendência atual. As velas de Consolidação/Reversão também são mostradas em cores. Você pode especificar quaisquer moedas e períodos desejados nos parâmetros. Além disso, o indicador pode enviar notificações quando a tendência muda ou quando velas de reversão e consolidação (dojis) aparecem. Ao clicar em uma célula, este símbolo e ponto fi
ADX Dashboard MT5
Taras Slobodyanik
5 (4)
O indicador ADX é usado para determinar a tendência e sua força. A direção do preço é mostrada pelos valores +DI e -DI, e o valor ADX mostra a força da tendência. Se +DI estiver acima de -DI, então o mercado está em tendência de alta, se ao contrário, está em tendência de baixa. Se o ADX estiver abaixo de 20, não há uma direção definida. Assim que o indicador ultrapassa este nível, começa uma tendência de força média. Valores acima de 40 indicam uma tendência forte (tendência de baixa ou tendên
Heikin Ashi Dashboard
Taras Slobodyanik
5 (4)
Indicador Heikin Ashi multimoeda e multitimeframe. Mostra o estado atual do mercado. No painel do scanner você pode ver a direção, força e número de barras da tendência atual. As velas de Consolidação/Reversão também são mostradas em cores. Você pode especificar quaisquer moedas e períodos desejados nos parâmetros. Além disso, o indicador pode enviar notificações quando a tendência muda ou quando velas de reversão e consolidação (dojis) aparecem. Ao clicar em uma célula, este símbolo e ponto fi
Modificação multimoeda e multitimeframe do Oscilador Estocástico. Você pode especificar quaisquer moedas e prazos desejados nos parâmetros. O painel exibe os valores atuais e as interseções das linhas — Sinal e Principal (cruzamento estocástico). Além disso, o indicador pode enviar notificações ao cruzar os níveis de sobrecompra e sobrevenda. Ao clicar em uma célula com ponto final, este símbolo e ponto final serão abertos. Este é o scanner MTF. Semelhante ao Medidor de Força da Moeda, o Painel
Fractals Dashboard MT5
Taras Slobodyanik
5 (3)
Modificação multimoeda e multitimeframe do indicador Fractals. Exibe os dois últimos fractais — sua sequência (e qual está quebrada) ou a distância entre eles. Você pode especificar quaisquer moedas e prazos desejados nos parâmetros. Além disso, o painel pode enviar notificações sobre o rompimento de um fractal. Ao clicar em uma célula com ponto final, este símbolo e ponto final serão abertos. Este é o scanner MTF. A chave para ocultar o painel do gráfico é “D” por padrão. Parâmetros Cal
Lines Profit Loss MT5
Taras Slobodyanik
4.58 (12)
O indicador exibe lucro (perda) no símbolo atual. Você pode arrastar e soltar livremente a linha para exibir o lucro ou perda atual. Parâmetros Calculation in money or in points — calcule o lucro/perda em pontos ou dinheiro. Add pending orders to calculate — leve em consideração os pedidos pendentes nos cálculos. Magic Number (0 - all orders on symbol) — número mágico, caso seja necessário avaliar pedidos específicos. Offset for first drawing (points from the average price) — deslocamento
FREE
Modificação multimoeda e multitimeframe do indicador Índice de Força Relativa (RSI). Você pode especificar quaisquer moedas e prazos desejados nos parâmetros. Além disso, o painel pode enviar notificações ao cruzar níveis de sobrecompra e sobrevenda. Ao clicar em uma célula com ponto final, este símbolo e ponto final serão abertos. Este é o scanner MTF. A chave para ocultar o painel do gráfico é “D” por padrão. Semelhante ao Medidor de Força da Moeda, o Painel pode selecionar automaticament
ADX Dashboard
Taras Slobodyanik
5 (3)
O indicador ADX é usado para determinar a tendência e sua força. A direção do preço é mostrada pelos valores +DI e -DI, e o valor ADX mostra a força da tendência. Se +DI estiver acima de -DI, então o mercado está em tendência de alta, se ao contrário, está em tendência de baixa. Se o ADX estiver abaixo de 20, não há uma direção definida. Assim que o indicador ultrapassa este nível, começa uma tendência de força média. Valores acima de 40 indicam uma tendência forte (tendência de baixa ou tendên
Pro Sessions MT4
Taras Slobodyanik
4.67 (3)
Este é um indicador de pregões que pode exibir todos os níveis (Aberto-Alto-Baixo-Fechar) durante quatro sessões. O indicador também pode prever os níveis da sessão. As sessões podem ser desenhadas com linhas ou retângulos (vazios ou preenchidos), as linhas podem ser estendidas para a próxima sessão. Você pode facilmente ocultar/mostrar cada sessão pressionando teclas de atalho (por padrão '1', '2', '3', '4'). Você pode ver linhas ASR (intervalo médio de sessão) (tecla de atalho padrão 'A').
News Dashboard MT4
Taras Slobodyanik
4.43 (7)
Este painel exibe notícias atuais de três fontes: do site ForexFactory.com (calendário FFC), do site Investing.com e do Calendário Econômico de mql5.com. Você pode classificar as notícias por impacto e por país e exibi-las no gráfico com um clique. Ao manter pressionada a tecla 'Ctrl', você pode selecionar várias 'moedas' ou 'impactos' diferentes para classificar. Além disso, este utilitário mostra não apenas a previsão, mas também os valores reais após aparecerem no site. Você pode definir uma
Inside Bar Dashboard
Taras Slobodyanik
5 (2)
Indicador de múltiplas moedas e multiprazos Inside Bar (IB). Nos parâmetros, você pode especificar quaisquer moedas e prazos desejados. O painel exibe o último padrão da barra interna (e da barra mãe) encontrado, a posição atual do preço e o rompimento dos níveis das barras mãe e interna. Você pode definir o tamanho e a cor das barras e do texto nas células. O indicador também pode enviar notificações quando os níveis são quebrados. Ao clicar em uma célula com ponto final, o símbolo e ponto fin
Indicador multimoeda e multitimeframe do Canal de Desvio Padrão. Exibe a direção atual do mercado. No painel você pode ver rompimentos e toques (por preço) dos níveis do canal de regressão linear. Nos parâmetros, você pode especificar quaisquer moedas e prazos desejados. Além disso, o indicador pode enviar notificações quando os níveis são atingidos. Ao clicar em uma célula, este símbolo e ponto final serão abertos. Este é o scanner MTF. A chave para ocultar o painel do gráfico é “D” por padr
Lines Profit Loss
Taras Slobodyanik
4.93 (14)
O indicador exibe lucro (perda) no símbolo atual. Você pode arrastar e soltar livremente a linha para exibir o lucro ou perda atual. Parâmetros Calculation in money or in points — calcule o lucro/perda em pontos ou dinheiro. Add pending orders to calculate — leve em consideração os pedidos pendentes nos cálculos. Magic Number (0 - all orders on symbol) — número mágico, caso seja necessário avaliar pedidos específicos. Offset for first drawing (points from the average price) — deslocamento
FREE
Indicador multimoeda e multitimeframe do Canal de Desvio Padrão. Exibe a direção atual do mercado. No painel você pode ver rompimentos e toques (por preço) dos níveis do canal de regressão linear. Nos parâmetros, você pode especificar quaisquer moedas e prazos desejados. Além disso, o indicador pode enviar notificações quando os níveis são atingidos. Ao clicar em uma célula, este símbolo e ponto final serão abertos. Este é o scanner MTF. A chave para ocultar o painel do gráfico é “D” por padr
Angle Dashboard
Taras Slobodyanik
5 (1)
This is a multicurrency and multitimeframe indicator that calculates the angle between two points. Points for measuring the angle can be taken from the ZigZag (the last two points), or from the Moving Average (between two given bars), or it can be the closing prices of bars. Angle measurement is possible in degrees or in radians. You can select the scale for the calculation. For a better understanding of the indicator, you can study the free Angle High Low indicator. In the parameters you can
Time Scale
Taras Slobodyanik
4.8 (10)
The indicator draws the time scale on the chart. You can specify the time offset, adjust the size and font to display on the chart (it is displaying your local time on your chart instead of MT time). You can also select the desired format for displaying the date and time. While holding down the middle mouse button, and moving the cursor, a slider will appear on the scale. You may be interested in my other product , which contains a more advanced version of the Time Scale. Parameters Hours (tim
FREE
O indicador possui três ferramentas principais: Lupa (gráfico de zoom), Régua (escalas de tempo e preço) e Mira. Você pode mover tudo com o mouse e personalizar diferentes formatos de exibição, personalizar o tamanho e a cor de cada elemento. A Lupa   (gráfico de zoom) permite exibir velas de qualquer período de tempo e em diferentes escalas. Teclas de atalho padrão: 'Q' - período de tempo mais alto, 'A' - período de tempo mais baixo, 'W' - diminui o tamanho da vela, 'S' - aumenta o tamanho d
Modificação multimoeda e multitimeframe do indicador Bollinger Bands. No painel você pode ver os rompimentos e toques das Bandas de Bollinger. Nos parâmetros você pode especificar quaisquer moedas e prazos desejados. O indicador também pode enviar notificações quando o preço toca as Bandas de Bollinger, quando a volatilidade atual muda (expande ou cai) e quando o preço toca todas as bandas. Ao clicar em uma célula com ponto final, este símbolo e ponto final serão abertos. Este é o scanner MTF.
Filtro:
Max
1328
Max 2024.10.06 12:36 
 

This is a brilliant indicator with a huge versatility in specific options. It can draw zigzag from a higher time frame and candles from a higher timeframe, whilst showing levels from the zigzag (or fractals etc.) Colours and so on can be individually specified to give what you need and keep a clean chart. It has too many uses to go into details but an invaluable tool if you use zigzag, candles or liquidity levels. Taras is helpful and skilled, he was able to update to show candles only closed of htf, which I suggested, in a few hours. Look at his other items too!

Nicolas Dobrovsky
804
Nicolas Dobrovsky 2024.08.11 09:46 
 

Truly one of the best indicators you can find for finding liquidity. Great support.

John Mlay
181
John Mlay 2024.03.26 21:26 
 

Good support

GoodMorningg
529
GoodMorningg 2023.08.26 21:22 
 

Лучшие продукты на маркете! Лучшая поддержка от разработчика!

jps40
59
jps40 2022.09.21 02:55 
 

This is a superb indicator - strongly recommend getting it!

Suvashish Halder
38651
Suvashish Halder 2021.09.21 05:48 
 

Very nice indicator. You can find out key levels, Chart by Zigzag and Market moving and Easy to use. Good Job & Thank you.

Miguel Felipe
70
Miguel Felipe 2021.07.02 13:08 
 

Easy 5 Star indicator, i would call it a tool, because its very helpfull. It serves better then its purpose. Easy settings, and a great tool. I will be also get a mt5 version. Congrats!

florica
21
florica 2020.11.24 17:57 
 

money thrown away .... it's not what it looks like in the demo ... I want my money back

Taras Slobodyanik
70855
Resposta do desenvolvedor Taras Slobodyanik 2021.05.03 14:56
Please take the trouble to describe it more specifically. What exactly is wrong? Otherwise, it looks like unfair competition.
Naser
1243
Naser 2020.10.05 12:23 
 

❌❌❌❌❌

Taras Slobodyanik
70855
Resposta do desenvolvedor Taras Slobodyanik 2021.05.03 14:56
Please take the trouble to describe it more specifically. What exactly is wrong? Otherwise, it looks like unfair competition.
varon
493
varon 2020.04.28 12:33 
 

спасибо! замечательный индикатор. рекомендую всем!

3316589p
870
3316589p 2019.04.09 10:44 
 

Great indicator, thank you

Babak Shahabi
1547
Babak Shahabi 2018.08.22 14:25 
 

Nice indicator!

rainwalker123
3385
rainwalker123 2018.03.18 10:49 
 

Very Good Product

PJ CHAWLA
2164
PJ CHAWLA 2017.08.17 17:57 
 

Deserves 5 Stars. Good job.

Ferdinandus Charlie
1174
Ferdinandus Charlie 2017.06.04 16:24 
 

O usuário não deixou nenhum comentário para sua avaliação

Responder ao comentário
Versão 6.2 2024.10.05
1) Added the "Hide current Candle (not closed)" parameter.
Versão 6.0 2024.08.10
1) Fixed a bug in the "Horizontal Lines will become Broken after X bars" function.
Versão 5.9 2024.07.31
1) Fixed the error of finding the end of the line for the "High-Low of the period" mode.
Versão 5.8 2024.07.10
1) Fixed a bug where the line ended incorrectly in some cases.
Versão 5.7 2024.05.20
1) Fixed double number bug.
Versão 5.6 2024.05.20
1) Fixed a bug with alerts for Fractals.
Versão 5.5 2024.03.26
1) Added the parameter 'Horizontal Lines will become Broken after X bars (0-off)'.
Versão 5.4 2024.03.12
1) Added the "Check the breakout of the Lines by price" parameter. Now you can specify the price and bar at which the line breakout will be checked: High-Low (current bar), High-Low (previous bar), Close (previous bar), Open (current bar).
Versão 5.3 2023.09.03
1) Added "Enable buy alerts" and "Enable sell alerts" parameters.
Versão 5.2 2023.08.27
1) Fixed the bug of checking the last bar in the "High-Low of the period" mode.
Versão 5.1 2023.08.27
1) Now the "Show current ZZ-Point" parameter affects the "High-Low of the period" mode. If "Show current ZZ-Point" is disabled, then the indicator will not show the levels of the current candle.
Versão 5.0 2022.11.29
1) Added separate sounds for each alert.
Versão 4.9 2022.11.17
1) The current direction of the candle has been added to the text of the alert about touching ZZ-Ray.
Versão 4.8 2022.11.15
1) Added parameter "Alert when price touches ZZ-Ray".
Versão 4.7 2022.09.04
1) Added parameters for displaying rays on the last ZigZag points ("Show ZZ-Rays").
2) Added hotkey to toggle "Show ZZ-Rays".
3) Line extension bug fixed.
Versão 4.6 2022.08.18
1) Added parameters for displaying the distance between ZigZag points — "Show ZZ-Distance at the start of the line" and "Key to show Distance".
Versão 4.5 2021.11.05
1) Added parameters for displaying the number of times the price touches the ZigZag point. (Show amount of touches, Offset for touches)
Versão 4.4 2021.07.12
1) Added "Hotkeys" parameters. Now you can switch the display of indicator elements by pressing hot keys.
Versão 4.3 2021.05.03
1) For the parameter "Candles" added "Show Day of week", "Show Date" and the ability to specify a color for each day of the week.
Versão 4.2 2021.04.05
1) Added display of the number of points between High and Low (Show range High-Low).
Versão 4.1 2021.03.17
1) Update for the new MT4 build.
Versão 4.0 2020.06.10
1) Recompilation for the new build.
Versão 3.9 2020.04.14
1) Fixed a new bug with displaying dots.
Versão 3.8 2020.04.14
1) Added parameter "Show Horizontal Lines".
Versão 3.7 2019.10.30
1) Code optimization.
Versão 3.6 2019.10.30
1) Fixed copy bug for iCustom function.
Versão 3.5 2019.10.23
1) Added a new mode "High-Low of the period".
2) Code optimization.
Versão 3.4 2019.04.07
1) Added new mode "ZigZag Close".
2) Added alert when the price is near the line.
Versão 3.3 2018.10.28
1) Fixed a bug in the calculation of the time of the end of the line.
Versão 3.2 2018.10.14
Fixed buffer name "ZZ Broken" to "ZZ Unbroken".
Versão 3.1 2018.10.14
1) Added buffer for current Zigzag targets (ZZ Target UP, ZZ Target DN).
Versão 3.0 2018.10.14
1) Added the ability to read points using iCustom. Points are saved sequentially in the indicator buffer.
Versão 2.31 2018.08.28
1) Added the name of the pair, to the prefix of the global variables.
Versão 2.30 2018.08.25
1) Added displaying the current point - "Current ZZ-point (Redrawing point)".
2) Added options for saving points in the Global Variables. Now you can read the coordinates of points using EA.
3) Code optimization.
4) Fixed bug of double fractal.
Versão 2.20 2018.06.01
1) The indicator can now draw levels using Fractals. The "Draw Support & Resistance on the Fractals" parameter.
2) Added the option ti disable dots at the beginning of lines using "Dot at the start of line". Also, there is an option to set the size of these dots using "Font size dot".
3) Now you can run several instances of the indicator in one window.
4) Code optimization.
Versão 2.10 2017.08.16
1) Added option "Add alert when changing the direction of ZigZag"
2) Fixed minor bugs.
Versão 2.0 2017.06.06
1) Added Candles of other periods (up to the Quarter).
2) Small fixes.