Trend Wave
- Indicadores
- Remi Passanello
- Versão: 1.41
- Atualizado: 17 maio 2019
- Ativações: 5
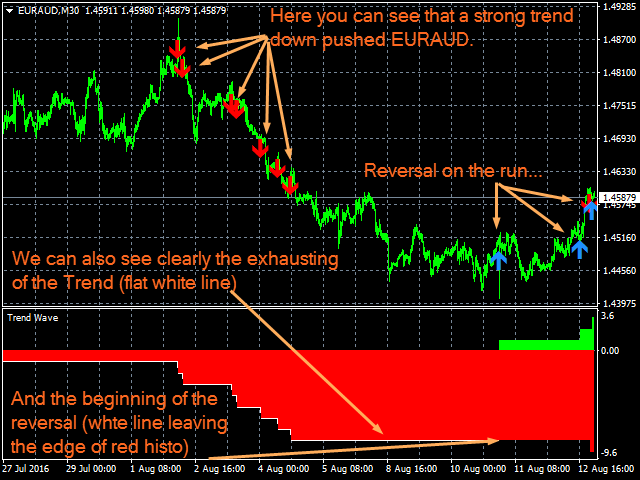
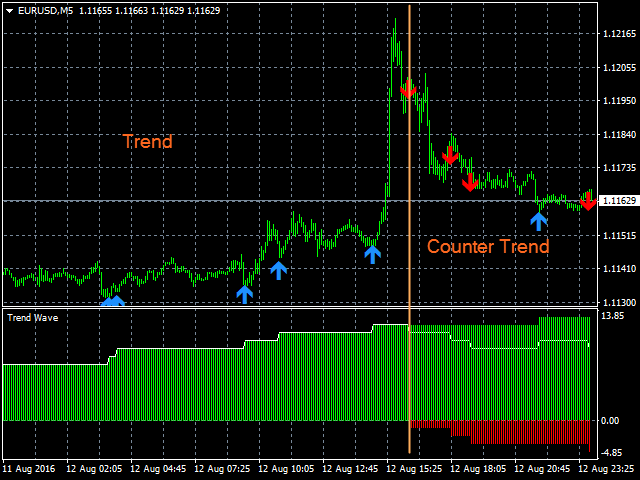
Trend Wave é uma ferramenta de negociação avançada; indicador de tendência e contra-comércio baseado em Suportes e Resistências.
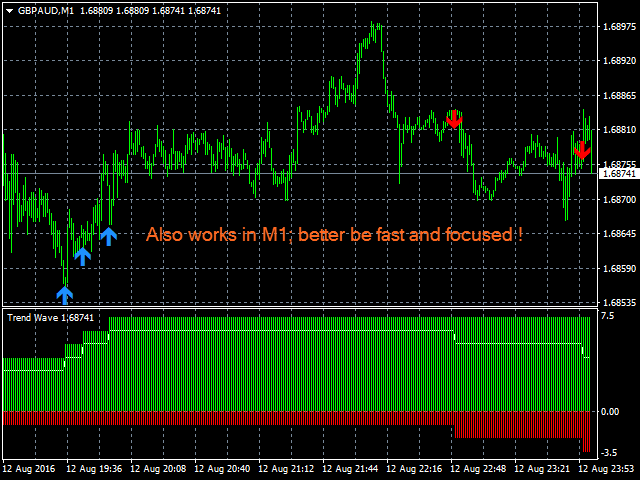
Trend Wave foi projetado para ter uma negociação ativa a qualquer momento
O Trend Wave não está atrasado
As indicações são dadas no início de uma nova vela
A onda de tendência indica
A janela do indicador mostra a contagem real de S e R para obter a tendência geral
A linha branca mostra a tendência instantânea.
Na janela principal do gráfico, setas coloridas são exibidas para mostrar os últimos S e R válidos. Isso também ajuda a ver a tendência.
O Trend Wave funciona
Em qualquer período de tempo
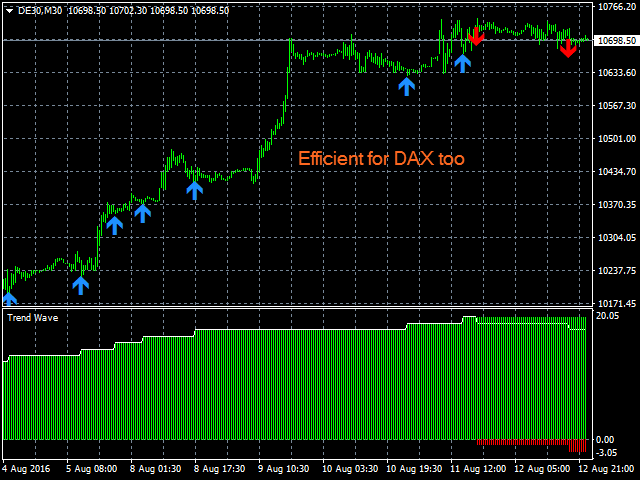
Com qualquer instrumento
Com qualquer corretor
Recursos do Trend Wave
Representação do histograma do R/S ativo
Linha R/S média
R/S com setas coloridas
Indicação de reversão no histograma
Como usar o Trend Wave
Muito fácil de configurar...
Coloque no seu gráfico
Ajustar entradas
Siga a tendência até que uma reversão seja mostrada (a linha branca está saindo da borda da tendência principal)
Bom saber
Não considere as setas coloridas como indicações de "configuração de negociação", pois elas mostram R/S. Você verá que eles desaparecem quando um suporte ou resistência é quebrado, então apenas R ou S ininterruptos permanecerão; esse é o conceito da "onda".
Se você planeja usar setas como indicadores de negociação (o que eu não recomendo), o melhor é usar lotes muito pequenos para cada negociação (risco de 1% é o suficiente)
Entradas (atualizadas para V1.4)
Mostrar setas no gráfico: [bool]
true = Mostra as setas de tendência no gráfico
falso = não aparece
Seta de tendência para cima:[cor] Escolha a cor da seta para cima
Seta de tendência para baixo: [cor] Escolha a cor da seta para baixo
Mostrar histograma: [bool] Mostrará ou ocultará o histograma, a linha branca estará sempre visível
true = mostrar histograma
false= não aparece
Auto Histogram Width: [bool] Habilita ou não a largura do histograma de acordo com o fator de zoom do gráfico
verdadeiro = ativado
false = Desabilitado, largura e cores podem ser ajustadas na aba "cor" da janela de propriedades do indicador
Mostrar resistência e suportes: [bool] Mostrará ou ocultará R&S no gráfico principal
verdadeiro = Mostrar
falso = Ocultar
Mostrar Níveis: [bool] Mostrará ou ocultará os níveis de escala vertical no gráfico principal
verdadeiro = Mostrar
falso = Ocultar
Histórico máximo em dias: [integer] Período histórico para cálculo de níveis em dias
Cor das linhas de nível: [cor] Cor das linhas de nível no gráfico principal
Mostrar reversões: [bool] Mostra reversões no histograma
verdadeiro = Mostrar
falso = Ocultar
Notificações push: [bool] Ativa notificações push
verdadeiro = Ativar
falso = Desativar
Notificações de e-mail: [bool] Ativa as notificações de e-mail
verdadeiro = Ativar
falso = Desativar
Notificações pop-up: [bool] Ativa a janela pop-up (alerta) no gráfico principal Notificações
verdadeiro = Ativar
falso = Desativar
Tampões
TrendLine: Buffer 0 Valor médio da linha branca
Nenhum: Buffer 1 Usado apenas para cálculo
Nenhum: Buffer 2 Usado apenas para cálculo
TrendUp: Histograma verde do buffer 3, contagem de suporte
TrendDn: Histograma Vermelho do Buffer 4, Contagem de Resistências

I bought this indicator from Remi few weeks ago and after a training period where I had to become confident with it I was able to get good trade and repay the cost of the tool in few days of trading. THANK YOU REMI for this masterpiece!