RSI 7TF
- Indicadores
- Yurij Izyumov
- Versão: 1.2
- Atualizado: 26 novembro 2021
This is a multitimeframe RSI indicator defining trends, oversold/overbought zones, as well as all intersections of signal lines from different timeframes on a single chart using arrows and audio alerts.
When working with standard RSI, we often need to examine data from all necessary timeframes simultaneously. RSI 7TF solves this issue. If you are only interested in audio signals when signal lines are crossed, then have a look at RSI Alerts.
Attention! The indicator uses seven timeframes - M5, M15, M30, H1, H4, D1, W1. Make sure that the history for a selected symbol is downloaded. You may simply pass along all timeframes after launching the indicator on a symbol to download missing history.
Operation modes
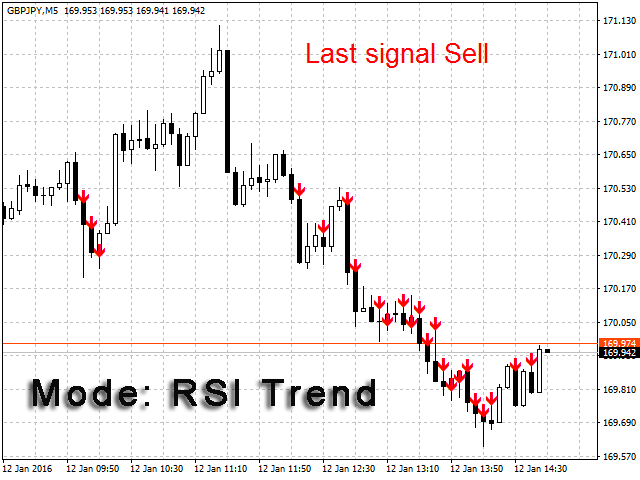
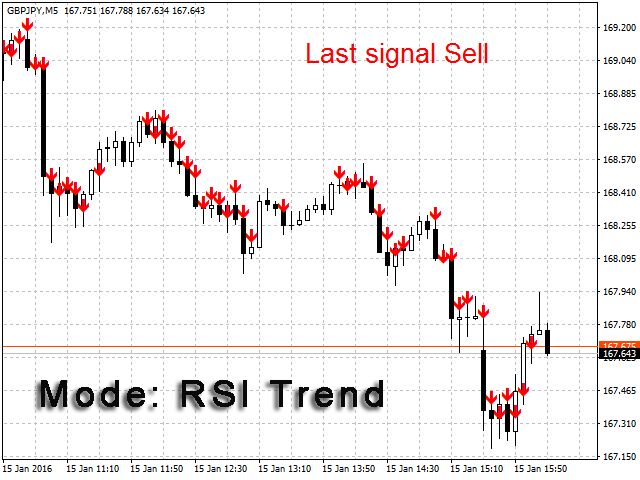
- RSI Trend for 1 bar - trend indicator calculated by RSI for one candle. The value is obtained by summing the directions of all seven timeframes per one candle. If all of them show down, then the trend is bearish, if all of them are up, the trend is bullish.
- RSI Trend for 2 bar - trend indicator calculated by RSI for two candles. The calculation principle is the same, however RSI direction for two candles is used.
- OverSell / OverBuy - mode for defining oversold/overbought levels calculated for all seven timeframes. These mode defines approximate symbol points - reversal or return ones (the price returns to them later).
- Price difference - trend indicator based only on the price movement (candle direction).
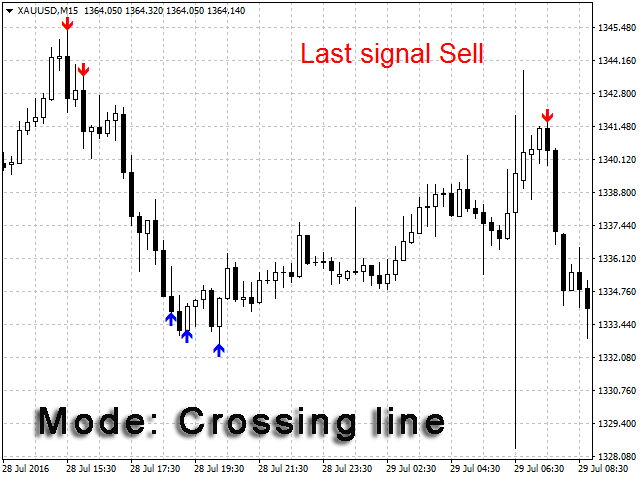
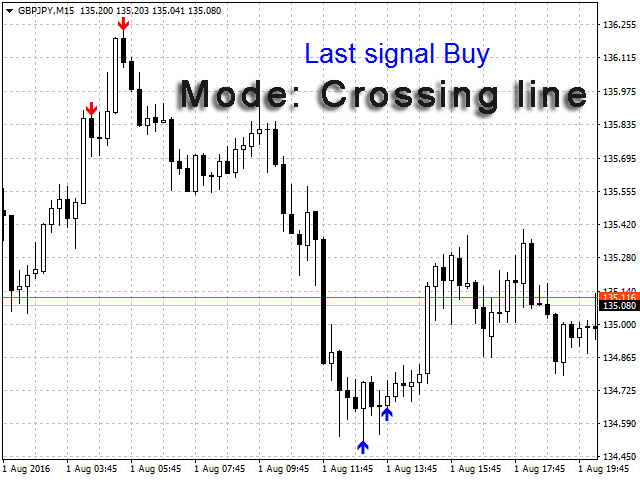
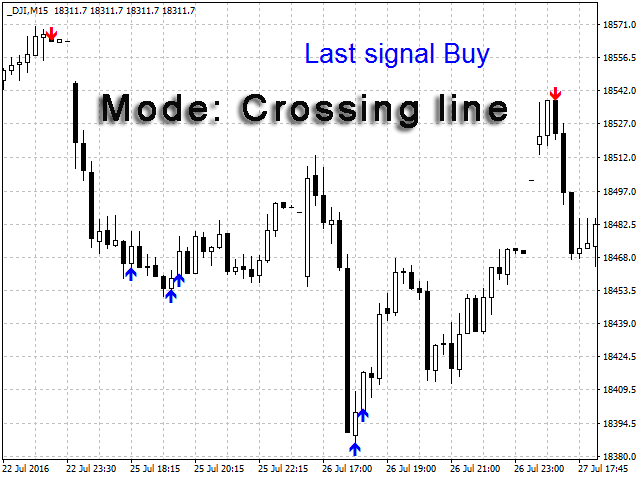
- Crossing line - display all points where RSI crosses signal levels from all timeframes on a single chart. RSI signal levels are standard - 30 and 70.
- Trend + Crossing line - display the crossing of RSI signal lines filtered by the internal trend filter based on the same RSI. In other words, if RSI shows a bullish trend, the indicator searches only for buy signal line crossings. The opposite is true for a bearish trend.
Settings
- barlimit - limit the number of bars for the indicator recalculation since seven timeframes are used. This speeds up the work.
- RSIPeriod - RSI period.
- alerts - enable/disable an audio signal when receiving a signal from the indicator (true/false). The parameter is useful when Crossing line, Trend + Crossing line modes are used. It is recommended to disable it in all other cases.
- alertReversSignal - audio signal in case of a trend change. The parameter is useful in RSI Trend mode. It is recommended to disable it in all other cases.
- Mode - select the indicator operation mode from the above list.
- M5Arrows - enable/disable М5 arrows (true/false).
- M15Arrows - enable/disable М15 arrows (true/false).
- M30Arrows - enable/disable М30 arrows (true/false).
- H1Arrows - enable/disable H1 arrows (true/false).
- H4Arrows - enable/disable H4 arrows (true/false).
- D1Arrows - enable/disable D1 arrows (true/false).
- W1Arrows - enable/disable W1 arrows (true/false).
- BuyClr - buy arrow color.
- SellClr - sell arrow color.
Indicator buffers
- Buffer 10 - buy and sell signals in a single buffer. If the buffer <0, this is a sell signal. Otherwise, this is a buy signal.
- Buffer 11 - buy signals. If >0, a signal is present.
- Buffer 12 - sell signals. If >0, a signal is present.
Buffer exits from 0 to 9 are used for calculations.
If you have any questions, ideas or suggestions, write them in the Comments section.













O usuário não deixou nenhum comentário para sua avaliação