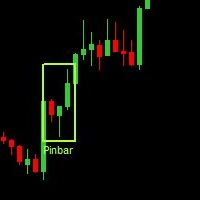
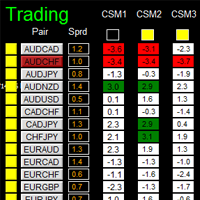
Dashboard Super Risk Reward Panel
- Utilitários
- Wang Yu
- Versão: 1.3
- Atualizado: 21 novembro 2021
- Ativações: 5
如果产品有任何问题或者您需要在此产品上添加功能,请联系我
Contact/message me if you encounter any issue using the product or need extra feature to add on the base version.
Please re-direct to LINK for free demo version.
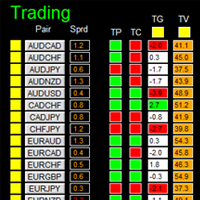
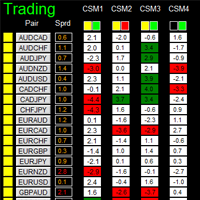
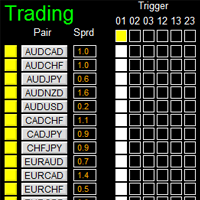
There are two critical components in a profitable trading system, one is entry (place an order), and another one is exit (close an order). You can exit by time: closing order after London Close for example. You can also exit by position: closing an order when price reaches a certain support/resistance level.Dashboard Super Risk Reward Panel is an intuitive, and handy graphic tool to help you to:
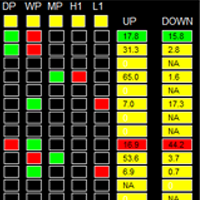
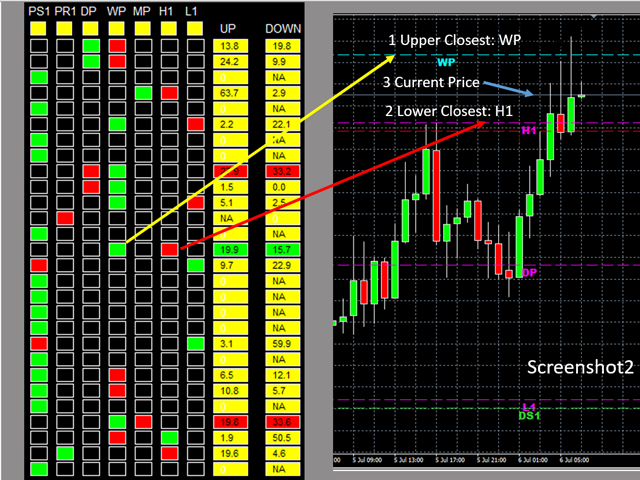
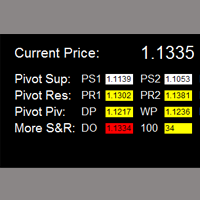
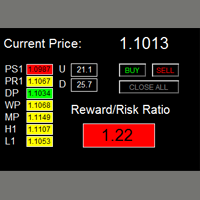
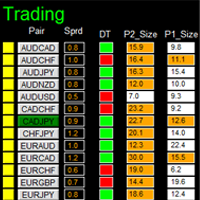
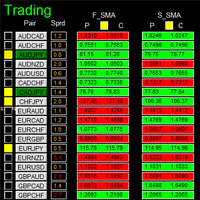
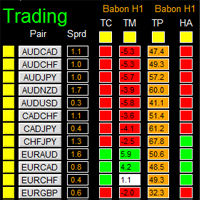
- Locate and highlight the closest upper and lower support/resistance level (among the 7 critical support/resistance level, which are pivot S1, pivot R1, daily pivot, weekly pivot, monthly pivot, previous daily high, and previous daily low) to the current price. See screenshot2.
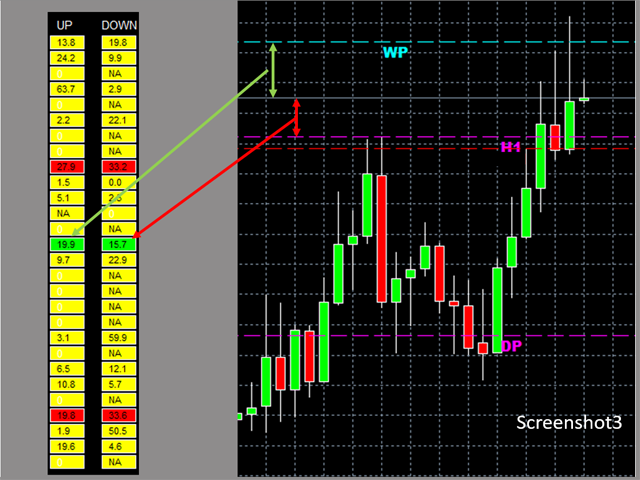
- Find the profitable RR ratio entry level with highlight by calculating and comparing the distance between upper closest to current price and distance between lower closest to current price. See screenshot3
- Click one buy/sell button to place buy and/or sell order with TP and SL set at the above level, which gives you and good RR ratio.
Features
- User is able to select support and resistance levels for RR ratio generating.
- Adjustable indicator panel position
Make sure completing the following action items to make this dashboard working.
- For the first time loading Dashboard, it may takes 3-5 minutes to download historical data. For subsequent loading, it only takes a few seconds.
- Make sure you have all 28 symbols in Symbol window.
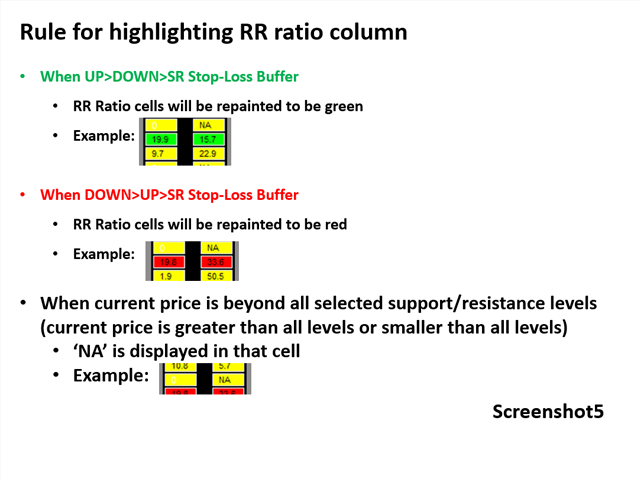
Rules for highlighting RR ratio column
See screenshot5
Input Parameters
- Use Pivot Support1
- Use pivot support for RR ratio calculation
- Same rule applied to the following 6 support/resistance levels.
- Use Pivot Resistance1
- Use Daily Pivot
- Use Weekly Pivot
- Use Monthly Pivot
- Use Previous Daily High
- Use Previous Daily Low
- SR Stop-Loss Buffer
- Magic Number
- Lot Size:
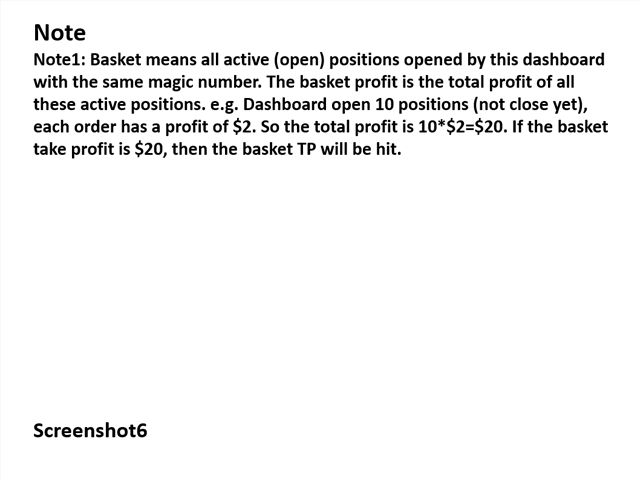
- Basket TP in $:(see explanation in Note1)
- Basket SL in $
- Max Spread: once spread exceeds max spread, spread of that pair will be highlighted in red.
- Suffix: suffix string of your symbol. i.e.: your symbol is ‘EURUSDx’ instead of ‘EURUSD’, input ‘x’ in suffix cell, leave prefix cell blank
- Prefix: prefix string of your symbol
Dashboard Objects
For object 1-7, please refer to screenshot7.
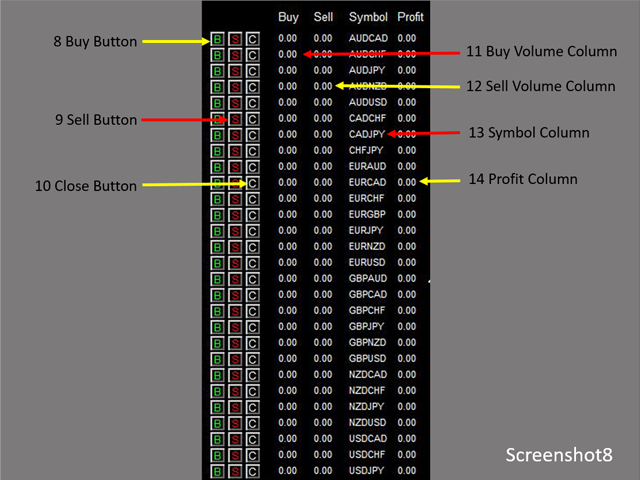
Object 8-14: screenshot8.
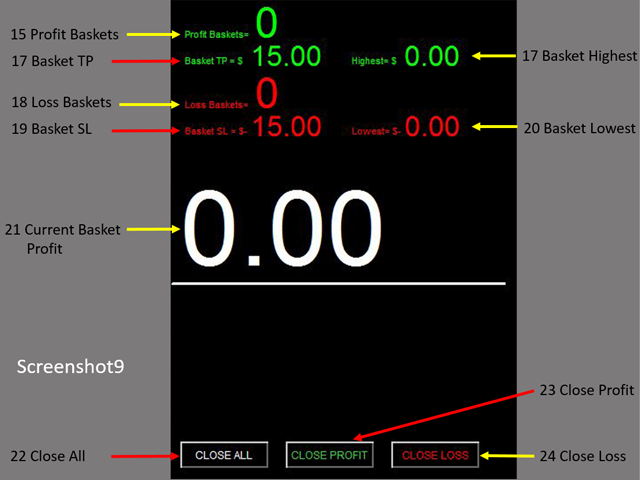
Object 15-24: screenshot9.
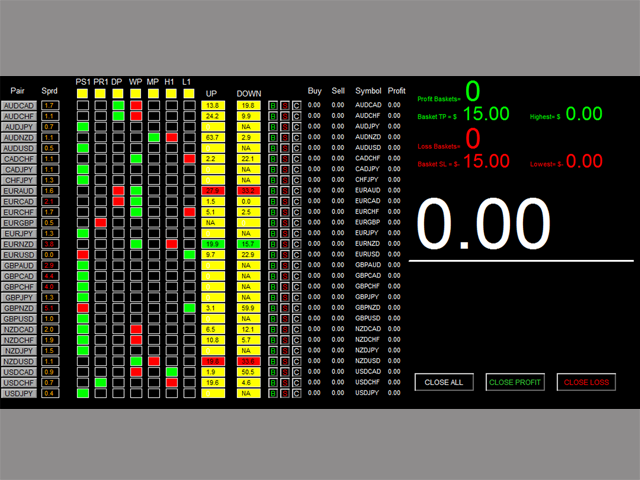
- Pair Symbol Button: click on button to open a corresponding new window chart
- Spread column: show current spread of each pair.
- SR Status Panel: indicates which Support/Resistance level is selected for RR ratio calculation
- Upper Closest Column: cell is repainted to be green to indicate that this support/resistance level is the upper closest level
- Lower Closest Column: cell is repainted to be red to indicate that this support/resistance level is the lower closest level
- Up Column: indicate the distance between upper closest SR level to current price
- Down Column: indicate the distance between Lower closest SR level to current price
- Buy Button: place buy order with upper closest SR level as TP, and lower closest SR level as SL
- Sell Button: place sell order with lower closest SR level as TP, and upper closest SR level as SL
- Close Button: close all positions of corresponding pair
- Buy Volume Column
- Sell Volume Column
- Symbol:
- Profit Column
- Profit Baskets: calculate the number of baskets hitting TP
- Basket TP: Basket take profit
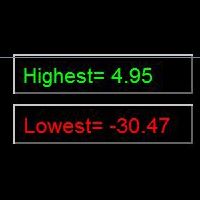
- Basket Highest: the maximum profit that current basket ever reach
- Loss Baskets: calculate the number of baskets hitting SL
- Basket SL: Basket stop loss
- Basket Lowest: the maximum loss that current basket ever reach
- Current Basket Profit: Current basket profit
- Close All: close all positions
- Close Profit: close all positions in profit
- Close Loss: close all positions in loss
Note
Refer to screenshot6
