• Visão global
  • Comentários (5)
  • Discussão (5)
  • O que há de novo

Divergence CCI or any custom

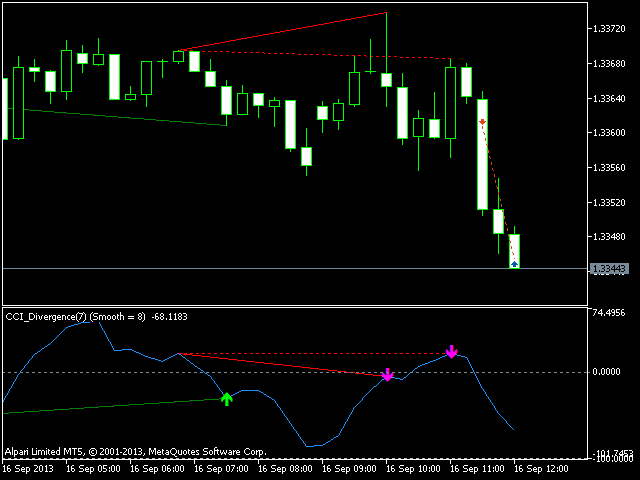
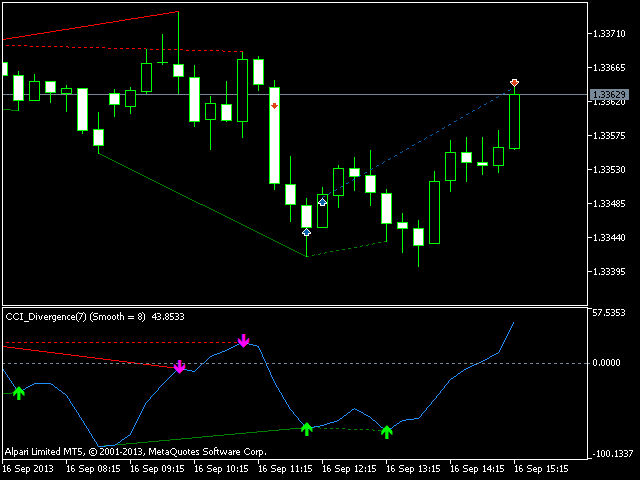
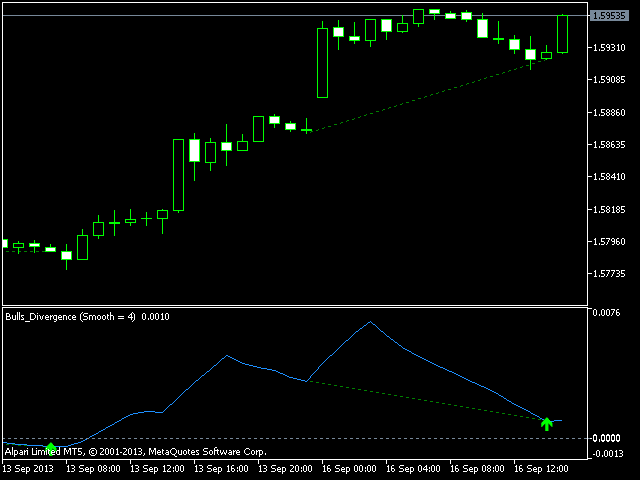
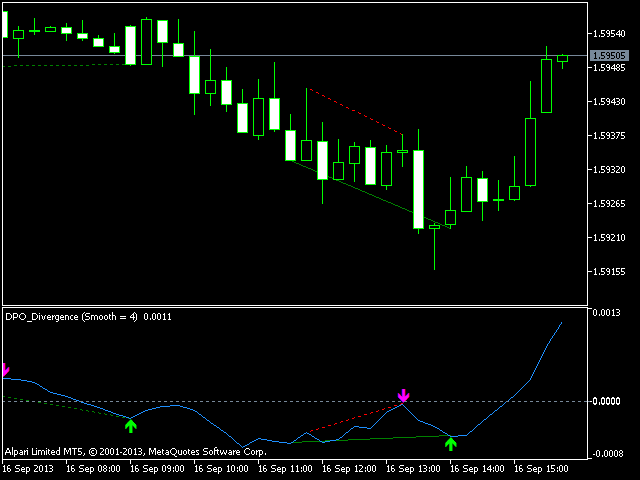
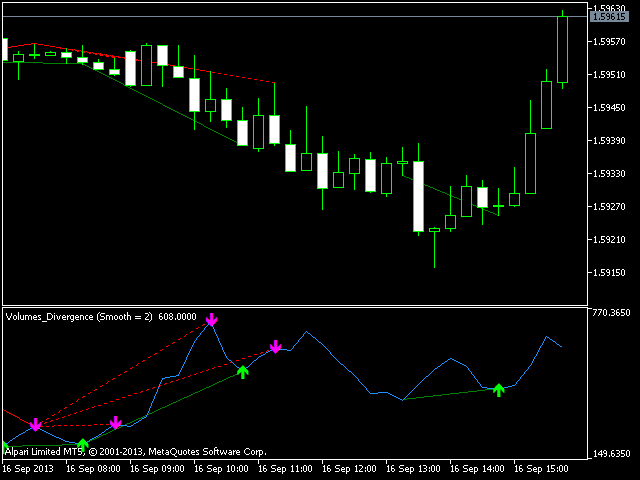
Exibe divergências para qualquer indicador. Você somente precisa colocar o nome do nome de um indicador; por padrão é usado o CCI.

Você pode definir a suavização e os níveis para o indicador selecionado. Se um desses níveis é rompido, você receberá uma notificação. O indicador personalizado deve ser compilado (arquivo com extensão EX5) e deve estar localizado no diretório MQL5/Indicadores do terminal do cliente ou num de seus subdiretórios. Ele usa a barra zero do indicador selecionado como parâmetro padrão.


Parâmetros de Entrada

  • Indicator name - nome do indicador, a divergência é calculado para padrão para o CCI ;
  • Period CCI - período da média do CCI, 7 por padrão;
  • Applied price - preço usado,"Close" por padrão;
  • Smoothing method - método de suavização, "Simple" por padrão;
  • Smooth - período do suavização, 8 por padrão;
  • Level1 - nível do indicador, -100 por padrão;
  • Level2 - nível do indicador, -100 por padrão;
  • Calculated bar - número de barras para exibir a divergência, 300 por padrão;
  • Filter by volume - filtro de volume, "false" por padrão. Se ele estiver habilitado, então os sinais de divergência não aparecem quando o volume é menor do que o volume médio de 100 barras anteriores. Três modos disponíveis: False, True, Auto. No modo "Auto", o filtro é ativado automaticamente nos timeframes M30 e inferiores; é desativado para timeframes maiores do que M30;
  • Display divergence alert - permite notificações sobre divergências, "true" por padrão;
  • Display cross level alert - permite notificações sobre rompimento dos níveis determinados do indicador, "true" por padrão;
  • Draw indicator trend lines - exibe as linhas de tendências do indicador durante as divergências, "true" por padrão;
  • Draw price trend lines - exibe as linhas de tendências no gráfico de preços durante as divergências, true "true" por padrão;
  • Line bull divergence color - seleciona uma cor para a linha de tendência apresentada durante a divergência de alta, "Green" por padrão;
  • Line bear divergence color - seleciona uma cor para a linha de tendência apresentada durante a divergência de baixa, "Red" por padrão.
Produtos recomendados
To get access to MT4 version please click here . - This is the exact conversion from TradingView: "Stochastic Momentum Index" By "UCSgears". - This is a popular version of stochastic oscillator on tradingview. - This is a light-load processing and non-repaint indicator. - Buffers are available for the lines on chart. - You can message in private chat for further changes you need. Thanks for downloading
Ultimate Divergence Scanner (Multi Pair And Multi Time Frame) :   ---LIMITED TIME OFFER: NEXT 25 CLIENTS ONLY ---46% OFF REGULAR PRICE AND 2 FREE BONUSES ---SEE BELOW FOR FULL DETAILS It is a widely known market principle that momentum generally precedes price.  Making divergence patterns a clear indication that price and momentum are not in agreement.  Divergence patterns are widely used by institutional traders around the world. As they allow you to manage  your trades within strictly de
Noize Absorption Index - is the manual trading system that measures the difference of pressure between bears forces and bulls forces. Green line - is a noize free index that showing curent situation. Zero value of index shows totally choppy/flat market.Values above zero level shows how powerfull bullish wave is and values below zero measures bearish forces.Up arrow appears on bearish market when it's ready to reverse, dn arrow appears on weak bullish market, as a result of reverse expectation.
Este indicador inovador de medir a força das moedas da INFINITY é um assistente indispensável para cambistas e comerciantes que negociam em longo prazo. O sistema de análise de força / fraqueza das moedas é conhecido há muito tempo e é usado no mercado pelos principais traders do mundo. Qualquer negociação de arbitragem não está completa sem essa análise. Nosso indicador determina facilmente a força das moedas subjacentes em relação umas às outras. Ele exibe gráficos de linhas em todas ou no pa
Mini Chart Indicators
Flavio Javier Jarabeck
The Metatrader 5 has a hidden jewel called Chart Object, mostly unknown to the common users and hidden in a sub-menu within the platform. Called Mini Chart, this object is a miniature instance of a big/normal chart that could be added/attached to any normal chart, this way the Mini Chart will be bound to the main Chart in a very minimalist way saving a precious amount of real state on your screen. If you don't know the Mini Chart, give it a try - see the video and screenshots below. This is a gr
Antes de tudo, vale ressaltar que esta Ferramenta de Negociação é um Indicador Não Repintante, Não Redesenhante e Não Atrasado, o que a torna ideal para negociação profissional. Curso online, manual do utilizador e demonstração. O Indicador de Conceitos de Ação de Preço Inteligente é uma ferramenta muito poderosa tanto para traders novos quanto experientes. Ele combina mais de 20 indicadores úteis em um único, combinando ideias avançadas de negociação como Análise do Trader do Círculo Intern
Introducing the Consecutive Green/Red Candle Alert Indicator for MT5 - Your Trend Spotting Companion! Are you ready to take your trading to the next level? We present the Consecutive Green/Red Candle Alert Indicator, a powerful tool designed to help you spot trends and potential reversals with ease. Whether you're a new trader looking for clarity in the market or an experienced pro seeking additional confirmation, this indicator is your trusted companion. Key Features of the Consecutive Gre
Owl Smart Levels MT5
Sergey Ermolov
4.31 (39)
Versão MT4  |  FAQ O Indicador Owl Smart Levels é um sistema de negociação completo dentro de um indicador que inclui ferramentas populares de análise de mercado, como fractais avançados de Bill Williams , Valable ZigZag que constrói a estrutura de onda correta do mercado e níveis de Fibonacci que marcam os níveis exatos de entrada no mercado e lugares para obter lucros. Descrição detalhada da estratégia Instruções para trabalhar com o indicador Consultor de negociação Owl Helper Chat privado d
The standard Bollinger Bands indicator has been improved by integrating additional indications from the Standard Deviation indicator (StdDev), which gives an additional filter for confirming trading signals. In addition, the color of the indicator's lines shows the beginning of a trend, its development and exhaustion. This indicator has a signal block that notifies the trader of the beginning of the trend on any time frame to which it is attached. Settings Type of messages - select the type of
Antes de mais nada, vale ressaltar que este Sistema de Negociação é um Indicador Não Repintado, Não Redesenhado e sem Atrasos, o que o torna ideal para negociações profissionais. Curso online, manual do utilizador e demonstração. O "Sistema de Negociação de Suporte e Resistência Inteligente" é um indicador avançado projetado para traders novos e experientes. Empodera os traders com precisão e confiança no mercado forex. Este sistema abrangente combina mais de 7 estratégias, 10 indicadores e vár
Schaff Trend Cycle STC
Mohammad Taher Halimi Tabrizi
The Schaff Trend Cycle indicator is the product of combining Slow Stochastics and the moving average convergence/divergence (MACD). The MACD has a reputation as a trend indicator, but it's also notorious for lagging due to its slow responsive signal line. The improved signal line gives the STC its relevance as an early warning sign to detect currency trends. this indicator is converted from Trading View code of STC Indicator - A Better MACD [SHK]
The Accumulation / Distribution is an indicator which was essentially designed to measure underlying supply and demand. It accomplishes this by trying to determine whether traders are actually accumulating (buying) or distributing (selling). This indicator should be more accurate than other default MT5 AD indicator for measuring buy/sell pressure by volume, identifying trend change through divergence and calculating Accumulation/Distribution (A/D) level. Application: - Buy/sell pressure: above
A Gann Box (ou Gann Square) é um método de análise de mercado baseado no artigo "Fórmula matemática para previsões de mercado" de WD Gann. Este indicador pode representar três modelos de Quadrados: 90, 52(104), 144. Existem seis variantes de grades e duas variantes de arcos. Você pode plotar vários quadrados em um gráfico simultaneamente. Parâmetros Square — seleção de um modelo quadrado: 90 — quadrado de 90 (ou quadrado de nove); 52 (104) — quadrado de 52 (ou 104); 144 — quadrado universal
Crash 1000 Scalping Indicator for the Crash 1000 Deriv Synthetic Index. Introduction The Crash 1000 Scalping Indicator is a specialized tool designed for the Crash 1000 index on the Deriv Synthetic market. This indicator is particularly useful for scalping on the M1 timeframe, helping traders to identify precise entry and exit points for buy positions. It is designed to be non-repainting, providing clear signals with audible alerts and push notifications, and is compatible with mobile devices th
InfinX Hull Mavg MT5
Stanislav Shtiliyanov
The Hull Moving Average (HMA) attempts to minimize the lag of a traditional moving average while retaining the smoothness of the moving average line. Developed by Alan Hull in 2005, this indicator makes use of weighted moving averages to prioritize more recent values and greatly reduce lag. The resulting average is more responsive and well-suited for identifying entry points. For more information, welcome to our Telegram Group.  https://t.me/InfinXx
Este indicador mostrará os valores de TP e SL (naquela moeda) que você já definiu para todos os pedidos nos gráficos (fechados na linha de transação/pedido) que o ajudarão muito a estimar seus lucros e perdas para cada pedido. E também mostra os valores de PIPs. o formato mostrado é "Valores de moeda de nossos valores de Lucro ou Perda / PIPs". O valor TP será mostrado na cor verde e o valor SL será mostrado na cor vermelha. Para qualquer dúvida ou mais informações, sinta-se à vontade para en
Terra Infinity is a flat indicator. This improved version of the CalcFlat indicator has three additional lines that significantly increase its effectiveness. Unlike its predecessor with two static levels, Terra Infinity adds three dynamic lines above the main histogram, which are interpreted as follows: base signal line, minimum signal line, maximum signal line. These lines are formed using the additional parameter Avg, which is the average value of the histogram. Averaging produces a line
Atomic Analyst MT5
Issam Kassas
4.6 (20)
Primeiramente, vale ressaltar que este Indicador de Negociação não repinta, não redesenha e não apresenta atrasos, tornando-o ideal tanto para negociação manual quanto automatizada. Manual do utilizador: configurações, entradas e estratégia. O Analista Atômico é um Indicador de Ação de Preço PA que utiliza a força e o momentum do preço para encontrar uma vantagem melhor no mercado. Equipado com filtros avançados que ajudam a remover ruídos e sinais falsos, e aumentam o potencial de negociação.
Was: $249  Now: $99   Market Profile defines a number of day types that can help the trader to determine market behaviour. A key feature is the Value Area, representing the range of price action where 70% of trading took place. Understanding the Value Area can give traders valuable insight into market direction and establish the higher odds trade. It is an excellent addition to any system you may be using. Inspired by Jim Dalton’s book “Mind Over Markets”, this indicator is designed to suit the
O HAshi-E é uma forma aprimorada de analisar os sinais do Heiken-Ashi. Resumo: O Heiken-Ashi é particularmente valorizado por sua capacidade de filtrar a volatilidade de curto prazo, o que o torna a ferramenta preferida para identificar e acompanhar tendências, ajuda na tomada de decisões sobre pontos de entrada e saída e auxilia na distinção entre sinais falsos e reversões genuínas de tendências. Diferentemente dos gráficos de velas tradicionais, as velas Heiken-Ashi são calculadas usando
Este indicador encontra os padrões de retração AB = CD. O padrão AB = CD Retracement é uma estrutura de preço de 4 pontos em que o segmento de preço inicial é parcialmente retraído e seguido por um movimento equidistante da conclusão da retirada, e é a base básica para todos os padrões harmônicos. [ Guia de instalação | Guia de atualização | Solução de problemas | FAQ | Todos os produtos ] Tamanhos de padrão personalizáveis Proporções AC e BD personalizáveis Períodos de interrupção person
Oscillator trading signals - это динамический индикатор, определяющий состояние к продолжению тенденции роста или падению цены торгового инструмента и отсечению зон с нежелательной торговлей. Индикатор состоит из 2 линий осцилляторов. Медленная и быстрая сигнальная линия.  Шкала отображения перевернутая. Зоны вблизи 0 свидетельствуют о тенденции роста цены валютной пары. Зоны -100 свидетельствуют о падении цены валютной пары. На основном графике в виде стрелок отображается потенциально выгодные
Uma das sequências numéricas é chamada de "Forest Fire Sequence". Foi reconhecida como uma das mais belas novas sequências. Sua principal característica é que essa sequência evita tendências lineares, mesmo as mais curtas. É esta propriedade que formou a base deste indicador. Ao analisar uma série temporal financeira, este indicador tenta rejeitar todas as opções de tendência possíveis. E somente se ele falhar, ele reconhece a presença de uma tendência e dá o sinal apropriado. Esta abordagem pe
Difícil de encontrar e com pouca frequência, as divergências são um dos cenários de negociação mais confiáveis. Este indicador localiza e verifica automaticamente divergências ocultas e regulares usando seu oscilador favorito. [ Guia de instalação | Guia de atualização | Solução de problemas | FAQ | Todos os produtos ] Fácil de trocar Encontra divergências regulares e ocultas Suporta muitos osciladores conhecidos Implementa sinais de negociação baseados em fugas Exibe níveis adequados de
MACDivergence MTF MT5
Pavel Zamoshnikov
4.17 (6)
Advanced ideas of the popular MACD indicator: It detects and displays classic and reverse divergences (two methods of detecting divergences). It uses different color to highlight an uptrend and a downtrend. Two methods of determining a trend: а) MACD crosses the 0 level (classic signal); б) MACD crosses its own average (early signal). This is a multi-timeframe indicator: it can display MACD data from other timeframes. Two methods of drawing: classic histogram and line. It generates sound and vis
SMT (Smart Money Technique) Divergence refers to the price divergence between correlated assets or their relationship to inversely correlated assets.  By analyzing SMT Divergence, traders can gain insights into the market's institutional structure and identify whether smart money is accumulating or distributing assets.  Every price fluctuation should be confirmed by market symmetry, and any price asymmetry indicates an SMT Divergence, suggesting a potential trend reversal. MT4 Version -  https:/
The indicator identifies divergences between chart and RSI, with the possibility of confirmation by stochastics or MACD. A divergence line with an arrow appears on the chart when divergence is detected after the current candle has expired. There are various filter parameters that increase the accuracy of the signals. To identify a divergence, point A must be set in the RSI, then point B Value must be edited, which sets the difference between point A and point B. The indicator can be used for tim
Market Overview MT5
Mehran Sepah Mansoor
Optimize as suas decisões de negociação com o nosso indicador de força e sentimento do mercado e não negoceie mais contra a tendência! Meticulosamente concebido para comerciantes sérios que valorizam informações precisas e oportunas, o nosso indicador fornece uma visão panorâmica dos 28 pares principais de uma forma muito simples. Esta ferramenta é capaz de classificar os pares de moedas com base em termos de popularidade, força da tendência de alta ou de baixa e percentagem de compradores e
For a trader, trend is our friend. This is a trend indicator for MT5, can be used on any symbol. just load it to the terminal and you will see the current trend. green color means bullish trend and red means bearlish trend. you can also change the color by yourself when the indicator is loaded to the MT5 terminal the symbol and period is get from the terminal automaticly. How to use: I use this trend indicator on 2 terminals with different period  for the same symbol at same time. for example M5
Wave Trend MT5
Diego Arribas Lopez
MT4 Version Wave Trend MT5 Wave Trend is an oscillator, which helps identifing in a extremely accurate manner market reversals. The Oscillator being obove the overbought level and a cross down of the fast into the slow MA usually indicates a good SELL signal. If the oscillators is below the oversold level and the fast MA crosses over the slower MA usually highlights a good BUY signal. The Wave Trend indicator can be also used when divergences appear against the price, indicating the current move
Os compradores deste produto também adquirem
Atbot
Zaha Feiz
4.97 (29)
AtBot: Como funciona e como usá-lo ### Como funciona O indicador "AtBot" para a plataforma MT5 gera sinais de compra e venda usando uma combinação de ferramentas de análise técnica. Ele integra a Média Móvel Simples (SMA), a Média Móvel Exponencial (EMA) e o índice de Faixa Verdadeira Média (ATR) para identificar oportunidades de negociação. Além disso, pode utilizar velas Heikin Ashi para melhorar a precisão dos sinais. Deixe uma avaliação após a compra e receba um presente especial. ### Princ
Primeiramente, vale ressaltar que este Sistema de Trading é um Indicador Não Repintado, Não Redesenho e Não Atrasado, o que o torna ideal tanto para o trading manual quanto para o automatizado. Curso online, manual e download de predefinições. O "Sistema de Trading Inteligente MT5" é uma solução completa de trading projetada para traders novos e experientes. Ele combina mais de 10 indicadores premium e apresenta mais de 7 estratégias de trading robustas, tornando-o uma escolha versátil para dive
TPSpro RFI Levels MT5
Roman Podpora
4.67 (9)
Reversal First Impulse levels (RFI)      INSTRUCTIONS        RUS       -       ENG              R ecommended to use with an indicator   -   TPSpro  TREND PRO -  Version MT4                 A key element in trading is zones or levels from which decisions to buy or sell a trading instrument are made. Despite attempts by major players to conceal their presence in the market, they inevitably leave traces. Our task was to learn how to identify these traces and interpret them correctly. Main functi
TPSproTREND PrO MT5
Roman Podpora
4.89 (9)
TPSpro TREND PRO  - is a trend indicator that automatically analyzes the market and provides information about the trend and each of its changes, as well as giving signals for entering trades without redrawing! The indicator uses each candle, analyzing them separately. referring to different impulses - up or down impulse. Exact entry points into transactions for currencies, crypto, metals, stocks, indices!  Version MT4               DETAILED DESCRIPTION               R ecommended to use with an
Gold Stuff mt5
Vasiliy Strukov
4.9 (185)
Gold Stuff mt5-um indicador de tendência projetado especificamente para o ouro, também pode ser usado em qualquer instrumento financeiro. O indicador não é redesenhado ou atrasado. O timeframe recomendado é H1. Importante! Entre em contato comigo imediatamente após a compra para obter instruções e bônus!  Você pode obter uma cópia gratuita do nosso indicador Strong Support e Trend Scanner, envie uma mensagem privada. a mim! PARÂMETRO Draw Arrow-incl.desligado. desenhar setas no gráfico. A
Quantum Trend Sniper
Bogdan Ion Puscasu
4.92 (48)
Apresentando       Quantum Trend Sniper Indicator   , o inovador Indicador MQL5 que está transformando a maneira como você identifica e negocia as reversões de tendência! Desenvolvido por uma equipe de traders experientes com experiência comercial de mais de 13 anos,       Indicador de Atirador de Tendência Quântica       foi projetado para impulsionar sua jornada de negociação a novos patamares com sua forma inovadora de identificar reversões de tendência com precisão extremamente alta. ***C
Este é um indicador para MT5 que fornece sinais precisos para entrar em uma negociação sem redesenhar. Ele pode ser aplicado a qualquer ativo financeiro: forex, criptomoedas, metais, ações, índices. Ele fornecerá estimativas bastante precisas e informará quando é melhor abrir e fechar um negócio. Assista o vídeo (6:22) com um exemplo de processamento de apenas um sinal que compensou o indicador! A maioria dos traders melhora seus resultados de negociação durante a primeira semana de negociação c
Trend Screener Pro MT5
STE S.S.COMPANY
4.88 (67)
Desbloqueie o poder da negociação de tendências com o indicador Trend Screener: sua solução definitiva de negociação de tendências, alimentada por lógica difusa e sistema de múltiplas moedas! Eleve sua negociação de tendências com o Trend Screener, o revolucionário indicador de tendências alimentado por lógica difusa. É um poderoso indicador de acompanhamento de tendências que combina mais de 13 ferramentas e recursos premium e 3 estratégias de negociação, tornando-o uma escolha versátil para to
FX Power MT5 NG
Daniel Stein
5 (6)
Receba a sua atualização diária do mercado com detalhes e screenshots através do nosso Morning Briefing aqui no mql5 e no Telegram ! O FX Power MT5 NG é a próxima geração do nosso medidor de força de moeda muito popular de longa data, o FX Power. E o que é que este medidor de força da próxima geração oferece? Tudo o que adorou no FX Power original MAIS Análise de força GOLD/XAU Resultados de cálculo ainda mais precisos Períodos de análise configuráveis individualmente Limite de cálculo personal
FX Volume MT5
Daniel Stein
4.94 (17)
Receba a sua atualização diária do mercado com detalhes e screenshots através do nosso Morning Briefing aqui no mql5 e no Telegram ! O Volume FX é o PRIMEIRO e ÚNICO indicador de volume que fornece uma visão REAL do sentimento do mercado do ponto de vista de um corretor. Ele fornece uma visão incrível de como os participantes do mercado institucional, como corretores, estão posicionados no mercado Forex, muito mais rápido do que os relatórios COT. Ver essas informações diretamente no seu gráfi
Easy By Sell is a market indicator for opening and closing positions. It becomes easy to track market entries with alerts. It indicates trend reversal points when a price reaches extreme values ​​and the most favorable time to enter the market. it is as effective as a Fibonacci to find a level but it uses different tools such as an algorithm based on ATR indicators and Stochastic Oscillator. You can modify these two parameters as you wish to adapt the settings to the desired period. My othe
IX Power MT5
Daniel Stein
4.17 (6)
O   IX Power   traz finalmente a precisão imbatível do FX Power para símbolos não-Forex. Determina com exatidão a intensidade das tendências a curto, médio e longo prazo nos seus índices, acções, mercadorias, ETFs e até criptomoedas favoritos. Pode   analisar tudo o que   o seu terminal tem para oferecer. Experimente e veja como   o seu timing melhora significativamente   quando negoceia. Características principais do IX Power Resultados de cálculo 100% precisos e sem repintura - para tod
TrendMaestro5
Stefano Frisetti
note: this indicator is for METATRADER4, if you want the version for METATRADER5 this is the link:  https://www.mql5.com/it/market/product/108106 TRENDMAESTRO ver 2.4 TRENDMAESTRO recognizes a new TREND in the bud, he never makes mistakes. The certainty of identifying a new TREND is priceless. DESCRIPTION TRENDMAESTRO identifies a new TREND in the bud, this indicator examines the volatility, volumes and momentum to identify the moment in which there is an explosion of one or more of these data a
Golden Spikes Premium
Kwaku Bondzie Ghartey
Golden Spikes Detector Acknowledgement and Dedications:  The name of this indicator was Inspired by an Original; Mr Grant Koopman; a Knowledgeable and experienced Synthetics trader. I dedicate this indicator to Mr Grant.  Overview: The Golden Spikes Premium is a groundbreaking trading indicator meticulously crafted for the Boom and Crash indices on the Deriv market. Tailored to meet the needs of discerning traders, this powerful tool operates exclusively on the one-minute timeframe, providin
Agora US $ 147 (aumentando para US $ 499 após algumas atualizações) - Contas ilimitadas (PCs ou Macs) Manual do usuário do RelicusRoad + vídeos de treinamento + acesso ao grupo de discórdia privado + status VIP UMA NOVA FORMA DE OLHAR PARA O MERCADO O RelicusRoad é o indicador de negociação mais poderoso do mundo para forex, futuros, criptomoedas, ações e índices, oferecendo aos traders todas as informações e ferramentas necessárias para se manterem rentáveis. Fornecemos análises técnica
XQ Indicator MetaTrader 5
Marzena Maria Szmit
3.5 (2)
Step into the realm of Forex trading with confidence and precision using XQ, a cutting-edge Forex indicator designed to elevate your trading game to unprecedented heights. Whether you're a seasoned trader or just stepping into the world of currency exchange, XQ Forex Indicator empowers you with the insights and signals needed to make informed trading decisions. The signal conditions are a combination of three indicators, and XQ Forex Indicator only display  medium and long-term trends . The ind
Trend Hunter MT5
Andrey Tatarinov
5 (1)
Trend Hunter é um indicador de tendência para trabalhar nos mercados Forex, criptomoeda e CFD. Uma característica especial do indicador é que ele segue a tendência com confiança, sem alterar o sinal quando o preço ultrapassa ligeiramente a linha de tendência. O indicador não é redesenhado; um sinal para entrar no mercado aparece após o fechamento da barra. Ao avançar ao longo de uma tendência, o indicador mostra pontos de entrada adicionais na direção da tendência. Com base nesses sinais, voc
The Smart Liquidity Profile is color-coded based on the importance of the traded activity at specific price levels, allowing traders to identify significant price levels such as support and resistance levels, supply and demand zones, liquidity gaps, consolidation zones, Buy-Side/Sell-Side Liquidity and so on.  Smart Liquidity Profile allows users to choose from a number of different time periods including 'Auto,' 'Fixed Range,' 'Swing High,' 'Swing Low,' 'Session,' 'Day,' 'Week,' 'Month,' 'Quart
Este painel mostra os últimos   padrões harmónicos   disponíveis para os símbolos seleccionados, pelo que poupará tempo e será mais eficiente /   versão MT4 . Indicador gratuito:   Basic Harmonic Pattern Colunas do indicador Symbol :   aparecem os símbolos seleccionados Trend :   de alta ou de baixa Pattern :   tipo de padrão (gartley, borboleta, morcego, caranguejo, tubarão, cifra ou ABCD) Entry :   preço de entrada SL:   preço de paragem de perda TP1:   preço do 1º take profit TP2:   preç
ATrend
Zaha Feiz
4.5 (2)
ATREND: Como Funciona e Como Usá-lo #### Como Funciona O indicador "ATREND" para a plataforma MT5 é projetado para fornecer aos traders sinais robustos de compra e venda, utilizando uma combinação de metodologias de análise técnica. Este indicador aproveita principalmente o Intervalo Verdadeiro Médio (ATR) para medir a volatilidade, juntamente com algoritmos de detecção de tendências para identificar possíveis movimentos de mercado. Deixe uma mensagem após a compra e receba um brinde especial.
Volume by Price MT5
Brian Collard
3.6 (5)
The Volumebyprice.com Indicator for MetaTrader 5 features Volume Profile and Market Profile TPO (Time Price Opportunity). Volume and TPO histogram bar and line charts. Volume Footprint charts. TPO letter and block marker collapsed and split structure charts. Static, dynamic and flexible range segmentation and compositing methods with relative and absolute visualizations. Session hours filtering and segment concatenation with Market Watch and custom user specifications. Graphical layering, posit
Volatility Trend System - é um sistema de negociação que fornece sinais para entradas. O sistema de volatilidade fornece sinais lineares e pontuais na direção da tendência, bem como sinais para sair dela, sem redesenhar ou atrasos. O indicador de tendência monitora a direção da tendência de médio prazo, mostra a direção e sua mudança. O indicador de sinal é baseado em mudanças na volatilidade e mostra as entradas no mercado. O indicador está equipado com diversos tipos de alertas. Pode se
Advanced Supply Demand MT5
Bernhard Schweigert
4.53 (15)
Atualmente com 33% de desconto! A melhor solução para qualquer Trader Novato ou especialista! Este indicador é uma ferramenta de negociação exclusiva, de alta qualidade e acessível porque incorporamos uma série de recursos proprietários e uma nova fórmula. Com esta atualização, você poderá mostrar fusos horários duplos. Você não só será capaz de mostrar um TF mais alto, mas também mostrar ambos, o TF do gráfico, MAIS o TF mais alto: MOSTRANDO ZONAS ANINHADAS. Todos os traders de Oferta e Demanda
ICT, SMC, SMART MONEY CONCEPTS, SMART MONEY, Smart Money Concept, Support and Resistance, Trend Analysis, Price Action, Market Structure, Order Blocks, BOS/CHoCH,   Breaker Blocks ,  Momentum Shift,   Supply&Demand Zone/Order Blocks , Strong Imbalance,   HH/LL/HL/LH,    Fair Value Gap, FVG,  Premium  &   Discount   Zones, Fibonacci Retracement, OTE, Buy Side Liquidity, Sell Side Liquidity, BSL/SSL Taken, Equal Highs & Lows, MTF Dashboard, Multiple Time Frame, BigBar, HTF OB, HTF Market Structure
Matrix Arrow Indicator MT5
Juvenille Emperor Limited
5 (14)
O   Matrix Arrow Indicator MT5   é uma tendência única 10 em 1 seguindo um indicador multi-timeframe   100% sem repintura   que pode ser usado em todos os símbolos/instrumentos:   forex ,   commodities ,   criptomoedas ,   índices ,   ações .  O  Matrix Arrow Indicator MT5  determinará a tendência atual em seus estágios iniciais, reunindo informações e dados de até 10 indicadores padrão, que são: Índice de movimento direcional médio (ADX) Índice de canal de commodities (CCI) Velas clássicas de
Torne-se um Negociador Breaker e lucre com as mudanças na estrutura do mercado à medida que o preço reverte. O indicador de quebra de bloco de pedidos identifica quando uma tendência ou movimento de preço está chegando à exaustão e pronto para reverter. Ele o alerta sobre mudanças na estrutura do mercado, que normalmente ocorrem quando uma reversão ou uma grande retração está prestes a ocorrer. O indicador usa um cálculo proprietário que identifica rupturas e momento do preço. Toda vez que
Gartley Hunter Multi
Siarhei Vashchylka
5 (8)
Gartley Hunter Multi - An indicator for searching for harmonic patterns simultaneously on dozens of trading instruments and on all possible timeframes. Manual (Be sure to read before purchasing) | Version for MT4 Advantages 1. Patterns: Gartley, Butterfly, Shark, Crab. Bat, Alternate Bat, Deep Crab, Cypher 2. Simultaneous search for patterns on dozens of trading instruments and on all possible timeframes 3. Search for patterns of all possible sizes. From the smallest to the largest 4. A
Blahtech Supply Demand MT5
Blahtech Limited
4.54 (13)
Was: $299  Now: $99   Supply Demand uses previous price action to identify potential imbalances between buyers and sellers. The key is to identify the better odds zones, not just the untouched ones. Blahtech Supply Demand indicator delivers functionality previously unavailable on any trading platform. This 4-in-1 indicator not only highlights the higher probability zones using a multi-criteria strength engine, but also combines it with multi-timeframe trend analysis, previously confirmed swings
Order Block Hunter MT5
Noha Mohamed Fathy Younes Badr
5 (1)
Order block hunter indicator is the best indicator for  hunt the order blocks that area where there has been a large concentration of limit orders waiting to be executed Order blocks are identified on a chart by observing previous price action and looking for areas where the price experienced significant movement or sudden changes in direction .This indicator does that for you by using very complicated codes and helps you to take the best areas To buy and sell because it make marks at the best a
Native Channels
BeeXXI Corporation
5 (2)
This indicator recognizes all support and resistance levels. A number of unique high-performance techniques have been applied, which made the existence of this indicator possible. All formed channels are naturally visible: horizontal linear linear parabolic cubic (Polynomial 3 degrees - Wave) This is due to a bundle of approximating channels. The formed channels form "standing waves" in a hierarchical sequence. Thus, all support and resistance levels are visible. All parameter management is
Mais do autor
Power MT5
Vladimir Gotsulenko
O indicador é baseado na leitura de dois osciladores: Bulls Power e Bears Power. Mostra claramente a força do balanço entre compradores e vendedores. Um sinal para a entrada de uma ordem ocorre no cruzamento da linha zero e/ou uma divergência. Quando o filtro de volume estiver ativado, a barra amarela do histograma mostrará um volume de negociação baixo (abaixo da média para as 50 barras anteriores). Parâmetros de Entrada: Period - calculo do periodo, 13 por padrão; CalculatedBar - número de bar
The indicator displays divergence for any custom indicator. You only need to specify the indicator name; DeMarker is used by default. Additionally, you can opt for smoothing of values of the selected indicator and set levels whose crossing will trigger an alert. The custom indicator must be compiled (a file with ex5 extension) and located under MQL5/Indicators of the client terminal or in one of the subdirectories. It uses zero bar of the selected indicator with default parameters. Input param
FREE
Best Wave
Vladimir Gotsulenko
3.8 (10)
O indicador de tendência (flat) com um canal de preço. Trading Comprar - O preço deve ter cruzado a linha central para cima (a vela ter fechado acima da linha) e o canal é orientado horizontalmente (linha amarela) ou dirigido para cima (linha verde). Mover para o ponto de equilíbrio quando se atinge a borda oposta do canal. Fecha as posições quando são formadas as condições para venda. Vender - O preço deve ter cruzado a linha central para baixo (a vela ter fechado abaixo da linha) e o canal é
FREE
Trend check USDCHF
Vladimir Gotsulenko
3.33 (6)
This indicator gives full information about the market state: strength and direction of a trend, volatility and price movement channel. It has two graphical components: Histogram: the size and the color of a bar show the strength and direction of a trend. Positive values show an ascending trend and negative values - a descending trend. Green bar is for up motion, red one - for down motion, and the yellow one means no trend. Signal line is the value of the histogram (you can enable divergence sea
FREE
VSA Volume Spread Analysis
Vladimir Gotsulenko
3.82 (11)
The indicator produces signals according to the methodology VSA (Volume Spread Analysis) - the analysis of trade volume together with the size and form of candlesticks. The signals are displayed at closing of bars on the main chart in the form of arrows. The arrows are not redrawn. Input Parameters DisplayAlert - enable alerts, true on default; Pointer - arrow type (three types), 2 on default; Factor_distance - distance rate for arrows, 0.7 on default. Recommended timeframe - М15. Currency pai
Angle Regression Line MT4
Vladimir Gotsulenko
4.67 (3)
The indicator allows determining the strength and direction of the trend precisely. The histogram displayed in a separate window shows changes of the slope of the regression line. A signal for entering a deal is crossing the zero line and/or a divergence. The indicator is also useful for wave analysis. Input Parameters: Period - period of calculation, 10 on default; Angle threshold - slope at which a flat is displayed, 6.0 on default (within the range from -6.0 to 6.0); Filter by volume - volume
The indicator produces signals according to the methodology VSA (Volume Spread Analysis) - the analysis of trade volume together with the size and form of candlesticks. The signals are displayed at closing of bars on the main chart in the form of arrows. The arrows are not redrawn. Input Parameters: DisplayAlert - enable alerts, true on default; Pointer - arrow type (three types), 2 on default; Factor_distance - distance rate for arrows, 0.7 on default. Recommended timeframe - М15. Currency pair
The indicator allows determining the strength and direction of the trend precisely. The histogram displayed in a separate window shows changes of the slope of the regression line. A signal for entering a deal is crossing the zero line and/or a divergence. The indicator is also useful for wave analysis. Input Parameters: Period - period of calculation, 24 on default; CalculatedBar - number of bars for displaying a divergence, 300 on default; AngleTreshold - slope at which a flat is displayed, 6.0
Trend check
Vladimir Gotsulenko
This indicator gives full information about the market state: strength and direction of a trend, volatility and price movement channel. It has two graphical components: Histogram: the size and the color of a bar show the strength and direction of a trend. Positive values show an ascending trend and negative values - a descending trend. Green bar is for up motion, red one - for down motion, and the yellow one means no trend. Signal line is the value of the histogram (you can enable divergence sea
Angle DeMarker MT5
Vladimir Gotsulenko
The indicator shows the angle of the DeMarker indicator line, which allows you to identify possible price extrema more accurately. Histogram bar color and size indicate the direction and angle of the DeMarker line. When the trade volume control is enabled, a yellow bar is an indication of the volume being lower than average over the past 50 bars. The color of the main indicator line shows whether the price has reached an overbought/oversold level in accordance with DeMarker indicator values. The
Filtro:
Fadzo
135
Fadzo 2021.02.15 08:14 
 

O usuário não deixou nenhum comentário para sua avaliação

Frenk
24
Frenk 2020.10.31 17:44 
 

O usuário não deixou nenhum comentário para sua avaliação

Vladimir Gotsulenko
7273
Resposta do desenvolvedor Vladimir Gotsulenko 2020.11.01 15:42
Unfortunately no...
Valentin Butorin
4124
Valentin Butorin 2020.10.01 12:51 
 

O usuário não deixou nenhum comentário para sua avaliação

Noprofit
316
Noprofit 2020.07.02 21:01 
 

O usuário não deixou nenhum comentário para sua avaliação

[Excluído] 2019.01.14 06:12 
 

O usuário não deixou nenhum comentário para sua avaliação

Responder ao comentário
Versão 1.10 2021.11.18
Улучшен алгоритм обработки