Break Lines
- Indicadores
- Alexander Nikolaev
- Versão: 1.2
- Atualizado: 23 novembro 2021
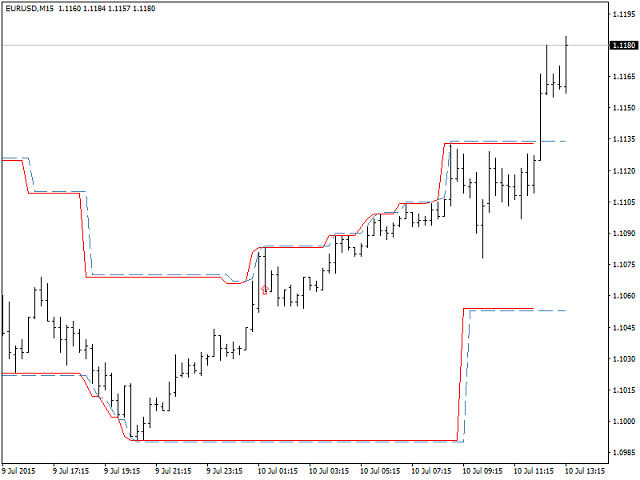
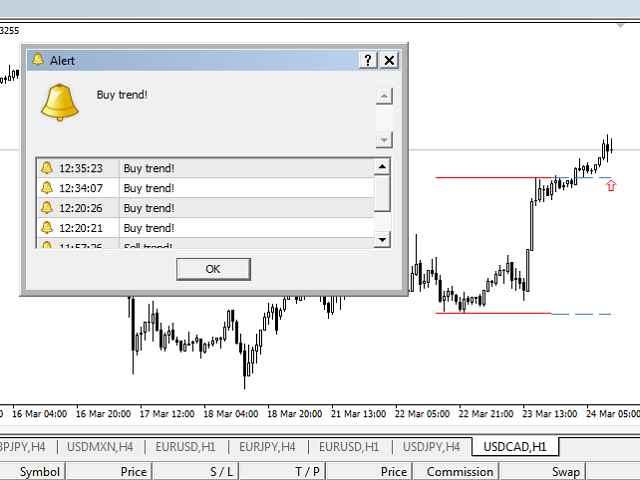
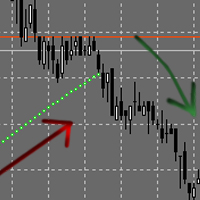
The indicator draws lines the the price highs and lows. Break through the high or low usually indicates trend change (or continuation). Once the price moves through a line, and the candlestick closes, the indicator draws an appropriate arrow (also, you can enable alerts). A deal should be conducted in the breakthrough direction immediately or after a slight rollback. It is best to trade following the trend on a larger timeframe. This indicator is easy to use, but nevertheless, there are many trading strategies, which are based on a breakthrough of the trading range.
The number of candlesticks used to determine the high and low of the trading range can be adjusted.
The following Expert Advisors are based on this indicator: Breakout Line and Breakout and pullback
Parameters
- Trading range - number of bars of the trading range used to define highs and lows;
- Shift - shift relative to the trade range to determine the breakthrough;
- EnableAlert - enable/disable alerts (true - on).


















Good indicator