• Visão global
  • Comentários (2)
  • Discussão (4)
  • O que há de novo

MetaCOT 2 Absolute Position COT MT4

1

MetaCOT 2 is a set of indicators and specialized utilities for the analysis of the U.S. Commodity Futures Trading Commission reports. Thanks to the reports issued by the Commission, it is possible to analyze the size and direction of the positions of the major market participants, which brings the long-term price prediction accuracy to a new higher-quality level, inaccessible to most traders.

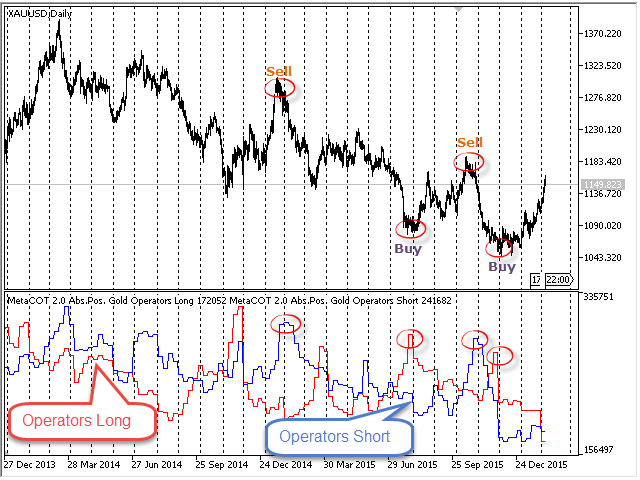
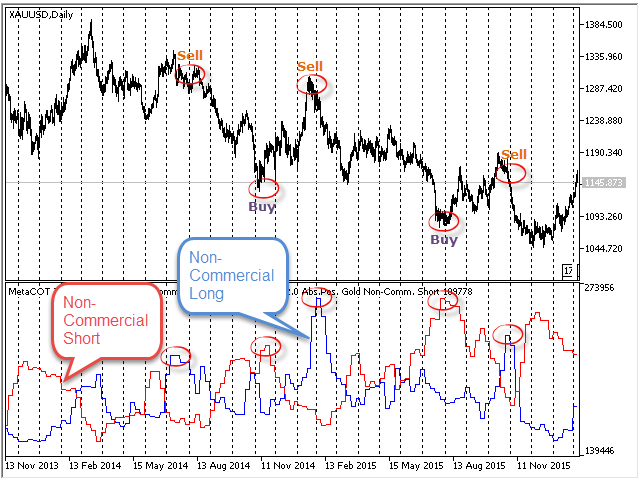
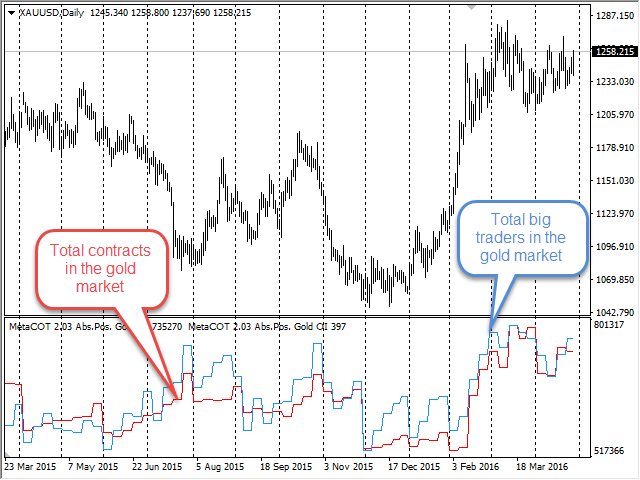
The indicator of absolute positions shows the dynamics of the open positions or the number of traders in each participant groups of the classic COT report (Commitments of Traders). It includes the following groups:

  • Cumulative Open Interest of all market participants (Open Interest);
  • Long position or the number of non-commercial traders (Non-Commercial Long);
  • Short position or the number of non-commercial traders (Non-Commercial Short);
  • Position of non-commercial traders or their number, that is covered (Non-Commercial Spread);
  • Long position or the number of operators (Operators Long);
  • Short position or the number of operators (Operators Short);
  • Long position of non-reportable or small traders (Nonreportable Long);
  • Short position of non-reportable or small traders (Nonreportable Short).

Often the extreme values of one of the group members are the harbingers of the global market reversal. This indicator shows these values, indicating the potential reversals in the future. Find out more details on how to use this indicator in the book by Larry Williams: "Trade Stocks and Commodities with the Insiders: Secrets of the COT Report", and also in the article Meta COT Project - New Horizons for CFTC Report Analysis in MetaTrader 4.

Below are the indicator parameters and their description:

  • Source of Report - COT report type. There are two types of report: 'Futures Only' and 'Futures And Options';
  • Group of Traders - Group of COT report participants. Includes the groups listed above;
  • Release Day - set the day to refresh the indicator. At the default value, 'Release by Friday', the indicator updates its values on Friday (day of data release). At the value 'Release by Thuesday' - on Tuesday (day of data receipt).
  • DataType - select data to plot the indicator. At the default value, 'Contracts of Traders', the indicator calculates its values based on the number of contracts, at the value 'Number of Traders' - based on the number of traders.
  • Subgroup of Traders - Subgroup of the participants. Divided into All, Old and Other;
  • Auto Detect Report Name - If this parameter is set to 'true', the indicator automatically downloads the report, corresponding to the market symbol it is running on. If no report corresponding to the current symbol could be identified, then the default report is downloaded, that is specified in the Report Name parameter;
  • Report Name - The name of the report to download if the Auto Detect Report Name parameter is set to 'false'. The name of one of the MetaCOT database files without its extension must be specified as the report name.
  • Mirror Mode - The mirror mode of the indicator, if true, the indicator maximums become minimums, and minimums become maximums.

Since the indicator displays the "raw" data published in the COT report, it can also be used for building your own derived indicators and analytical tools. In addition, it can be combined with other indicators of the MetaCOT series, also to display several participant groups in one common subwindow of the indicator.

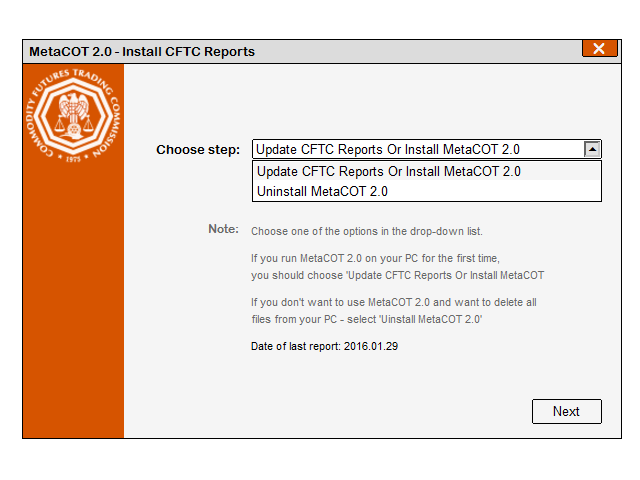
The indicator operation requires the CFTC reports to be downloaded and installed on your computer, which can be done with a special report installation utility - MetaCOT 2 Install CFTC Reports MT4.

More details on the description of the indicator settings can be found in the blog "MetaCOT 2: Settings and Possibility".

Produtos recomendados
MetaCOT 2 is a set of indicators and specialized utilities for the analysis of the U.S. Commodity Futures Trading Commission reports. Thanks to the reports issued by the Commission, it is possible to analyze the size and direction of the positions of the major market participants, which brings the long-term price prediction accuracy to a new higher-quality level, inaccessible to most traders. The indicator of the net positions of the market participants displays the difference between the long a
MetaCOT 2 is a set of indicators and specialized utilities for the analysis of the U.S. Commodity Futures Trading Commission reports. Thanks to the reports issued by the Commission, it is possible to analyze the size and direction of the positions of the major market participants, which brings the long-term price prediction accuracy to a new higher-quality level, inaccessible to most traders. These indicators, related to the fundamental analysis, can also be used as an effective long-term filter
Owl smart levels
Sergey Ermolov
4.34 (35)
Versão MT5  |  FAQ O   Indicador Owl Smart Levels   é um sistema de negociação completo dentro de um indicador que inclui ferramentas populares de análise de mercado, como   fractais avançados de Bill Williams , Valable ZigZag que constrói a   estrutura de onda correta   do mercado e   níveis de Fibonacci que marcam os níveis exatos de entrada no mercado e lugares para obter lucros. Descrição detalhada da estratégia Instruções para trabalhar com o indicador Consultor de negociação Owl Helper Ch
VR Cub
Vladimir Pastushak
VR Cub é um indicador para obter pontos de entrada de alta qualidade. O indicador foi desenvolvido para facilitar cálculos matemáticos e simplificar a busca por pontos de entrada em uma posição. A estratégia de negociação para a qual o indicador foi escrito tem provado a sua eficácia há muitos anos. A simplicidade da estratégia de negociação é a sua grande vantagem, o que permite que até mesmo os comerciantes novatos negociem com sucesso com ela. VR Cub calcula os pontos de abertura de posição e
MetaCOT 2 is a set of indicators and specialized utilities for the analysis of the U.S. Commodity Futures Trading Commission reports. Thanks to the reports issued by the Commission, it is possible to analyze the size and direction of the positions of the major market participants, which brings the long-term price prediction accuracy to a new higher-quality level, inaccessible to most traders. These indicators, related to the fundamental analysis, can also be used as an effective long-term filter
We present you the indicator "Candle closing counter", which will become your indispensable assistant in the world of trading. That’s why knowing when the candle will close can help: If you like to trade using candle patterns, you will know when the candle will be closed. This indicator will allow you to check if a known pattern has formed and if there is a possibility of trading. The indicator will help you to prepare for market opening and market closure. You can set a timer to create a p
Bintang Binary R2
Anthonius Soruh
5 (2)
Bintang Binary Indicator work all pairs Time Frame : M5 Expaired : 1 Candle No Repaint, No Delay and Alerts Use manual and auto trading  Easy to use Trial Version, Rent Version and Full Version avaliable Trial Version >>> download here  https://www.mql5.com/en/market/product/54602 Trial Version not have Alerts Rent version 1 month, 3 month, 6 month, 9 month, and 1 years Auto trading is better use MT2 Trading Platform (Contact me for discount 10 % MT2 trading licence) Work good for forex trading
Master Scalping M1 é um indicador inovador que usa um algoritmo para determinar a tendência de forma rápida e precisa. O indicador calcula o tempo de abertura e fechamento de posições, os algoritmos do indicador permitem encontrar os momentos ideais para entrar em uma negociação (comprar ou vender um ativo), o que aumenta o sucesso das transações para a maioria dos traders. Benefícios do indicador: Fácil de usar, não sobrecarrega o gráfico com informações desnecessárias. Pode ser usado como filt
Super Reversal Pattern
Parfait Mujinga Ndalika
Super Reversal Pattern Indicator Unlock the power of advanced pattern recognition with our Super Reversal Pattern Indicator. Designed for traders seeking precision and reliability, this indicator identifies one of the most effective reversal patterns in technical analysis, offering a significant edge in your trading strategy. Key Features: Non-Repainting Accuracy: Enjoy the confidence of non-repainting technology. Once a Super Reversal Pattern is detected, it remains static, providing consis
Strong Retracement Points Pro demo edition! SRP (Strong Retracement/Reversal Points) is a powerful and unique support and resistance indicator. It displays the closest important levels which we expect the price retracement/reversal! If all level are broken from one side, it recalculates and draws new support and resistance levels, so the levels might be valid for several days depending on the market! If you are still hesitating to start using this wonderful tool, you can check this link to see h
Supply Demand Zones indicator for possible BUY / Sell Zones based on smart volumes indicator two levels of buy/Sell Zones : Main BUY/SELL area  SUPPLY area in Red DEMAND area in Green your strategy is to follow generated Arrows : 1- you can Buy when price is Closed above a green BUY area and above high of previous candle  2- you can Sell when price is Closed below  a red  SELL area   and below low of previous candle  Also, a separate indicator window for SMART CANDLES used to detect the Big Supp
Cosmic Diviner X Planet
Olena Kondratenko
4 (2)
This unique multi-currency strategy simultaneously determines the strength of trends and market entry points, visualizing this using histograms on the chart. The indicator is optimally adapted for trading on the timeframes М5, М15, М30, Н1. For the convenience of users, the indicator renders the entry point (in the form of an arrow), recommended take profit levels (TP1, TP2 with text labels) and the recommended Stop Loss level. The take profit levels (TP1, TP2) are automatically calculated for
Buy and sell zones
Evgeniy Zhdan
5 (2)
Indicador para determinar o plano e a tendência. Se o preço estiver abaixo de qualquer um dos dois histogramas e duas linhas (vermelha e azul), esta é uma zona de venda. Ao adquirir esta versão do indicador, versão MT4 para uma conta real e uma demo - como um presente (para receber, escreva-me uma mensagem privada)! Se o preço estiver acima de qualquer um dos dois histogramas e duas linhas (vermelha e azul), esta é uma zona de compra. Versão MT4:   https://www.mql5.com/en/market/product/3793
Rira Renko
Vitor Palmeira Abbehusen
RENKO on Time Chart This indicator is an enhanced Renko, so you can watch the Renko bricks on the chart to understand price movement more clearly the other improvement is automated box size according to ATR (Average True Range) period you can set the ATR number as you want and the box size of Renko changes automatically based on price movement Inputs Mode: Box size is the input to specify the size of the Renko box you want to print on the chart. This input lets you choose the fixed b
Trend Ray
Andriy Sydoruk
The indicator shows the potential trend direction by cyclical-wave dependence. Thus, all the rays of the intersection will be optimal rays, in the direction of which the price is expected to move, taking into account the indicator period. Rays can be used as a direction for potential market movement. But we must not forget that the approach must be comprehensive, the indicator signals require additional information to enter the market.
Trend PA
Mikhail Nazarenko
5 (3)
The Trend PA indicator uses   Price Action   and its own filtering algorithm to determine the trend. This approach helps to accurately determine entry points and the current trend on any timeframe. The indicator uses its own algorithm for analyzing price changes and Price Action. Which gives you the advantage of recognizing, without delay, a new nascent trend with fewer false positives. Trend filtering conditions can be selected in the settings individually for your trading style. The indicator
Blahtech Market Profile
Blahtech Limited
4.56 (16)
Was: $249  Now: $99   Market Profile defines a number of day types that can help the trader to determine market behaviour. A key feature is the Value Area, representing the range of price action where 70% of trading took place. Understanding the Value Area can give traders valuable insight into market direction and establish the higher odds trade. It is an excellent addition to any system you may be using. Blahtech Limited presents their Market Profile indicator for the MetaTrader community. Ins
Infinity Trend Pro
Yaroslav Varankin
1 (1)
This is a trend indicator without redrawing Developed instead of the binary options strategy (by the color of the Martingale candlestick) Also works well in forex trading When to open trades (binary options) A signal will appear in the place with a candle signaling the current candle It is recommended to open a deal for one candle of the current timeframe M1 and M5 When a blue dot appears, open a deal up When a red dot appears, open a trade down. How to open trades on Forex. When a signal is rec
GeoWprPro
Georgij Komarov
WPR by Profile, or WPR for Professionals Geo_WprPro is one of the well-known currency profile indicators. It simultaneously displays two WPR indicators with different parameters in the matrix form on all timeframes of multiple currency pairs forming the currency profile . As follows from the description, " WPR is a leading indicator that often goes ahead of the price chart. The oscillator frequently reaches extreme values before the price reversal as if anticipating that event: it almost always
Os indicadores [ZhiBiCCI] são adequados para todo o ciclo de uso e também são adequados para todas as variedades do mercado. [ZhiBiCCI] Linha sólida verde é uma inversão da divergência de alta. A linha pontilhada verde é uma divergência de alta clássica. [ZhiBiCCI] A linha sólida para o vermelho é uma divergência de baixa reversa. A linha pontilhada vermelha é uma divergência clássica de baixa. [ZhiBiCCI] pode ser definido nos parâmetros (Alerta, Enviar e-mail, Enviar notificação), definid
TWO PAIRS SQUARE HEDGE METER INDICATOR Try this brilliant 2 pairs square indicator It draws a square wave of the relation between your two inputs symbols when square wave indicates -1 then it is very great opportunity to SELL pair1 and BUY Pair2 when square wave indicates +1 then it is very great opportunity to BUY pair1 and SELL Pair2 the inputs are : 2 pairs of symbols         then index value : i use 20 for M30 charts ( you can try other values : 40/50 for M15 , : 30 for M30 , : 10 for H1 ,
RaysFX Supertrend Bar RaysFX Supertrend Bar è un indicatore personalizzato per MetaTrader 4. Utilizza l'indice di canale delle materie prime (CCI) per generare segnali di trading. L'indicatore mostra dei puntini in una finestra separata sotto il grafico principale per indicare i segnali di trading. Caratteristiche principali: Calcola il CCI per diversi periodi temporali. Visualizza puntini per indicare i segnali di trading. Permette all'utente di modificare i periodi temporali e la distanza tra
O indicador cria cotações atuais, que podem ser comparadas com as históricas e, com base nisso, fazer uma previsão do movimento dos preços. O indicador possui um campo de texto para navegação rápida até a data desejada. Opções: Símbolo - seleção do símbolo que o indicador exibirá; SymbolPeriod - seleção do período do qual o indicador coletará dados; IndicatorColor - cor do indicador; HorisontalShift - deslocamento das cotações desenhadas pelo indicador pelo número especificado de
"Adjustable Fractals" - é uma versão avançada do indicador fractal, uma ferramenta de negociação muito útil! Como sabemos, o indicador padrão fractals mt4 não possui nenhuma configuração - isso é muito inconveniente para os traders O Fractals Ajustáveis resolveu esse problema - possui todas as configurações necessárias: Período ajustável do indicador (valores recomendados - acima de 7) Distância ajustável dos máximos/mínimos do preço Design ajustável de setas fractais // Mais excelentes Exp
This indicator is another variant of the famous powerful indicator Fibonacci-SS https://www.mql5.com/en/market/product/10136 but has different behaviour in placing Pending Order and TP Line. Automatically places Fibonacci retracement lines from the last highest and lowest visible bars on the chart with: An auto Pending Order (Buy/Sell). Taking Profit 1, Taking Profit 2 is pivot point and Taking Profit 3 for extended reward opportunity. The best risk and reward ratio. Simple and powerful indica
Night ghost
Dmitriy Kashevich
Night Ghost - Indicador de seta para opções binárias. Este é um assistente confiável para você no futuro! - Sem redesenho no gráfico -Funciona muito bem em todos os pares de moedas! -Precisão do indicador de até 90% (especialmente à noite) -Não há necessidade de configurar por um longo tempo (Configurar perfeitamente para Opções Binárias) - Sem sinais de atraso - O aparecimento de um sinal na vela atual -Perfeito para o período M1 (não mais!) - Cor de vela amigável aos olhos
Gioteen Volatility Index (GVI)   - your ultimate solution to overcoming market unpredictability and maximizing trading opportunities. This revolutionary indicator helps you in lowering your losing trades due to choppy market movements. The GVI is designed to measure market volatility, providing you with valuable insights to identify the most favorable trading prospects. Its intuitive interface consists of a dynamic red line representing the volatility index, accompanied by blue line that indicat
Extremes Day
Aleksey Maltsev
v. 1.0 This indicator can show with maximum accuracy up to 1 bar the presence of a Maximum/minimum on the chart, regardless of the timeframe. It has a flexible configuration. You can use either one value on all TF, or you can use your own value on each TF individually. This indicator is already being improved and those who purchase it receive all updates for free. Next, it is planned to display an indication of the strength of the pivot point at each extremum (in % or in color drawing). It
Trendiness Index
Libertas LLC
5 (3)
"The trend is your friend" is one of the best known sayings in investing, because capturing large trendy price movements can be extremely profitable. However, trading with the trend is often easier said than done, because many indicators are based on price reversals not trends. These aren't very effective at identifying trendy periods, or predicting whether trends will continue. We developed the Trendiness Index to help address this problem by indicating the strength and direction of price trend
Mirror
Stanislav Korotky
This indicator predicts rate changes based on the chart display principle. It uses the idea that the price fluctuations consist of "action" and "reaction" phases, and the "reaction" is comparable and similar to the "action", so mirroring can be used to predict it. The indicator has three parameters: predict - the number of bars for prediction (24 by default); depth - the number of past bars that will be used as mirror points; for all depth mirroring points an MA is calculated and drawn on the ch
Os compradores deste produto também adquirem
Gann Made Easy
Oleg Rodin
4.86 (83)
Gann Made Easy é um sistema de negociação Forex profissional e fácil de usar, baseado nos melhores princípios de negociação usando a teoria do sr. W. D. Gann. O indicador fornece sinais precisos de COMPRA e VENDA, incluindo níveis de Stop Loss e Take Profit. Você pode negociar mesmo em movimento usando notificações PUSH. Entre em contato comigo após a compra! Vou compartilhar minhas dicas de negociação com você e ótimos indicadores de bônus de graça! Provavelmente você já ouviu muitas vezes sobr
- Real price is 80$ - 40% Discount ( It is 49$ now ) Contact me for instruction, add group and any questions! Related Product:  Bitcoin Expert , Gold Expert Introduction The breakout and retest strategy is traded support and resistance levels. it involves price breaking through a previous level.  The break and retest strategy is designed to help traders do two main things, the first is to avoid false breakouts. Many false breakouts start with a candlestick that breaks out of a level but ends wi
Gold Stuff
Vasiliy Strukov
4.89 (240)
Gold Stuff-um indicador de tendência projetado especificamente para o ouro, também pode ser usado em qualquer instrumento financeiro. O indicador não é redesenhado ou atrasado. O timeframe recomendado é H1. O EA Gold Stuff Expert Advisor está escrito neste indicador, você pode encontrá-lo no meu perfil. Importante! Entre em contato comigo imediatamente após a compra para obter instruções e bônus!  Você pode obter uma cópia gratuita do nosso indicador Strong Support e Trend Scanner, envie um
TPSpro RFI Levels
Roman Podpora
4.82 (22)
INSTRUÇÕES         Russo   -        ENG       R   ecomendado para uso com um indicador       -       TPSpro   TREND PRO -   Versão MT4         Um elemento-chave na negociação são as zonas ou níveis a partir dos quais as decisões de comprar ou vender um instrumento de negociação são tomadas. Apesar das tentativas dos principais participantes de esconder sua presença no mercado, eles inevitavelmente deixam rastros. Nossa tarefa era aprender como identificar esses rastros e interpretá-los corretame
FX Volume
Daniel Stein
4.58 (33)
Receba a sua atualização diária do mercado com detalhes e screenshots através do nosso Morning Briefing aqui no mql5 e no Telegram ! O Volume FX é o PRIMEIRO e ÚNICO indicador de volume que fornece uma visão REAL do sentimento do mercado do ponto de vista de um corretor. Ele fornece uma visão incrível de como os participantes do mercado institucional, como corretores, estão posicionados no mercado Forex, muito mais rápido do que os relatórios COT. Ver essas informações diretamente no seu gráfi
TPSproTREND PrO
Roman Podpora
4.79 (19)
TPSpro TREND PRO   é um indicador de tendência que analisa automaticamente o mercado e fornece informações sobre a tendência e cada uma de suas mudanças, além de dar sinais para entrar em negociações sem redesenhar! O indicador utiliza cada vela, analisando-as separadamente. referindo-se a diferentes impulsos - impulso para cima ou para baixo. Pontos de entrada exatos em transações de moedas, criptomoedas, metais, ações, índices! Versão MT5                   DESCRIÇÃO COMPLETA DO INDICADOR    
Atomic Analyst
Issam Kassas
5 (2)
Primeiramente, vale ressaltar que este Indicador de Negociação não repinta, não redesenha e não apresenta atrasos, tornando-o ideal tanto para negociação manual quanto automatizada. Manual do utilizador: configurações, entradas e estratégia. O Analista Atômico é um Indicador de Ação de Preço PA que utiliza a força e o momentum do preço para encontrar uma vantagem melhor no mercado. Equipado com filtros avançados que ajudam a remover ruídos e sinais falsos, e aumentam o potencial de negociação.
Trend Punch
Mohamed Hassan
4.95 (19)
This indicator is unstoppable when combined with our other indicator called  Support & Resistance . After purchase, send us a message and you will get it   for  FREE as a BONUS! Introducing Trend Punch , the revolutionary forex trend indicator that will transform the way you trade! Trend Punch is uniquely designed to provide precise buy and sell arrows during strong market trends, making your trading decisions clearer and more confident. Whether you're trading major currency pairs or exotic sym
FX Power MT4 NG
Daniel Stein
5 (13)
Receba a sua atualização diária do mercado com detalhes e screenshots através do nosso Morning Briefing aqui no mql5 e no Telegram ! O FX Power MT4 NG é a próxima geração do nosso medidor de força de moeda muito popular de longa data, o FX Power. E o que é que este medidor de força da próxima geração oferece? Tudo o que adorou no FX Power original MAIS Análise de força GOLD/XAU Resultados de cálculo ainda mais precisos Períodos de análise configuráveis individualmente Limite de cálculo personal
LEIA AS INFORMAÇÕES ABAIXO ANTES DE COMPRAR O PRODUTO! Apollo Pips PLUS SP é um produto único! É PARA QUEM QUER ADQUIRIR MEU NOVO INDICADOR "APOLLO PIPS" MAIS BÔNUS "SUPER PACK" COM ACESSO A TODOS OS MEUS INDICADORES DE NEGOCIAÇÃO! Ao adquirir o produto Apollo Pips PLUS SP você está na verdade adquirindo uma versão absolutamente nova do meu indicador Apollo Pips. Esta versão do indicador possui um algoritmo aprimorado e um parâmetro fácil de usar que lhe dá a oportunidade de usar o indicador em
Trend Screener
STE S.S.COMPANY
4.81 (88)
Indicador de tendência, solução única inovadora para negociação e filtragem de tendências com todos os recursos de tendências importantes construídos dentro de uma ferramenta! É um indicador multi-timeframe e multi-moedas 100% sem repintura que pode ser usado em todos os símbolos/instrumentos: forex, commodities, criptomoedas, índices e ações. OFERTA POR TEMPO LIMITADO: O indicador Support and Resistance Screener está disponível por apenas US$ 50e vitalício. (Preço original US$ 250) (oferta este
Scalper Inside PRO
Alexey Minkov
4.73 (56)
An exclusive indicator that utilizes an innovative algorithm to swiftly and accurately determine the market trend. The indicator automatically calculates opening, closing, and profit levels, providing detailed trading statistics. With these features, you can choose the most appropriate trading instrument for the current market conditions. Additionally, you can easily integrate your own arrow indicators into Scalper Inside Pro to quickly evaluate their statistics and profitability. Scalper Inside
Gann Swing Structure
Kirill Borovskii
5 (1)
This indicator is based on the mathematics of the great trader W.D. Ganna. With its help, you can easily find strong levels by analyzing swings to find the optimal entry point. The indicator works on all instruments and all timeframes. The indicator is fully manual and has control buttons. All you need to do is press the NEW button, a segment will appear, which you can place on any movement, swing or even 1 candle that you want to analyze. By placing the segment, press the OK button. A grid (th
Currency Strength Exotics
Bernhard Schweigert
4.87 (30)
ACTUALMENTE 20% DE DESCONTO ! A melhor solução para qualquer novato ou comerciante especializado! Este Indicador é especializado para mostrar a força da moeda para quaisquer símbolos como Pares Exóticos de Commodities, Índices ou Futuros. É o primeiro do seu género, qualquer símbolo pode ser adicionado à 9ª linha para mostrar a verdadeira força da moeda de Ouro, Prata, Petróleo, DAX, US30, MXN, TRY, CNH etc. Esta é uma ferramenta de negociação única, de alta qualidade e acessível, porque in
Antes de tudo, vale ressaltar que esta Ferramenta de Negociação é um Indicador Não Repintante, Não Redesenhante e Não Atrasado, o que a torna ideal para negociação profissional. Curso online, manual do utilizador e demonstração. O Indicador de Conceitos de Ação de Preço Inteligente é uma ferramenta muito poderosa tanto para traders novos quanto experientes. Ele combina mais de 20 indicadores úteis em um único, combinando ideias avançadas de negociação como Análise do Trader do Círculo Interno e
ICT, SMC, SMART MONEY CONCEPTS, SMART MONEY, Smart Money Concept, Support and Resistance, Trend Analysis, Price Action, Market Structure, Order Blocks, BOS/CHoCH,   Breaker Blocks ,  Momentum Shift,   Supply&Demand Zone/Order Blocks , Strong Imbalance, HH/LL/HL/LH,    Fair Value Gap, FVG,  Premium  &   Discount   Zones, Fibonacci Retracement, OTE, Buy Side Liquidity, Sell Side Liquidity, BSL/SSL Taken, Equal Highs & Lows, MTF Dashboard, Multiple Time Frame, BigBar, HTF OB, HTF Market Structure, 
Gold Channel   é um indicador baseado na volatilidade, desenvolvido com um algoritmo de tempo especifico para o par XAUUSD que consiste em encontrar possíveis correções no mercado. Este indicador mostra duas linhas exteriores, uma interior (linha de retração) e um sinal de seta, onde a teoria do canal consiste em ajudar a identificar condições de sobrecompra e sobrevenda no mercado. O preço do mercado cairá geralmente entre os limites do canal. Se os preços tocarem ou se moverem para fora do can
Torne-se um Negociador Breaker e lucre com as mudanças na estrutura do mercado à medida que o preço reverte. O indicador de quebra de bloco de pedidos identifica quando uma tendência ou movimento de preço está chegando à exaustão e pronto para reverter. Ele o alerta sobre mudanças na estrutura do mercado, que normalmente ocorrem quando uma reversão ou uma grande retração está prestes a ocorrer. O indicador usa um cálculo proprietário que identifica rupturas e momento do preço. Toda vez que
Trend Pulse
Mohamed Hassan
5 (4)
Please contact me after purchase to immediately get your PDF strategy + documentation for Trend Pulse !  Introducing Trend Pulse , a unique and robust indicator capable of detecting bullish, bearish, and even ranging trends! Trend Pulse uses a special algorithm to filter out market noise with real precision. If the current symbol is moving sideways, Trend Pulse will send you a ranging signal, letting you know that it's not a good time to enter a trade. This excellent system makes Trend Pulse
Dynamic Forex28 Navigator
Bernhard Schweigert
5 (1)
Dynamic Forex28 Navigator - A ferramenta de negociação Forex de última geração. ATUALMENTE 49% DE DESCONTO. Dynamic Forex28 Navigator é a evolução dos nossos indicadores populares de longa data, combinando o poder de três em um: Indicador Advanced Currency Strength28 (695 avaliações) + Advanced Currency IMPULSE com ALERTA (520 avaliações) + Sinais CS28 Combo (Bônus). Detalhes sobre o indicador https://www.mql5.com/en/blogs/post/758844 O que o Next-Generation Strength Indicator oferece?  T
Enigmera
Ivan Stefanov
5 (3)
ENIGMERA: O núcleo do mercado https://www.enigmera.com Introdução Este indicador e sistema de negociação é uma abordagem notável aos mercados financeiros. ENIGMERA utiliza os ciclos fractais para calcular com precisão os níveis de suporte e resistência. Mostra a autêntica fase de acumulação e dá direcções e objectivos.  Um sistema que funciona quer estejamos numa tendência ou numa correção.  Como é que funciona? O ENIGMERA é composto por três linhas: a linha de suporte/resistência, a linha
Stratos Pali
Michela Russo
5 (1)
Stratos Pali Indicator   is a revolutionary tool designed to enhance your trading strategy by accurately identifying market trends. This sophisticated indicator uses a unique algorithm to generate a complete histogram, which records when the trend is Long or Short. When a trend reversal occurs, an arrow appears, indicating the new direction of the trend. Important Information Revealed Leave a review and contact me via mql5 message to receive My Top 5 set files for Stratos Pali at no cost! D
Este painel é uma ferramenta de alerta para uso com o indicador de reversão da estrutura de mercado. Seu objetivo principal é alertá-lo para oportunidades de reversão em prazos específicos e também para os novos testes dos alertas (confirmação) como o indicador faz. O painel foi projetado para ficar em um gráfico por conta própria e funcionar em segundo plano para enviar alertas sobre os pares e prazos escolhidos. Ele foi desenvolvido depois que muitas pessoas solicitaram um traço para monitora
Actualmente 20% OFF ! A melhor solução para qualquer novato ou comerciante especializado! Este software de painel de instrumentos está a funcionar em 28 pares de moedas. É baseado em 2 dos nossos principais indicadores (Advanced Currency Strength 28 e Advanced Currency Impulse). Dá uma grande visão geral de todo o mercado Forex. Mostra valores avançados de força da moeda, velocidade de movimento da moeda e sinais para 28 pares de divisas em todos os (9) períodos de tempo. Imagine como a sua
MetaBands M4
Vahidreza Heidar Gholami
5 (2)
MetaBands utiliza algoritmos poderosos e únicos para desenhar canais e detectar tendências, a fim de fornecer aos traders pontos potenciais para entrar e sair de negociações. É um indicador de canal mais um indicador de tendência poderoso. Inclui diferentes tipos de canais que podem ser mesclados para criar novos canais simplesmente usando os parâmetros de entrada. O MetaBands usa todos os tipos de alertas para notificar os usuários sobre eventos de mercado. Recursos Suporta a maioria dos algori
Shepherd Harmonic Pattern
Abdullah Alrai
4.65 (49)
Este indicador detectará padrões harmônicos desenhados no gráfico por métodos manuais e automáticos. Você pode ver o manual do usuário neste link: Adicione sua avaliação e entre em contato conosco para obtê-lo Existe uma versão gratuita para experimentar este produto no mt4. Você pode usá-lo para detectar padrões de Gartley e Nenstar: https://www.mql5.com/en/market/product/30181 Você pode comprar a versão completa do MT4 em: https://www.mql5.com/en/market/product/15212 Notas O indicador possui u
O sistema PRO Renko é um sistema de negociação altamente preciso especialmente concebido para a negociação de gráficos RENKO. Trata-se de um sistema universal que pode ser aplicado a vários instrumentos de negociação. O sistema neutraliza eficazmente o chamado ruído de mercado, dando-lhe acesso a sinais de inversão precisos. O indicador é muito fácil de usar e tem apenas um parâmetro responsável pela geração de sinal. Você pode facilmente adaptar a ferramenta a qualquer instrumento de negoc
Scalper Vault
Oleg Rodin
5 (27)
Scalper Vault é um sistema profissional de escalpelamento que fornece tudo o que você precisa para um escalpelamento bem-sucedido. Este indicador é um sistema de negociação completo que pode ser usado por comerciantes de forex e opções binárias. O período de tempo recomendado é M5. O sistema fornece sinais de seta precisos na direção da tendência. Ele também fornece sinais superiores e inferiores e níveis de mercado Gann. Os indicadores fornecem todos os tipos de alertas, incluindo notificações
Apresentamos o ON Trade Waves Patterns Harmonic Elliot Wolfe, um indicador avançado projetado para detectar diversos tipos de padrões no mercado, usando métodos manuais e automáticos. Aqui está como ele funciona: Padrões Harmônicos: Este indicador pode identificar padrões harmônicos que aparecem em seu gráfico. Esses padrões são essenciais para traders que praticam a teoria de negociação harmônica, conforme popularizada no livro de Scott Carney "Harmonic Trading vol 1 e 2". Seja desenhando-os m
Apresentando       Quantum Trend Sniper Indicator   , o inovador Indicador MQL5 que está transformando a maneira como você identifica e negocia as reversões de tendência! Desenvolvido por uma equipe de traders experientes com experiência comercial de mais de 13 anos,       Indicador de Atirador de Tendência Quântica       foi projetado para impulsionar sua jornada de negociação a novos patamares com sua forma inovadora de identificar reversões de tendência com precisão extremamente alta. ***C
Mais do autor
MetaCOT 2 CFTC ToolBox is a special library that provides access to CFTC (U.S. Commodity Futures Trading Commission) reports straight from the MetaTrader terminal. The library includes all indicators that are based on these reports. With this library you do not need to purchase each MetaCOT indicator separately. Instead, you can obtain a single set of all 34 indicators including additional indicators that are not available as separate versions. The library supports all types of reports, and prov
MetaCOT 2 CFTC ToolBox MT5
Vasiliy Sokolov
3.67 (3)
MetaCOT 2 CFTC ToolBox is a special library that provides access to CFTC (U.S. Commodity Futures Trading Commission) reports straight from the MetaTrader terminal. The library includes all indicators that are based on these reports. With this library you do not need to purchase each MetaCOT indicator separately. Instead, you can obtain a single set of all 34 indicators including additional indicators that are not available as separate versions. The library supports all types of reports, and prov
Call/Put Ratio is one of the most well-known indicators of the market sentiment. The indicator has been developed by Martin Zweig. It is based on real volumes of the CBOE option market. As we know, a Call option gives its owner the right to buy the underlying asset at a predetermined price. A Put option gives the right to sell it. Thus, increasing volumes for Call options indicate the increasing demand. The growth of Put option volumes shows that supply starts exceeding demand. If we divide the
MetaCOT 2 is a set of indicators and specialized utilities for the analysis of the U.S. Commodity Futures Trading Commission reports. Thanks to the reports issued by the Commission, it is possible to analyze the size and direction of the positions of the major market participants, which brings the long-term price prediction accuracy to a new higher-quality level, inaccessible to most traders. These indicators, related to the fundamental analysis, can also be used as an effective long-term filter
Trade in the opposite directions with HedgeTerminal HedgeTerminal is a full-featured trading terminal inside MetaTrader 5. This is a graphic panel resembling MetaTrader 4 terminal. It allows you to track oppositely directed positions in the manner it is possible in MetaTrader 4. In other words, we can open unlimited number of positions on a single symbol even if positions are in complete or partial hedge (lock). Thus, you can maintain long and short positions simultaneously, which is impossible
FREE
The MetaCOT 2 CFTC ToolBox Demo is a special version of the fully functional MetaCOT 2 CFTC ToolBox MT5 library. The demo version has no restrictions, however, unlike the fully functional version, it outputs data with a delay. The library provides access to the CFTC (U.S. Commodity Futures Trading Commission) reports straight from the MetaTrader terminal. The library includes all indicators that are based on these reports. With this library you do not need to purchase each MetaCOT indicator sepa
FREE
MetaCOT 2 is a set of indicators and specialized utilities for the analysis of the U.S. Commodity Futures Trading Commission reports. Thanks to the reports issued by the Commission, it is possible to analyze the size and direction of the positions of the major market participants, which brings the long-term price prediction accuracy to a new higher-quality level, inaccessible to most traders. These indicators, related to the fundamental analysis, can also be used as an effective long-term filter
MetaCOT 2 is a set of indicators and specialized utilities for the analysis of the U.S. Commodity Futures Trading Commission reports. Thanks to the reports issued by the Commission, it is possible to analyze the size and direction of the positions of the major market participants, which brings the long-term price prediction accuracy to a new higher-quality level, inaccessible to most traders. The indicator of the net positions of the market participants displays the difference between the long a
MetaCOT 2 is a set of indicators and specialized utilities for the analysis of the U.S. Commodity Futures Trading Commission reports. Thanks to the reports issued by the Commission, it is possible to analyze the size and direction of the positions of the major market participants, which brings the long-term price prediction accuracy to a new higher-quality level, inaccessible to most traders. These indicators, related to the fundamental analysis, can also be used as an effective long-term filter
FREE
MetaCOT 2 CFTC ToolBox Demo is a special demo version of a full-featured library MetaCOT 2 CFTC ToolBox MT4 . The demo version does not have any limitations, but it outputs data with a delay in contrast to the full version. The library provides access to the CFTC reports (U.S. Commodity Futures Trading Commission) reports straight from the MetaTrader terminal. The library includes all indicators that are based on these reports. With this library you do not need to purchase each MetaCOT indicator
FREE
Movement Index was first proposed by Steve Breeze and described in his book "The Commitments of Traders Bible: How To Profit from Insider Market Intelligence". It quickly gained popularity among the traders who analyze the CFTC reports, and became a classic and a unique tool in many aspects, which can be used for finding rapid changes, leading to an imbalance of positions between the market participants. The indicator displays the change in the relative position of the participants as a histogra
CME Daily Bullettin Open Interest provides the data on the open interest of futures contracts on the CME for your charts. Open interest is a special type of volume, that shows how many contracts are being held by the market participants at each moment of time. This type of information is available only in futures markets. But now, with this indicator, you can also analyze these data when trading the spot markets, such as FOREX. In addition, the indicator provides data on the open interest for th
Call/Put Ratio is one of the most well-known indicators of the market sentiment. The indicator has been developed by Martin Zweig. It is based on real volumes of the CBOE option market. As we know, a Call option gives its owner the right to buy the underlying asset at a predetermined price. A Put option gives the right to sell it. Thus, increasing volumes for Call options indicate the increasing demand. The growth of Put option volumes shows that supply starts exceeding demand. If we divide the
Filtro:
Ali Sharifazadeh
135
Ali Sharifazadeh 2018.06.02 16:10 
 

I have bough ALL of Vasiliy's COT indicators for MT4. In the beginning they were working nicely but from February I can't get the expert to update the data and Vasiliy is not responding. Thus I give this a 1-star until I receive a meaningful response from him.

Serge Charbit
209
Serge Charbit 2017.11.20 21:22 
 

MAY IT POSSIBLE TO SPEAK WITH YOU ABOUT THIS INDICATOR I LEAVE YOU A MESSAGE BUT NO ANSWER ? I BUY ALSO THE LAST ONE PUT :CALL RATIO PROBLEME IMPOSSIBLE TO HAVE TWO TIMES IN A SAME GRAPHIQUE AND FOR ABSOLUTE SINCE A COOPLE STAY FLAT ? I BOUGHT FROM YOU FOR INDICATORS ? PLEASE

SERGE

Responder ao comentário
Versão 2.61 2023.08.07
- The assembly is made with the latest version of the MQL compiler;
- Added new symbols and continues rules for new versions of instrument names.
Versão 2.53 2018.09.11
- Fix delay error in strategy tester
Versão 2.52 2018.08.28
- Fix empty indicator in strategy tester
Versão 2.51 2018.08.24
Version 2.51 (2018.08.16)
- Starting from this version, a new utility for downloading reports is available - MetaCOT Data Provider.
This utility work as Win32 system tray application and download CFTC reports in background mode. If you
use this utility you can make auto update reports from MetaCOT indicators and don't use 'MetaCOT Install CFTC
Reports'.
- 'MetaCOT CFTC Install Reports' tool was upgraded. Now, it contains the new help system. Its general window also was
changed. Now, this window contains information about the status of the connection, a status of the database
(outdated or not) and status of MetaCOT Data Provider Win32 until (install or not).
If this util available 'MetaCOT CFTC Install Reports'
load local files and parse it.
- MetaCOT indicators and Toolbox Library began to contain inner COT data for the most basic symbols. This data can
use if MetaCOT wasn't installed. This option is useful in the strategy tester if the installation was not performed.
- All indicators began to contain the system of update data (mini tool based on 'MetaCOT CFTC Install Reports').
If you use MetaCOT Data Provider utility, you can update reports automatically and don't use 'MetaCOT Install CFTC
Reports'. For this case, you need switch on new parameter 'AutoUpdate' in position true.
- Added parameter 'Not Show Continues Data'. If this flag is enabled - last unknowing values are empty. Otherwise
last unknowing values continue.
- Added control for bad combination parameter. If you select nonreportable group of trades and also select Data Type
as 'Number of Traders' you will see message 'Incorrect combination of parameters'.
- Removed parameter 'Data Type' for Largest COT indicators group. This parameter not effect for largest traders.
- Fixed a bug in strategy tester. When any indicators were started in strategy tester it's valued was intermittent.
- Fixed a bug that caused an error 'invalid pointer access' in some cases
- Now all MetaCOT indicators and ToolBox Library contain additional GUI forms and MessageBox for more user friendly.
The work of indicators has become clearer.
Versão 2.13 2017.05.30
- Fixed bug: in the latest version of the indicator, the "Futures Only" report was actually displayed regardless of the report type specified ("Futures Only" or "Futures And Options")
- Internal fixes related to the releases of new versions of MetaTrader and MQL. MetaCOT now fully complies with the new language standard.
Versão 2.12 2017.04.07
Version 2.11
- Fixed the error that caused the data to be redownloaded, even if the data have been downloaded earlier. This error caused a significant slowdown of the indicator operation in the strategy tester and loaded the computer hard drive.
- Now, all indicators are compiled from the source codes of MetaCOT ToolBox. A common code base prevents errors in individual indicators and further synchronizes the code management.
Versão 2.4 2016.05.18
- Normalized the indicator parameters. Now, the main parameters are at the top. Fine tuning and extra features parameters are at the bottom. These additional parameters form PROFESSIONAL SETTINGS group.
- Fixed internal array initialization. In previous versions, this sometimes caused errors hiding the indicators from a chart.
- Now, oscillators automatically scale within -10 to +110%. This helps to set up more correct view of the indicators right at the first start of the indicator since the lines do not cross the top and bottom window borders.
- Switched to classic display of the indicator levels. Now, it is possible to place them at arbitrary levels, as well as change their colors and line types.
Versão 2.3 2016.04.28
Version 2.03
- Added new parameter: 'Release Day'. It takes two values: 'Release by Tuesday' - new values of the indicator appear every Tuesday, and 'Release by Friday' (default value), - new values of the indicator appear ever Friday.
- Added new parameter: 'Data Type'. It allows to select the data source. At the value 'Contracts of Traders' (default value) the indicator downloads the information on the number of traders' contracts. At the value 'Number of Traders' the indicator downloads the information on the number of traders holding the corresponding position.
- Added an error message, displayed in the indicator window, if the data with the CFTC reports were not found or if 'MetaCOT CFTC Install Reports' is not installed.
- Fixed the indicator crash, which occurred when attempting to download a non-existing report.
Versão 2.1 2016.02.16
- Significantly increased the calculation speed of the indicator. In the previous version the operation slowdowns were observed on the smaller timeframes.
- Fixed indicator reset error after the terminal restarts. Now the restart of the terminal runs smoothly.
- Fixed the indicator operation in the strategy tester. Now the indicator is plotted dynamically in the visualization mode.
- Improved the indicator value update system. Now, if the reports are updated via CFTC Reports, the indicator automatically downloads the new values, and there will be no need to restart the indicator.