• Visão global
  • Comentários
  • Discussão

Market Pulse Indicator

The Market Pulse is a versatile MT5 indicator that combines multiple market metrics into a single tool to display trend direction, momentum, volume flows and key price levels. Its goal is to give traders clear signals and visual aids for identifying entry and exit points.


Indicator overview

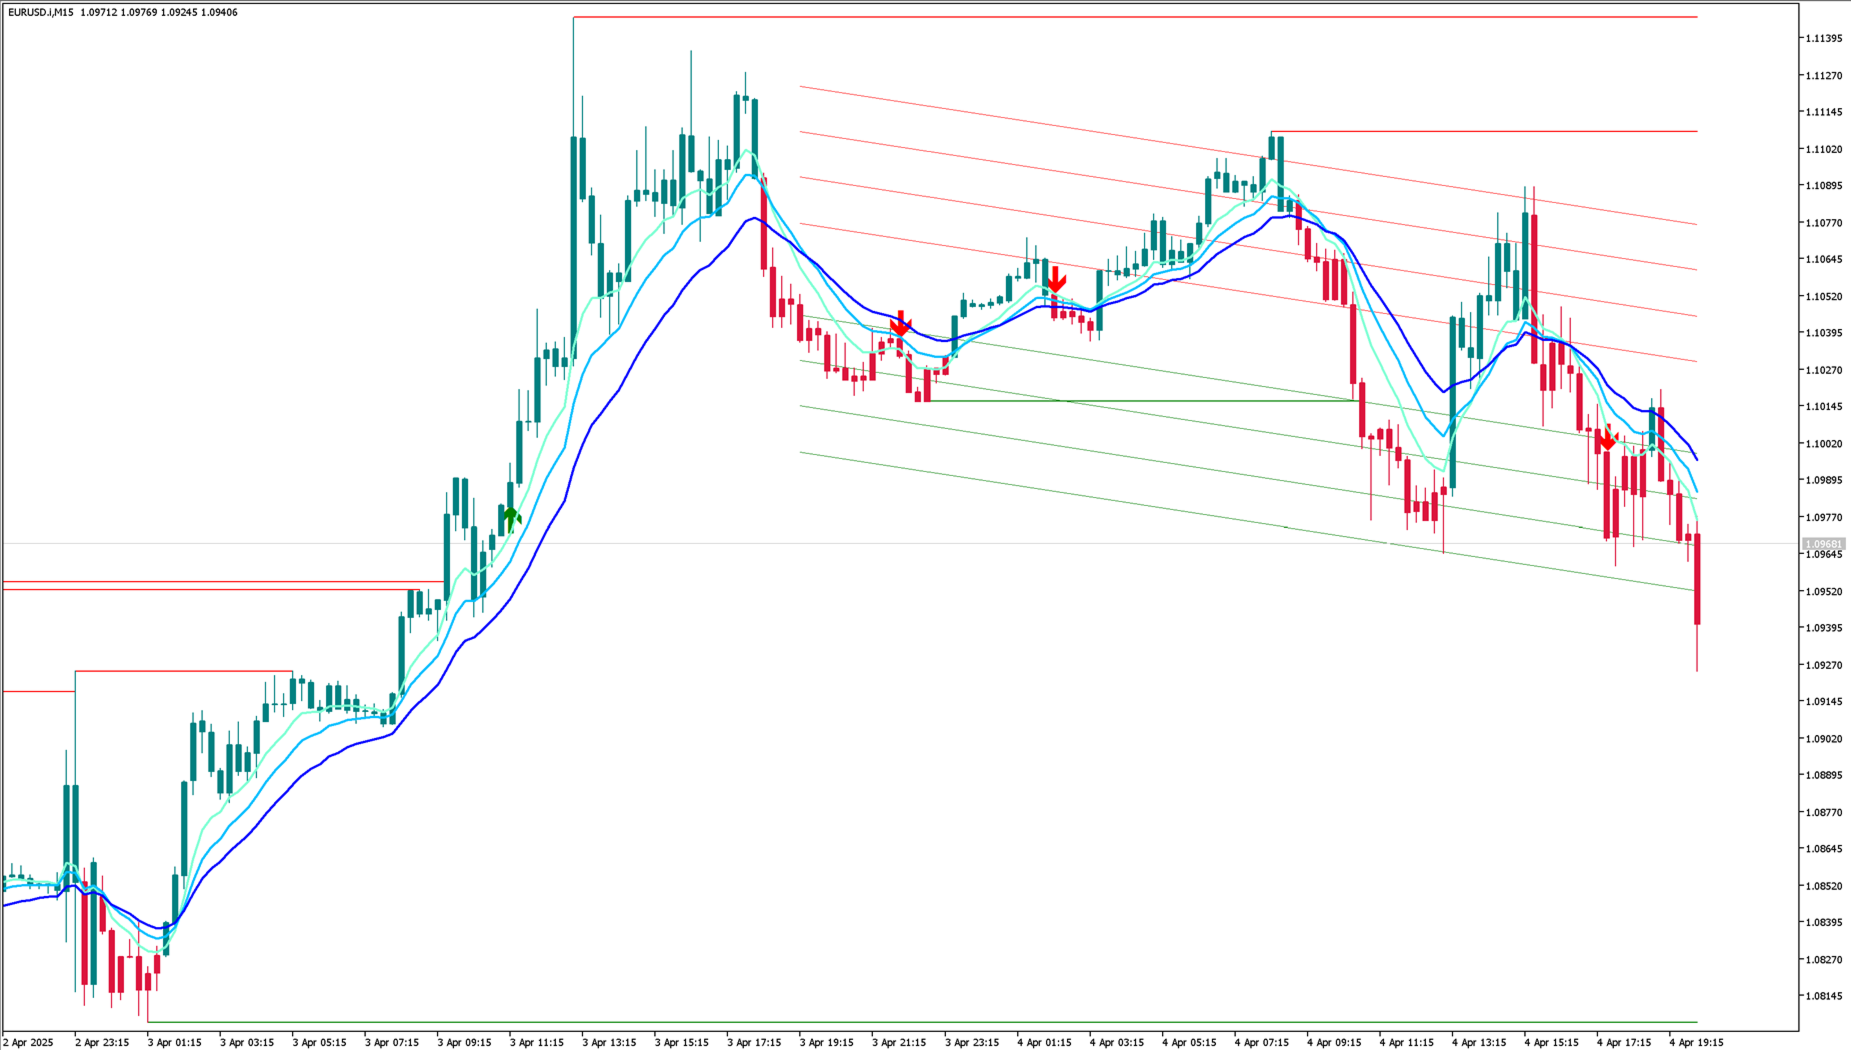
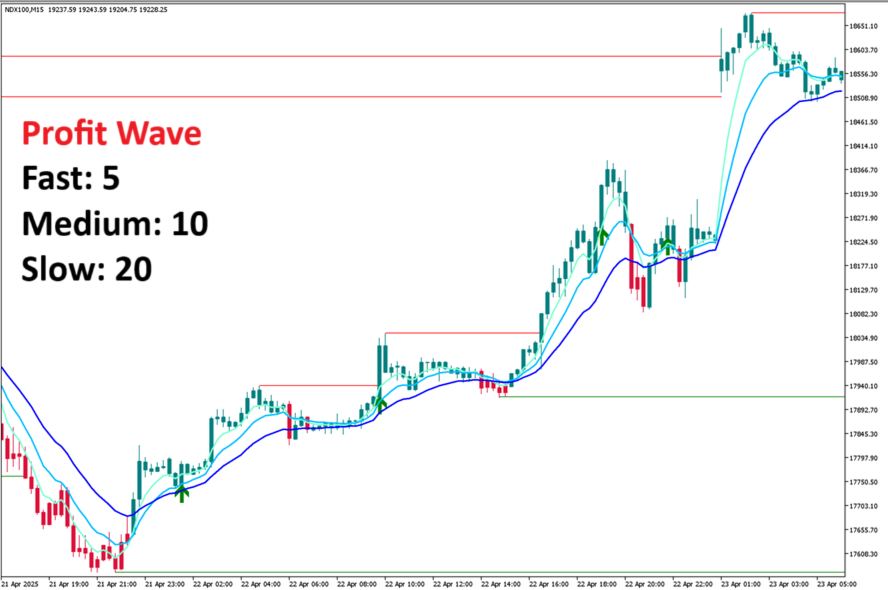
  • Dynamic Profit-Wave EMAs (fast, medium, slow)

  • Buy and sell arrows

  • Colored candles (bullish/bearish)

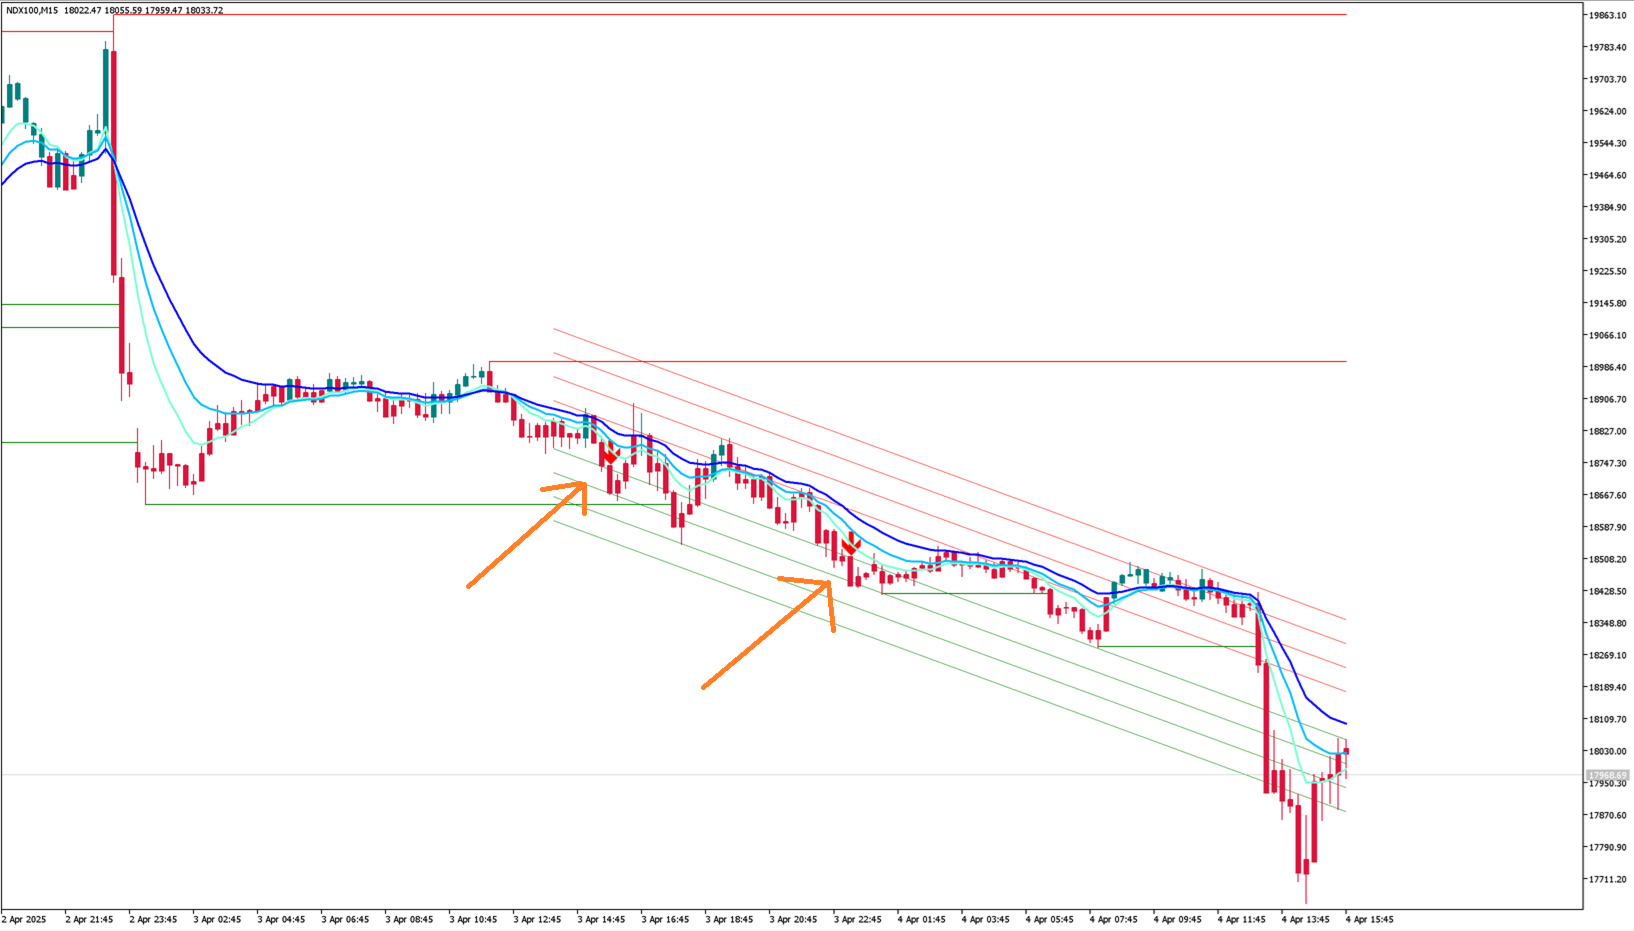
  • Support and resistance lines

  • Optional price channel

  • Money Flow Index (MFI) with trend- and signal-dots


    Key features

    • Volatility filter: reduces false signals during sideways markets

    • Adaptive EMAs (8/13/21) to gauge trend strength

    • Automatic S/R lines based on pivot points

    • MFI filter for volume‐flow confirmation

    • Price channel to visualize extreme zones


      Inputs in detail

      Signal settings

      • Max. Bars Back: maximum number of bars to look back (default 1000).

      • Enable Buy & Sell Signals: toggle buy/sell arrows on or off.

      • Buy Signal Color: color for buy arrows (default green).

      • Sell Signal Color: color for sell arrows (default red).

      • Enable Chop Filter: toggle volatility filter (suppresses signals in choppy markets).

      Profit-Wave settings

      • Enable Profit Wave: toggle the three EMAs on or off.

      • Fast EMA Color: color of the fast EMA (default aquamarine).

      • Medium EMA Color: color of the medium EMA (default deepskyblue).

      • Slow EMA Color: color of the slow EMA (default blue).

      Candle coloring

      • Enable Candle Color: toggle colored candles by trend on or off.

      • Bullish Candle Color: color for bullish candles (default teal).

      • Bearish Candle Color: color for bearish candles (default crimson).

      • Match Candle To: choose whether candles follow the trend or the slow Profit-Wave EMA.

      Support & resistance lines

      • Enable S/R Lines: toggle S/R lines on or off.

      • Resistance Lines Color: color of resistance lines (default red).

      • Support Lines Color: color of support lines (default green).

      • Line Style: style of the lines (dotted, solid, etc.).

      • Line Width: thickness of the lines.

      • Extend Lines Until: extend until price touches or closes beyond the line.

      Price channel

      • Enable Price Channel: toggle the channel bands on or off.

      • Bottom Channel Color: color of the lower band (default green).

      • Top Channel Color: color of the upper band (default red).

      • Extend Lines Left/Right: extend channel left or right.

      Money Flow Index (MFI)

      • MFI Length: look-back period for MFI calculation (default 10).

      • TrendSwitch Dot Size: dot size for trend-change indicator.

      • Signal Dot Size: dot size for MFI-based trade signals.

      • Bullish MFI Color: color of bullish MFI dots (default lime).

      • Bearish MFI Color: color of bearish MFI dots (default red).


        Signal interpretation

        Buy/sell arrows

        • Green arrow (▲): possible long entry when trend, volume and EMA conditions align.

        • Red arrow (▼): possible short entry.

        Colored candles

        • Teal: bullish market, per the chosen method.

        • Crimson: bearish market.

        Profit-Wave EMAs

        • Fast EMA (8): ultra short-term trend.

        • Medium EMA (13): confirmation of the intermediate impulse.

        • Slow EMA (21): the primary trend.

        Support/resistance lines

        • Drawn automatically at pivot points.

        • Use as reaction levels and for stop-loss / take-profit placement.

        Price-channel bands

        • Upper/lower bands mark short-term extreme zones.

        • Breakouts at the bands can signal further movement.

        MFI indicator dots

        • Lime dot: MFI above 52, buying pressure.

        • Red dot: MFI below 48, selling pressure.

        • Dots appear only when the volume filter is active.


          This is not financial advice! This is a real-time indicator and does not repaint.


          Produtos recomendados
          Este indicador permite-lhe desfrutar os dois produtos mais populares para analisar volumes de ofertas e das negociações no mercado a um preço favorável: Actual Depth of Market Chart Actual Tick Footprint Volume Chart Este produto combina o poder de ambos os indicadores e é fornecido como um único arquivo. Venda Anti-crise. Hoje com menor preço. Anda logo! A funcionalidade do COMBO Actual Depth of Market e Tick Volume Chart é totalmente idêntica aos indicadores originais. Você vai aproveitar o po
          Includes almost all the concepts related to Volume Profile: POC , Value Area , Developing POC , Anchored VWAP , Volume Delta ; since the “Total” in its name. It is fast in its calculations and simple to work with. Features: 1.    Selectable calculation timeframe to find most traded levels. 2.    Capable of calculating Volume Profile based on tick data 3.    Adjustable histogram bars by their count. 4.    Adjustable histogram bars by their height (price range). 5.    Showing Value Area (VA
          VR Grid Mt5
          Vladimir Pastushak
          3.43 (7)
          O indicador VR Grid foi projetado para criar uma grade gráfica com configurações definidas pelo usuário. Ao contrário da grade padrão , a VR Grid é usada para construir níveis circulares . Dependendo da escolha do usuário, o passo entre os níveis de rodada pode ser arbitrário. Além disso, ao contrário de outros indicadores e utilitários, o VR Grid mantém a posição da rede mesmo quando o período de tempo muda ou o terminal é reiniciado. Configurações, arquivos de configuração, versões demo, instr
          FREE
          O indicador cria cotações atuais, que podem ser comparadas com as históricas e, com base nisso, fazer uma previsão do movimento dos preços. O indicador possui um campo de texto para navegação rápida até a data desejada. Opções: Símbolo - seleção do símbolo que o indicador exibirá; SymbolPeriod - seleção do período do qual o indicador coletará dados; IndicatorColor - cor do indicador; HorisontalShift - deslocamento das cotações desenhadas pelo indicador pelo número especificado de barras; I
          The Volume+ and VSA Signals indicator for MT5 is based on the Volume Spread Analysis (VSA) methodology to provide the signals. The signals are displayed at closing of bars on the main window or subwindow in the form of symbols. The symbols are not repainting.  The indicator produces a signal on an individual bar and this signal is not buy or sell signal. When a minor trend goes in the opposite direction of a major trend, there are sequences of major trend-following signals that give a higher pro
          A "Volume Profile" is an advanced charting indicator that displays total volume traded at every price level over a user specified time period. The main components of the volume profile are POC ( Point Of Control - the price level, at which the maximum number of contracts were executed during a selected period), VAH ( Value Area High - the highest price in the Value Area) and VAL ( Value Area Low - the lowest price in the Value Area). When we settled on the original indicator, we spent a lot of
          VarMomentPulse is a unique manual trading algorithm developed with precision and flexibility in mind, based on an extensive historical data cluster.  Its operation is grounded in the principles of analyzing crossovers between normalized moving averages and dispersions across various time intervals, enabling it to uncover new opportunities in evaluating market trends. Key Features of the VarMomentPulse Indicator: Adaptability to Volatility:The use of price dispersion analysis allows VarMomentPul
          Heatmap Volume Profile
          Olexandr Savchuk
          3.5 (2)
          A Heatmap with a Volume Profile is like a thermal imager or x-ray machine. It will help you to estimate the relative distribution of volume during the price movement and to understand  the relationship between volume and price. Indicator Volume Profile "Volumos Maxima" is a powerful tool for analyzing this relationship. After simple experimentation with heatmap, you can find that each trading instrument has its own “ characteristic ” way of distributing volume. And this will help you to make a b
          BoxChart MT5
          Evgeny Shevtsov
          5 (7)
          The market is unfair if only because 10% of participants manage 90% of funds. An ordinary trader has slim changes to stand against these "vultures". This problem can be solved. You just need to be among these 10%, learn to predict their intentions and move with them. Volume is the only preemptive factor that faultlessly works on any timeframe and symbol. First, the volume appears and is accumulated, and only then the price moves. The price moves from one volume to another. Areas of volume accumu
          Was: $249  Now: $149   Market Profile defines a number of day types that can help the trader to determine market behaviour. A key feature is the Value Area, representing the range of price action where 70% of trading took place. Understanding the Value Area can give traders valuable insight into market direction and establish the higher odds trade. It is an excellent addition to any system you may be using. Inspired by Jim Dalton’s book “Mind Over Markets”, this indicator is designed to suit the
          Descubra o poder da análise de volume com o nosso indicador de perfil de volume para Metatrader!   /   Versão MT4 O Perfil de Volume Básico é um indicador especificamente concebido para negociadores manuais que procuram otimizar a sua negociação. O indicador de perfil de volume é uma ferramenta essencial para qualquer operador sério que pretenda compreender melhor o comportamento do mercado. Com a nossa solução inovadora, pode visualizar de forma clara e concisa como o volume de transacções es
          A singularidade deste indicador reside no algoritmo de contabilidade de volume: a acumulação ocorre diretamente para o período selecionado sem referência ao início do dia. As últimas barras podem ser excluídas do cálculo, então os dados atuais terão menos influência sobre os níveis significativos (volumes) formados anteriormente. Para um cálculo mais preciso, os dados do gráfico M1 são usados por padrão. A etapa de distribuição dos volumes de preços é regulamentada. Por padrão, a borda direita d
          VWAP Daily
          Anton Polkovnikov
          Weighted average price indicator or VWAP. The well-known standard VWAP with the beginning of the day is added with the function of selecting the periodization. It can be calculated both every day and on other periods. Also the indicator allows to exclude the volume from the calculation, which will allow using it on the cryptocurrencies and forex. There is an alert for a VWAP price crossing. There are 1 and 2 standard deviation. Settings: Volume: turning volume on and off in the calculation mecha
          PivotWave
          Jeffrey Quiatchon
          Introducing PivotWave – your ultimate trading companion that redefines precision and market analysis. Designed with traders in mind, PivotWave is more than just an indicator; it’s a powerful tool that captures the pulse of the market, identifying key turning points and trends with pinpoint accuracy. PivotWave leverages advanced algorithms to provide clear visual signals for optimal entry and exit points, making it easier for traders to navigate volatile market conditions. Whether you are a begin
          AVISO IMPORTANTE – LICENÇA E ATIVAÇÃO NECESSÁRIAS Instruções de Ativação: Após concluir sua compra, entre em contato conosco imediatamente para receber sua chave de licença, senha ou detalhes de ativação. Sem esses itens, o software não funcionará. Estamos aqui para garantir um processo de ativação tranquilo e ajudá-lo com qualquer dúvida. Personalização Multilíngue Para melhorar sua experiência de trading, oferecemos personalização completa do software em vários idiomas. Nossa equipe po
          Blahtech Supply Demand MT5
          Blahtech Limited
          4.54 (13)
          Was: $299  Now: $149  Supply Demand uses previous price action to identify potential imbalances between buyers and sellers. The key is to identify the better odds zones, not just the untouched ones. Blahtech Supply Demand indicator delivers functionality previously unavailable on any trading platform. This 4-in-1 indicator not only highlights the higher probability zones using a multi-criteria strength engine, but also combines it with multi-timeframe trend analysis, previously confirmed swings
          KT Volume Profile MT5
          KEENBASE SOFTWARE SOLUTIONS
          O KT Volume Profile exibe os dados de acumulação de volume como um histograma no eixo Y, permitindo visualizar a atividade de negociação ao longo de determinados períodos e níveis de preço. Ponto de Controle (POC) no Perfil de Volume O POC representa o nível de preço com o maior volume negociado dentro do histograma do perfil de volume. Geralmente, é utilizado como suporte/resistência ou como um nível-chave onde o mercado pode fazer um reteste antes de seguir em uma direção específica. Recurso
          Quantum Tick Volumes Indicator for MT5
          QUANTUM TRADING SOFTWARE LIMITED
          5 (1)
          Many Forex traders assume there is no volume in the foreign exchange market. And they would be correct. There is no central exchange, not yet anyway. And even if there were, what would it report? What there is however is activity, and this is captured as tick volume. After all, volume is simply displaying activity, the buyers and sellers in the market. So for volume read activity, and for activity read volume – simple. The MT5 platform delivers tick data which the Quantum Tick Volumes indicator
          Volume Profile Institutional Live
          Agustinus Biotamalo Lumbantoruan
          3 (1)
          Unlock the Power of Market Analysis with Precision Are you ready to take your trading to the next level? The "Institutional Volume Profile" indicator is here to empower your trading decisions like never before. Key Features: Custom Volume Profiles : Plot volume profiles effortlessly by simply adding horizontal lines or Fibonacci tools on your MetaTrader 5 chart. There's no limit to how many profiles you can create. Insightful Visualization : The indicator beautifully displays crucial information
          VolumeProfile MT5
          Robert Hess
          4.14 (7)
          Description: The Volume Profile displays detailed informations of historical trading activities at certain price levels (Market Profile). Locate the areas with the best prices in the market and get an advantage over other market participants. Features: Customizable Market Profile Shows the "fair" Value Area with 70% of all Volume Shows critical low volume zones Shows VPOC, VAL and VAH Points integrated resource management to reduce the load while working with multiple charts Works on all timefr
          Elevate Your Trading with Advanced Anchored Volume Weighted Average Price Technology Unlock the true power of price action with our premium Anchored VWAP Indicator for MetaTrader 5 - the essential tool for precision entries, strategic exits, and high-probability trend continuation setups. Write me a DM for a 7 day free trial.  Anchored VWAP Plus gives traders unprecedented control by allowing custom anchor points for Volume Weighted Average Price calculations on any chart. With support for 4 sim
          FREE
          Volume and MarketProfile Pro
          Raphael Lorenz Baumgartner
          Volume e MarketProfile Pro Descrição: O indicador MarketProfile fornece uma análise precisa e detalhada do volume de negociação em diferentes níveis de preços. Ele calcula e exibe o perfil de volume para cada dia de negociação, ajudando você a entender a estrutura do mercado e a distribuição do volume para tomar decisões comerciais informadas. Características principais: Análise diária do volume: O indicador calcula e exibe o perfil de volume para cada dia de negociação, permitindo identificar
          Let us introduce the Heikin Ashi RSI Oscillator! This indicator combines the concepts of Heikin Ashi candles with the RSI (Relative Strength Index) to produce an oscillator-like format that can be used to filter out some of the noise associated with standard RSI readings. This provides traders with a smoother representation of market conditions. Here are some articles to read more about the RSI and Heikin Ashi candles: https://www.investopedia.com/terms/r/rsi.asp https://www.investopedia.com/ter
          Smooth price for Monarch
          Konstantin Gruzdev
          5 (1)
          The Smooth Price technical indicator is used for plotting a smoothed line as close to the price of the financial instrument as possible, and serves to eliminate its noise components. The indicator is part of the Monarch trading system, but here it is presented as an independent technical analysis tool. The indicator is based on the cluster digital filter , which, unlike the ClusterSMA , is applied directly to the price time series. Smooth Price does not redraw (except the very last, zero bar) an
          The VWAP indicator is our version of the popular Volume-Weighted Average Price indicator. The VWAP is the ratio between the value traded (price multiplied by the number of volume traded) and the total volume traded over a specific time period. As a result, it measures the average price of the instrument much better than the simple moving average. Although there are many ways to use the VWAP, most investors use it to calculate the daily average.  The indicator works in five modes: Moving  - In
          ClusterSecondForex
          Rafil Nurmukhametov
          4.67 (3)
          The utility allows you to build different types of graphs: Seconds chart from 1 second to 86400 seconds Tick chart from 1 tick and above The volume chart Delta chart Renko chart Range chart Product demo https://www.mql5.com/ru/channels/clustersecondforex Built-in indicators for volumetric analysis: daily market profile and market profile of the selected timeframe, Cluster Search Imbalance VWAP Dynamic POC, VAH, VAL the profile depth of the market vertical volume with various display options, del
          Order Book, known also as Market Book, market depth, Level 2, - is a dynamically updated table with current volumes of orders to buy and to sell specific financial instument at price levels near Bid and Ask. MetaTrader 5 provides the means for receiving market book from your broker, but in real time only, without access to its history. The indicator OrderBook Cumulative Indicator accumulates market book data online and visualizes them on the chart. In addition, the indicator can show the market
          This indicator has been developed to identify and display these trends quickly and easily, allowing you to see instantly, those currency pairs which are trending, and those which are not – and in all timeframes, with just one click. The 28 currency pairs are displayed as a fan as they sweep from strong to weak and back again, and this is why we call it the ‘currency array’. All 28 pairs are arrayed before you, giving an instant visual description of those pairs that are trending strongly, those
          Mine Farm
          Maryna Kauzova
          Mine Farm is one of the most classic and time-tested scalping strategies based on the breakdown of strong price levels. Mine Farm is the author's modification of the system for determining entry and exit points into the market... Mine Farm - is the combination of great potential with reliability and safety. Why Mine Farm?! - each order has a short dynamic Stop Loss - the advisor does not use any risky methods (averaging, martingale, grid, locking, etc.) - the advisor tries to get the most
          Crypto Ticks and Depth
          Rajesh Kumar Nait
          5 (1)
          CRYPTO TICKS Transmissão de Dados de Mercado da Próxima Geração Suporta múltiplas exchanges: Binance [Spot: Suporta profundidade do livro de ordens na janela ativa & Futuros (Múltiplas camadas de profundidade)] Kucoin (Spot & Futuros) – Profundidade do livro de ordens Bybit (Futuros & Futuros Inversos) XT.com Principais recursos: Reconexão automática robusta – Nunca perca um tick! Dados de ticks ao vivo – Suporta @trade, @ticker, @bookTicker & @aggTrade (Binan
          Os compradores deste produto também adquirem
          NOTE: CYCLEMAESTRO is distributed only on this website, there are no other distributors. Demo version is for reference only and is not supported. Full versione is perfectly functional and it is supported. CYCLEMAESTRO , the first and only indicator of Cyclic Analysis, useful for giving signals of TRADING, BUY, SELL, STOP LOSS, ADDING. Created on the logic of   Serghei Istrati   and programmed by   Stefano Frisetti ;   CYCLEMAESTRO   is not an indicator like the others, the challenge was to inter
          CBT Quantum Maverick Sistema de Negociação de Opções Binárias de Alta Eficiência O CBT Quantum Maverick é um sistema de opções binárias de alto desempenho, projetado para traders que buscam precisão, simplicidade e um enfoque disciplinado. Não exige personalização: o sistema está otimizado para resultados eficazes desde o início. Basta seguir os sinais, que podem ser dominados com um pouco de prática. Principais características: Precisão nos sinais: Sinais baseados na próxima vela, utilizando
          FxaccurateLS
          Shiv Raj Kumawat
          WHY IS OUR FXACCCURATE LS MT5 THE PROFITABLE ? PROTECT YOUR CAPITAL WITH RISK MANAGEMENT Gives entry, stop and target levels from time to time. It finds Trading opportunities by analyzing what the price is doing during established trends. POWERFUL INDICATOR FOR A RELIABLE STRATEGIES We have made these indicators with a lot of years of hard work. It is made at a very advanced level. Established trends provide dozens of trading opportunities, but most trend indicators completely ignore them! The
          The   Time_Price_SQ9_Degree   indicator is based on the 9 Gann square. Using this indicator, you can identify strong time and price zones. The indicator displays the levels as a degree value. The degrees can be set in the settings. After launching, the MENU button appears. If it is highlighted, it can be moved to any point on the graph, and after double-clicking on it, it stops being highlighted and menu buttons appear. To hide the menu, just double-click on the button, it will become highlight
          How to use Pair Trading Station Pair Trading Station is recommended for H1 time frame and you can use it for any currency pairs. To generate buy and sell signal, follow few steps below to apply Pair Trading Station to your MetaTrader terminal. When you load Pair Trading Station on your chart, Pair Trading station will assess available historical data in your MetaTrader platforms for each currency pair. On your chart, the amount of historical data available will be displayed for each currency pai
          The Naveen Dynamic Square  MT5  is one of the best known  technical analysis tools  inspired  by WD Gann along with the Gann Fan and Gann Box. It is considered a cornerstone of his trading technique that is based on time and price symmetry. The Naveen Dynamic Square MT5   is a powerful tool in finance for determining support and resistance levels based on a stock's extreme price points. It works by extrapolating probable price levels from a central value, typically an all-time or cyclical high o
          Reversal ALGO
          Muhammad Abdullah Bhatti
          Reversal Algo é um indicador técnico projetado para ajudar traders a identificar possíveis pontos de reversão na tendência do mercado. Através de uma análise detalhada dos dados históricos de preços, ele detecta máximos e mínimos significativos que podem indicar uma mudança na direção do mercado. Seu sistema de sinais visuais claros permite que os traders identifiquem áreas-chave onde uma reversão de tendência pode ocorrer. Principais Características Detecção de Preços Significativos: O Reversa
          Super Zone indicator
          Dmitriy Sotnikov
          5 (1)
          Super Zone   For several years of observing the principles of the market, Super Zone worked, both then and now, because the indicator  allows you to see the trading range of the  week and even the month that major market participants use. It’s very easy to use, we work on H4 in the weekly range (  in the tester it doesn’t work in the demo mode  ) - we sell from the upper zones, we buy from the lower ones. It marks the zones from the beginning of the week (month) that are  not redrawn  , works on
          This indicator is based on the mathematics of the great trader W.D. Ganna. With its help, you can easily find strong levels by analyzing swings to find the optimal entry point. The indicator works on all instruments and all timeframes. The indicator is fully manual and has control buttons. All you need to do is press the NEW button, a segment will appear, which you can place on any movement, swing or even 1 candle that you want to analyze. By placing the segment, press the OK button. A grid (th
          This indicator identifies and displays zones, as it were areas of strength, where the price will unfold. The indicator can work on any chart, any instrument, at any timeframe. The indicator has two modes. The indicator is equipped with a control panel with buttons for convenience and split into two modes. Manual mode: To work with manual mode, you need to press the NEW button, a segment will appear. This segment is stretched over the movement and the LVL button is pressed. The level is displayed
          TrendMaestro5
          Stefano Frisetti
          note: this indicator is for METATRADER4, if you want the version for METATRADER5 this is the link:  https://www.mql5.com/it/market/product/108106 TRENDMAESTRO ver 2.4 TRENDMAESTRO recognizes a new TREND in the bud, he never makes mistakes. The certainty of identifying a new TREND is priceless. DESCRIPTION TRENDMAESTRO identifies a new TREND in the bud, this indicator examines the volatility, volumes and momentum to identify the moment in which there is an explosion of one or more of these data a
          TMA Channel is a price channel obtained through a special calculation method based on traditional TMA . The channel has upper, middle, and lower tracks . When the price approaches or exceeds the upper track, it is already in an overbought state, and attention should be paid to the situation of reversal and decline; When the price approaches or falls below the lower track, it is already in an oversold state, and attention should be paid to the situation of reversal and rise . The indicator will
          Seconds Charts
          Aleksandr Goryachev
          Micro  ******************* Секундные графики MT5 ********************** Более точного инструмента для входа в сделку вы не найдёте. Входные параметры: Timeframe, sek - период построения графика, секунды Displayed bars - отображаемые бары Step of price levels, pp, 0-off - шаг отрисовки ценовых уровней, пункты Scale points per bar, 0-off - масштаб в пунктах на бар Show lines - отображение текущих уровней Show comment - отображение комментария Standard color scheme - стандартная цветовая сх
          Happy entries
          Godwill Fortune Otieno Juma
          The  product gives optimized entries for 3min ,1 hr and day timeframes  Does well with indices  ASIAN- HK50 AND CHINA A50 USA-US30,US100,US500 GER40 ,UK100 For stocks trade with the day timeframes Happy Entry employs advanced algorithms and real-time data analysis to identify optimal entry points with unprecedented accuracy. Its adaptive nature allows it to seamlessly adjust to changing market conditions, ensuring you never miss out on profitable opportunities. Whether you're a beginner or seas
          Claro, aqui está a tradução para o português: Apresentando o Indicador de Astronomia para   MT4 / MT5 : Seu Companheiro Celestial Definitivo no Trading Você está pronto para elevar sua experiência de trading a alturas celestiais? Não procure mais do que o nosso revolucionário Indicador de Astronomia para MT4. Essa ferramenta inovadora transcende os indicadores de trading tradicionais, aproveitando o poder de algoritmos complexos para fornecer insights astronômicos incomparáveis e cálculos de pre
          Hello I Want to introduce The Forex Buy Sell Arrow Premium MT5 i recently release this premium indicator! its 1000% Non Repaint Indicator, It Work Perfectly Well,, i tested it day by day, Just mind blowing Result,  Including Powerful trend Algorithm! How It Work? well, it work market trend formula, when trend Bullish Or when trend Bearish,  Recommend Timeframe M30, H1 it work all timeframe, and all currency pair, 100% non repaint, How to take signal From Forex Buy Sell Arrow Premium Ind
          No promises, no hype — just real edge if you’re fortunate enough to be using this stuff --- Join the group for updates and insights : https://t.me/TPTSyncX-Traderland Introduction! to the Indicator that Connects Trend , Pattern , and Candlestick Trigger. 3 Steps in Under 30 Seconds ️ Trade effortlessly — no analysis required, Your smart assistant is ready to simplify your workflow No more chart overload. Trade with confidence using smart bias detection. Compatible with all curren
          AriBot
          Arman Belassarov
          AriMax   – AI-Powered Trading Robot AriMax is a cutting-edge AI-powered trading robot designed to help traders maximize profits while minimizing risk. Utilizing advanced machine learning algorithms and real-time market analysis, AriMax identifies high-probability trade opportunities with precision and speed. Key Features:     AI-Driven Market Analysis   – Analyzes market trends and patterns to make data-driven trading decisions.     Automated Execution   – Places trades seamlessly with optimiz
          Big Player Range
          Thalles Nascimento De Carvalho
          5 (3)
          Descubra o Poder do "BigPlayerRange": Seu Aliado na Análise Técnica de Mercado Apresentamos o BigPlayerRange , uma ferramenta avançada de análise técnica projetada para revelar as áreas de interesse das instituições financeiras no mercado . Com ele, você poderá identificar com precisão onde os grandes players estão ativamente engajados e como isso pode impactar suas estratégias de negociação. Principais Características: Mapeamento de Áreas de Interesse Institucional : O BigPlayerRange des
          Viking Strategy Signal Indicator
          E Bahamlong Bagoudjare
          5 (1)
          Viking_Strategy_Signal Indicator is a solution I offer to beginner, amateur, and professional traders. My scalping robot :  https://www.mql5.com/fr/market/product/133191 By purchasing this indicator, you will first save time because it automatically analyzes the market based on Dow Theory and the Smart Money Concept (High (H), Low (L), Higher High (HH), Lower Low (LL), Break of Structure (BOS) to determine market structure and trend). It is built on my strategy, which relies on the NRTR theory t
          The   Gann Scalping Gold Indicator   is a robust technical analysis tool designed for precision trading in gold markets. It leverages Gann-based methodologies to identify key price levels, enabling traders to anticipate potential market reversals, breakouts, and areas of consolidation. Daily Reset Logic: Automatically resets touch statuses at the start of a new trading day, ensuring that the indicator aligns with fresh daily trends. How It Works: The indicator draws horizontal lines at predefine
          VTrende Pro
          Andrii Diachenko
          5 (1)
          VTrende Pro - MTF indicator for trend trading with a display panel for MT5 *** Videos can be translated into any language using subtitles (video language - Russian) Although the signals of the VTrende Pro indicator can be used as signals of a full-fledged trading system, it is recommended to use them in conjunction with the Bill Williams TS. VTrende Pro is an extended version of the VTrende indicator. Difference between Pro version and VTrende: - Time zones - Signal V - signal 1-2 waves -    S
          WanaScalper
          Isaac Wanasolo
          1 (1)
          A scalping indicator based on mathematical patterns, which on average gives signals with relatively small SL, and also occasionally helps to catch big moves in the markets (more information in the video) This indicator has three main types of notifications: The first type warns of a possible/upcoming signal on the next bar The second type indicates the presence of a ready signal to enter the market/open a position The third type is for SL and TP levels - you will be notified every time price re
          XCalper TFO
          Aecio de Feo Flora Neto
          This oscillator was developed exclusively by xCalper in 2015 based on moving averages calculations to indicate and try predicting oversold and overbought levels. The fast line (white, by default) oscillates basically between values -0.5 (oversold) and +0.5 (overbought). Whenever this line crosses upward value -0.5, it means an oversold price level. When it crosses downward value +0.5, it means an overbought price level. When fast line crosses value 0.0 and returns, it is a strong pull-back indic
          The Expert Advisor and the video are attached in the Discussion tab . The robot applies only one order and strictly follows the signals to evaluate the indicator efficiency. Pan PrizMA CD Phase is an option based on the Pan PrizMA indicator. Details (in Russian). Averaging by a quadric-quartic polynomial increases the smoothness of lines, adds momentum and rhythm. Extrapolation by the sinusoid function near a constant allows adjusting the delay or lead of signals. The value of the phase - wave s
          Классификатор силы тренда. Показания на истории не меняет. Изменяется классификация только незакрытого бара. По идее подобен полной системе ASCTrend, сигнальный модуль которой, точнее его аппроксимация в несколько "урезанном" виде, есть в свободном доступе, а также в терминале как сигнальный индикатор SilverTrend . Точной копией системы ASCTrend не является. Работает на всех инструментах и всех временных диапазонах. Индикатор использует несколько некоррелируемых между собой алгоритмов для класси
          Currency Index Watcher is a simple and user-friendly tool for whoever wish to trade Forex using currencies indexes. Currency Index Watcher is configurable and usable directly from the panel. Indexes of 8 custom currencies EUR, USD, GBP, JPY, CHF, AUD, CAD, NZD (default) Any 3-chars symbol from your market watch could be used (BTC = bitcoin, RUB = ruble, CNH = yuan etc ...) : double click the symbol label  Ability to select which currencies and made-of pairs will be analyzed : check/uncheck wante
          Forex Relative Performance indicator This indicator calculates the relative strength of major currencies against the US dollar. The basic idea behind this indicator is "to buy strong currency and to sell weak currency". This indicator allows you to quickly identify the best forex pair to trade according to your trading style (Intraday, Scalping, Swing, or Long Term)
          The latest most requested Binary Options arrow indicator in the Garuda Signals product line is now on MT5! Binary options signal based on multiple time frame cross over analysis. Gets confirmation from the most consistent signals known to man; Ichimoku, SMA, Bollinger Bands; and also uses the 1 Hour time frame as trend confirmation , so you don't have to open up multiple chart and waste time. - Can be used for all time frames up to 1 hour, but is most POWERFUL for 1 and 5 min options. - Place yo
          O nível Premium é um indicador único com mais de 80% de precisão nas previsões corretas! Este indicador foi testado pelos melhores Especialistas em Negociação por mais de dois meses! O indicador do autor você não encontrará em nenhum outro lugar! A partir das imagens você pode ver por si mesmo a precisão desta ferramenta! 1 é ótimo para negociar opções binárias com um tempo de expiração de 1 vela. 2 funciona em todos os pares de moedas, ações, commodities, criptomoedas Instruções: Assim
          Mais do autor
          Let us introduce the Heikin Ashi RSI Oscillator! This indicator combines the concepts of Heikin Ashi candles with the RSI (Relative Strength Index) to produce an oscillator-like format that can be used to filter out some of the noise associated with standard RSI readings. This provides traders with a smoother representation of market conditions. Here are some articles to read more about the RSI and Heikin Ashi candles: https://www.investopedia.com/terms/r/rsi.asp https://www.investopedia.com/ter
          Bayesian Trend Indicator
          Dominic Michael Frehner
          The Bayesian Trend Indicator colors each candle according to a Bayesian‐inference of trend direction. It computes “prior” trend strength from four standard moving averages (EMA, SMA, DEMA, VWMA) of your chosen length, then computes a “likelihood” from faster versions of those same MAs (shortened by a “gap”). It combines them to produce a posterior probability of an uptrend. Candles are colored: Green when posterior indicates a strong uptrend. Red when posterior indicates a strong downtrend. Blue
          The Candle Smoother is an indicator for MetaTrader 5 that helps you see price movements more calmly and clearly. It removes unnecessary "market noise" and displays the true trend more effectively. What does the "Candle Smoother Indicator" do? It smooths the classic candlestick data (Open, High, Low, Close). This filters out chaotic, hectic candles. Additionally, an EMA line (Exponential Moving Average) is calculated based on the smoothed prices. This helps you better recognize where the market
          Filtro:
          Sem comentários
          Responder ao comentário