Schaff Trend Cycle Indicator MT5
- Indicadores
- Eda Kaya
- Versão: 1.3
Schaff Trend Cycle Indicator for MetaTrader5
The Schaff Trend Cycle Indicator for MetaTrader5 is a momentum-based oscillator that helps detect potential reversal zones on the price chart. It is built using a hybrid model of the MACD (Moving Average Convergence Divergence) and the Stochastic Oscillator. This indicator marks readings below the 25 level as potential buying zones (oversold), while values above 75 suggest overbought conditions. The visual movement is depicted by a curved purple line that swings within these levels. This tool becomes more effective when combined with other indicators or trading strategies to improve signal accuracy.
«Indicator Installation & User Guide»
MT5 Indicator Installation | Schaff Trend Cycle Indicator MT4 | ALL Products By TradingFinderLab | Best MT5 Indicator: Refined Order Block Indicator for MT5 | Best MT5 Utility: Trade Assistant Expert TF MT5 | TP & SL Tool: Risk Reward Ratio Calculator RRR MT5 | Money Management: Easy Trade Manager MT5
Indicator Table
| Indicator Category | Oscillator - Momentum & Signal Generator |
| Platforms | MetaTrader 5 |
| Trading Skills | Beginner-Friendly |
| Indicator Types | Reversal - Overbought/Oversold Detector |
| Timeframe | Works on All Timeframes |
| Trading Style | Compatible with All Strategies |
| Trading Instruments | Forex - Digital Assets - Equities |
Use Case Example
In the chart below, the Dow Jones index (US30) is plotted in the 30-minute timeframe. On April 19th, the oscillator moved into the oversold region, and upon crossing the 25 thresholds, a potential bullish signal appeared. A few days later, on April 23rd, it entered the overbought area and then dipped below 75, indicating a possible sell setup. These signals help traders align their entries with expected momentum shifts.
Overview
The Schaff Trend Cycle (STC) oscillator generates signals based on cyclical price behavior in extreme market zones. While it is helpful for pinpointing early trade setups, using it as a standalone tool may lead to unreliable results. Therefore, it is best used in combination with other technical elements like support/resistance zones, trendlines, or Fibonacci retracement levels to improve its reliability.
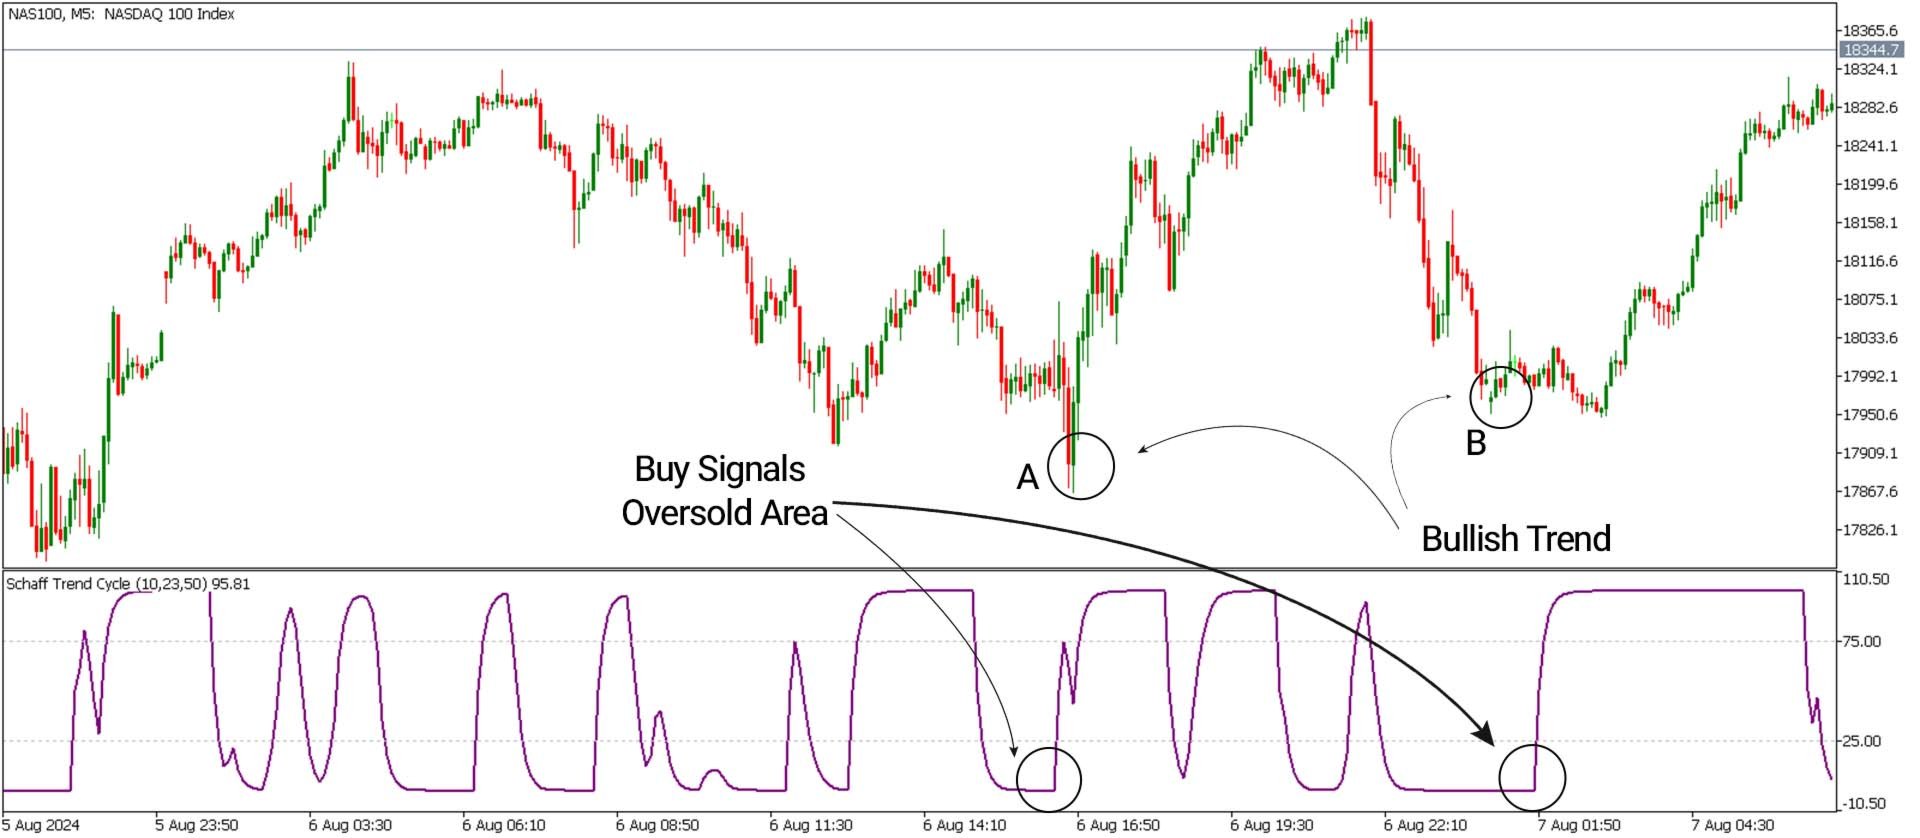
Bullish Trade Setup (Buy Signal Conditions)
The NASDAQ 100 chart (NAS100), shown on a 5-minute timeframe, illustrates this indicator reaching the oversold threshold at points A and B. When the oscillator line crosses above the 25 marks, it issues an early bullish signal. Traders can confirm this signal using bullish price action setups or additional technical confirmation before entering buy positions.
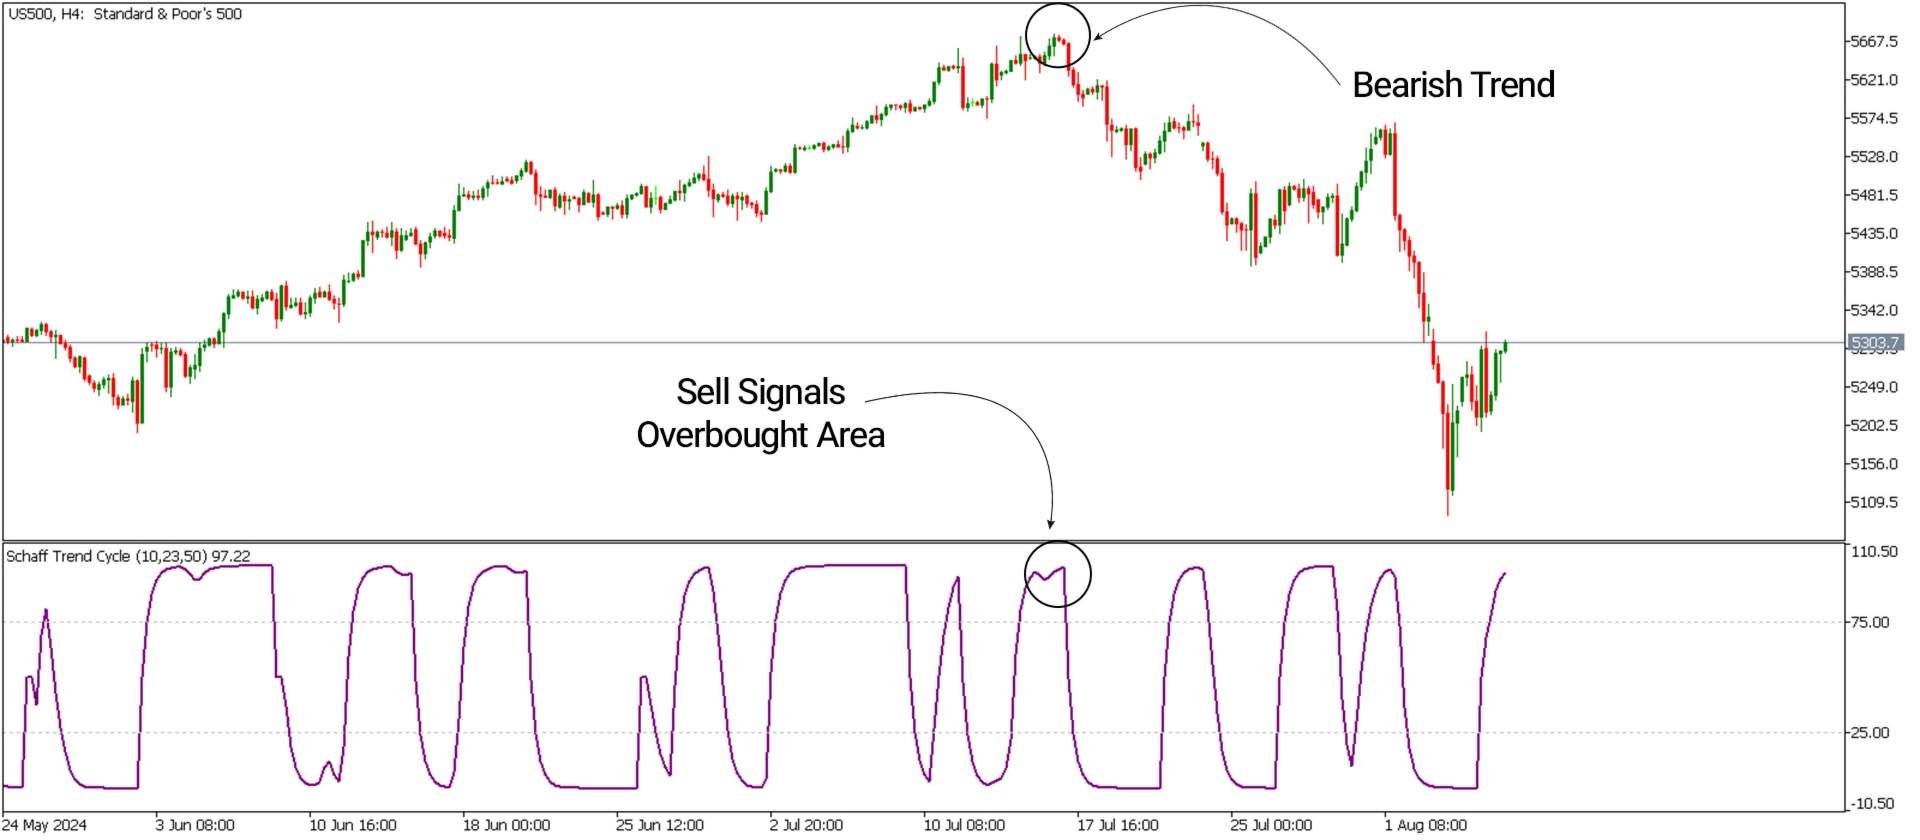
Bearish Trade Setup (Sell Signal Conditions)
In the 4-hour chart of the S&P 500 index (US500), the oscillator enters an overbought territory and later crosses below the 75 level. This action generates a bearish signal, offering traders an opportunity to enter short positions, especially if confirmed by bearish candlestick patterns or resistance levels.
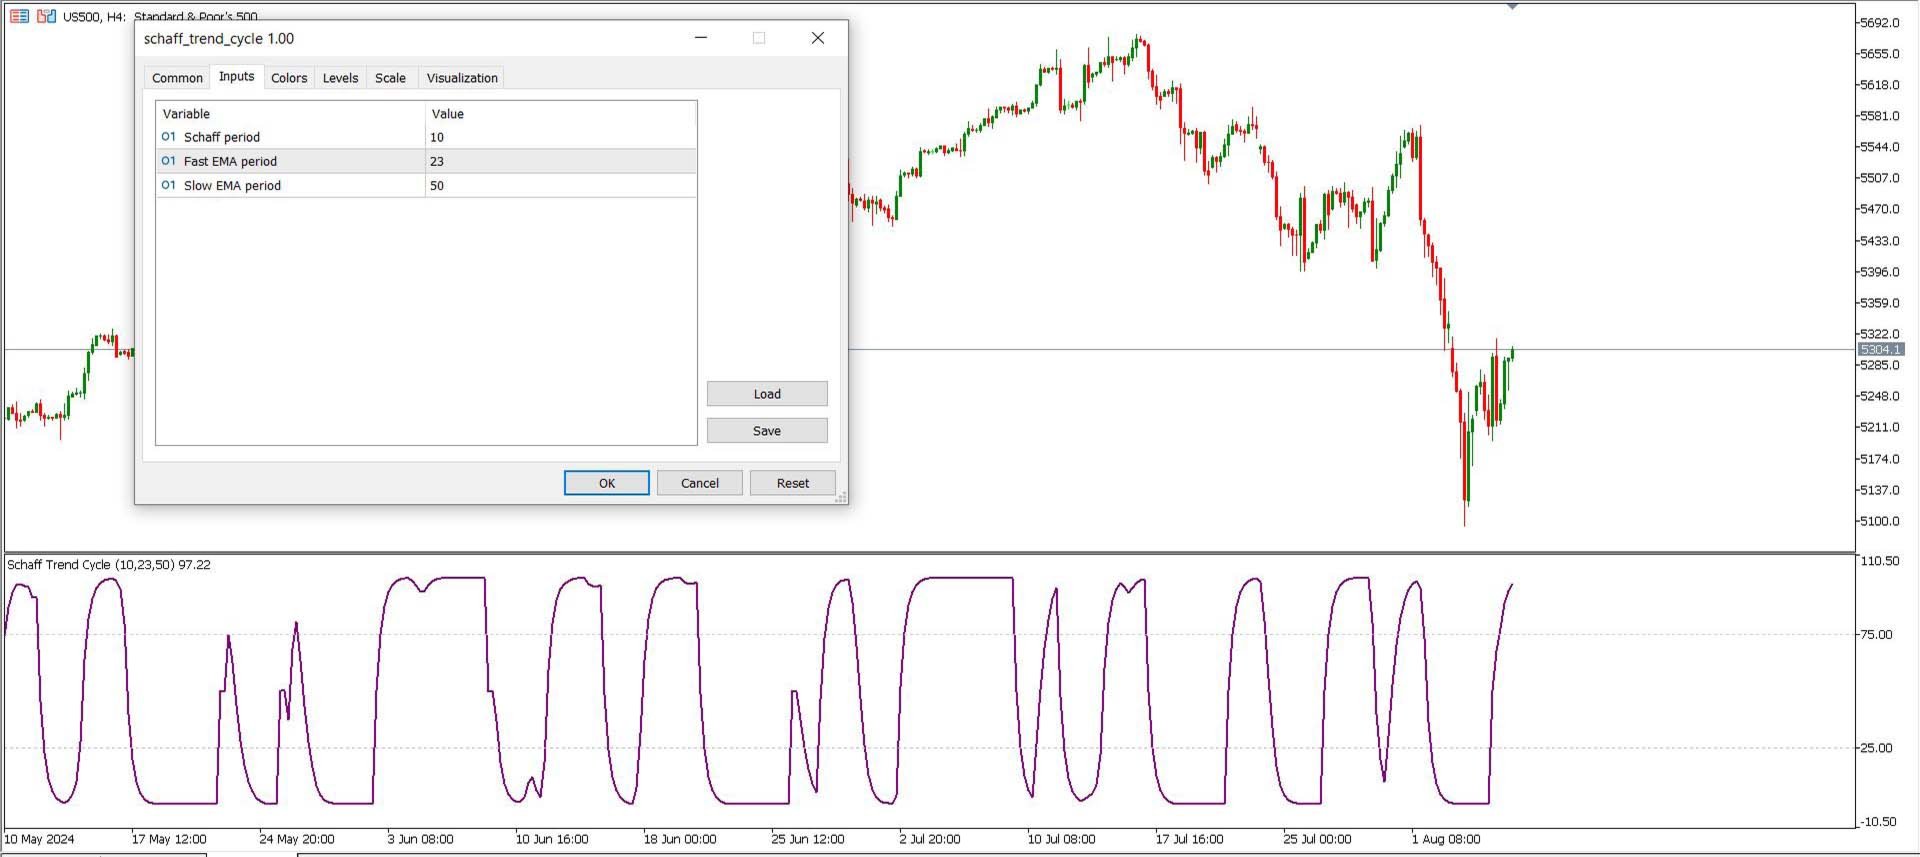
Schaff Trend Cycle Indicator Settings
- Schaff Period: 10 (default value)
- Fast EMA Period: 23
- Slow EMA Period: 50
Note: You can manually set reference levels (25 and 75) in the Levels tab within the indicator settings to clearly visualize overbought and oversold zones.
Summary
Oscillators like the Schaff Trend Cycle Indicator for MetaTrader5 are powerful tools for detecting price extremes but may produce unreliable signals in isolation. Since this indicator blends two robust oscillators, it filters out market noise and improves timing accuracy. For optimal use, it should be combined with broader technical tools such as trend analysis, support and resistance levels, or price action techniques to validate signals and manage risk effectively.