RSI Heatmap Indicator MT4
- Indicadores
- Eda Kaya
- Versão: 1.3
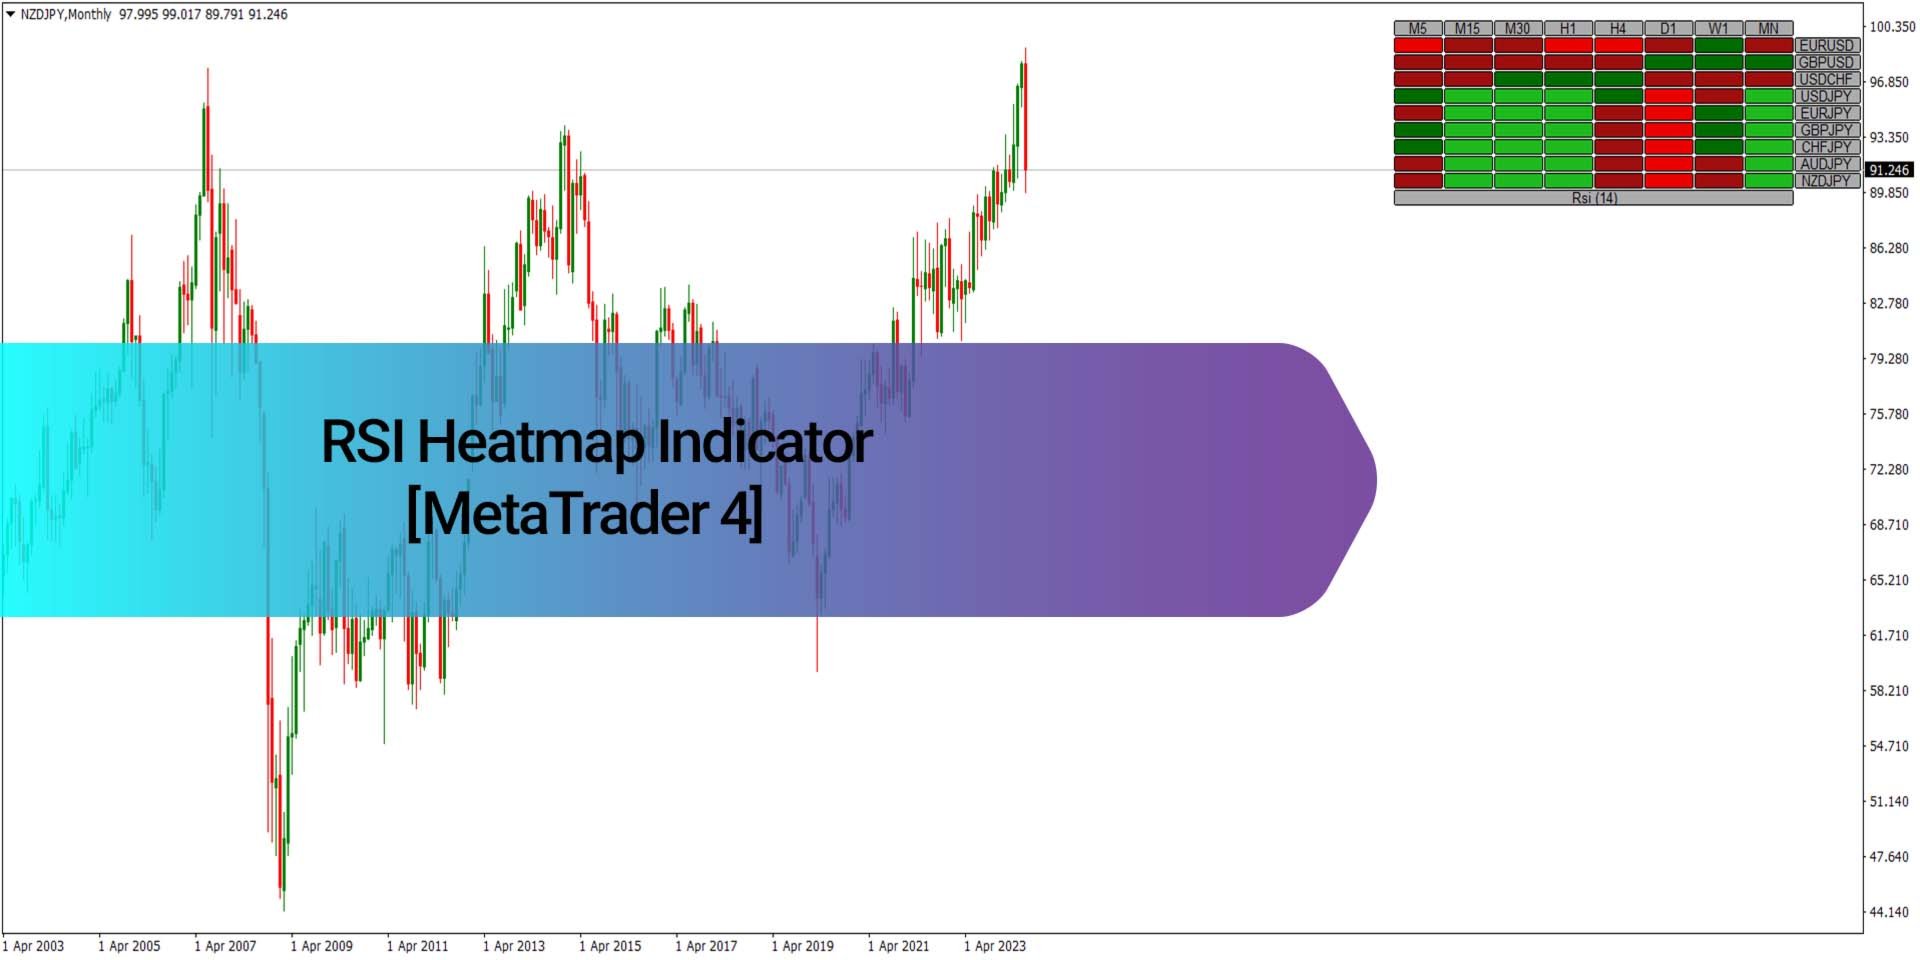
RSI Heatmap Indicator for MetaTrader4
The RSI Heatmap Indicator is a powerful technical tool in MetaTrader 4 that allows traders to assess the relative strength conditions of different currency pairs via a color-coded heatmap. By merging the Relative Strength Index (RSI) with a visual heatmap approach, this indicator simplifies market analysis by displaying strength and directional bias of multiple instruments at a glance.
This indicator produces a heatmap based on calculated RSI levels across various assets. The gradient of colors highlights market sentiment: green shades point to oversold levels that may present buying signals, while red tones indicate overbought zones, often associated with potential selling opportunities.
«Indicator Installation & User Guide»
MT4 Indicator Installation | RSI Heatmap Indicator MT5 | ALL Products By TradingFinderLab | Best MT4 Indicator: Refined Order Block Indicator for MT4 | Best MT4 Utility: Trade Assistant Expert TF MT4 | TP & SL Tool: Risk Reward Ratio Calculator RRR MT4 | Money Management: Easy Trade Manager MT4
Indicator Table
| Indicator Category | Signal & Forecast – Technical Tool |
| Platforms | MetaTrader 4 |
| Trading Skills | Entry-Level |
| Indicator Types | Oversold / Overbought |
| Timeframe | M5, M15, M30, H1, H4, Daily |
| Trading Style | Scalping, Intraday, Swing |
| Trading Instruments | Forex Pairs |
Overview
The RSI Heatmap Indicator enables traders to monitor market momentum and evaluate entry or exit zones across multiple timeframes simultaneously. Through real-time color shifts on the heatmap, users can detect emerging trends and identify key reversal points, thereby improving timing and reducing exposure to unfavorable trades.
Bullish Signal Conditions (Buy Scenario)
In the 5-minute USD/JPY chart displayed below, the RSI Heatmap shifts through timeframes (M15, M30, H1) from darker to brighter green. This progression suggests that the asset is emerging from oversold levels, potentially initiating a bullish movement. These cues can assist in timing long positions more effectively.
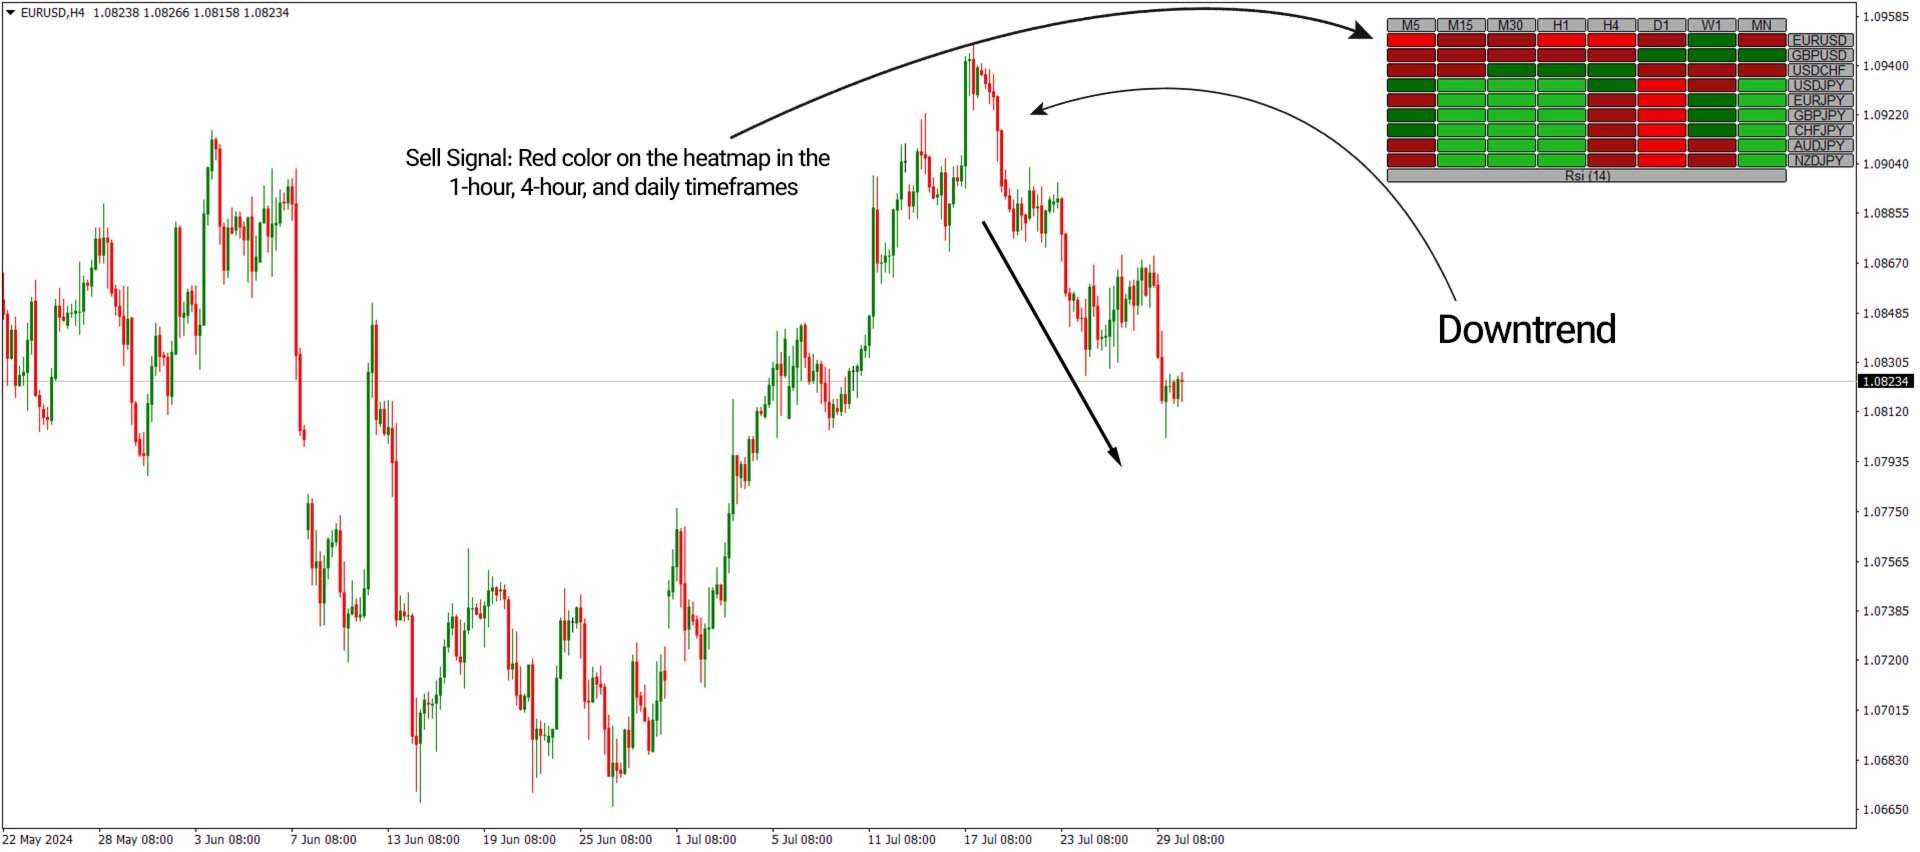
Bearish Signal Conditions (Sell Scenario)
On the EUR/USD 4-hour timeframe, the heatmap showcases a transition from red to deeper red hues across the H1, H4, and Daily timeframes. This change reflects extended overbought pressure, often seen before a bearish phase. Such signals are valuable for identifying short entry setups.
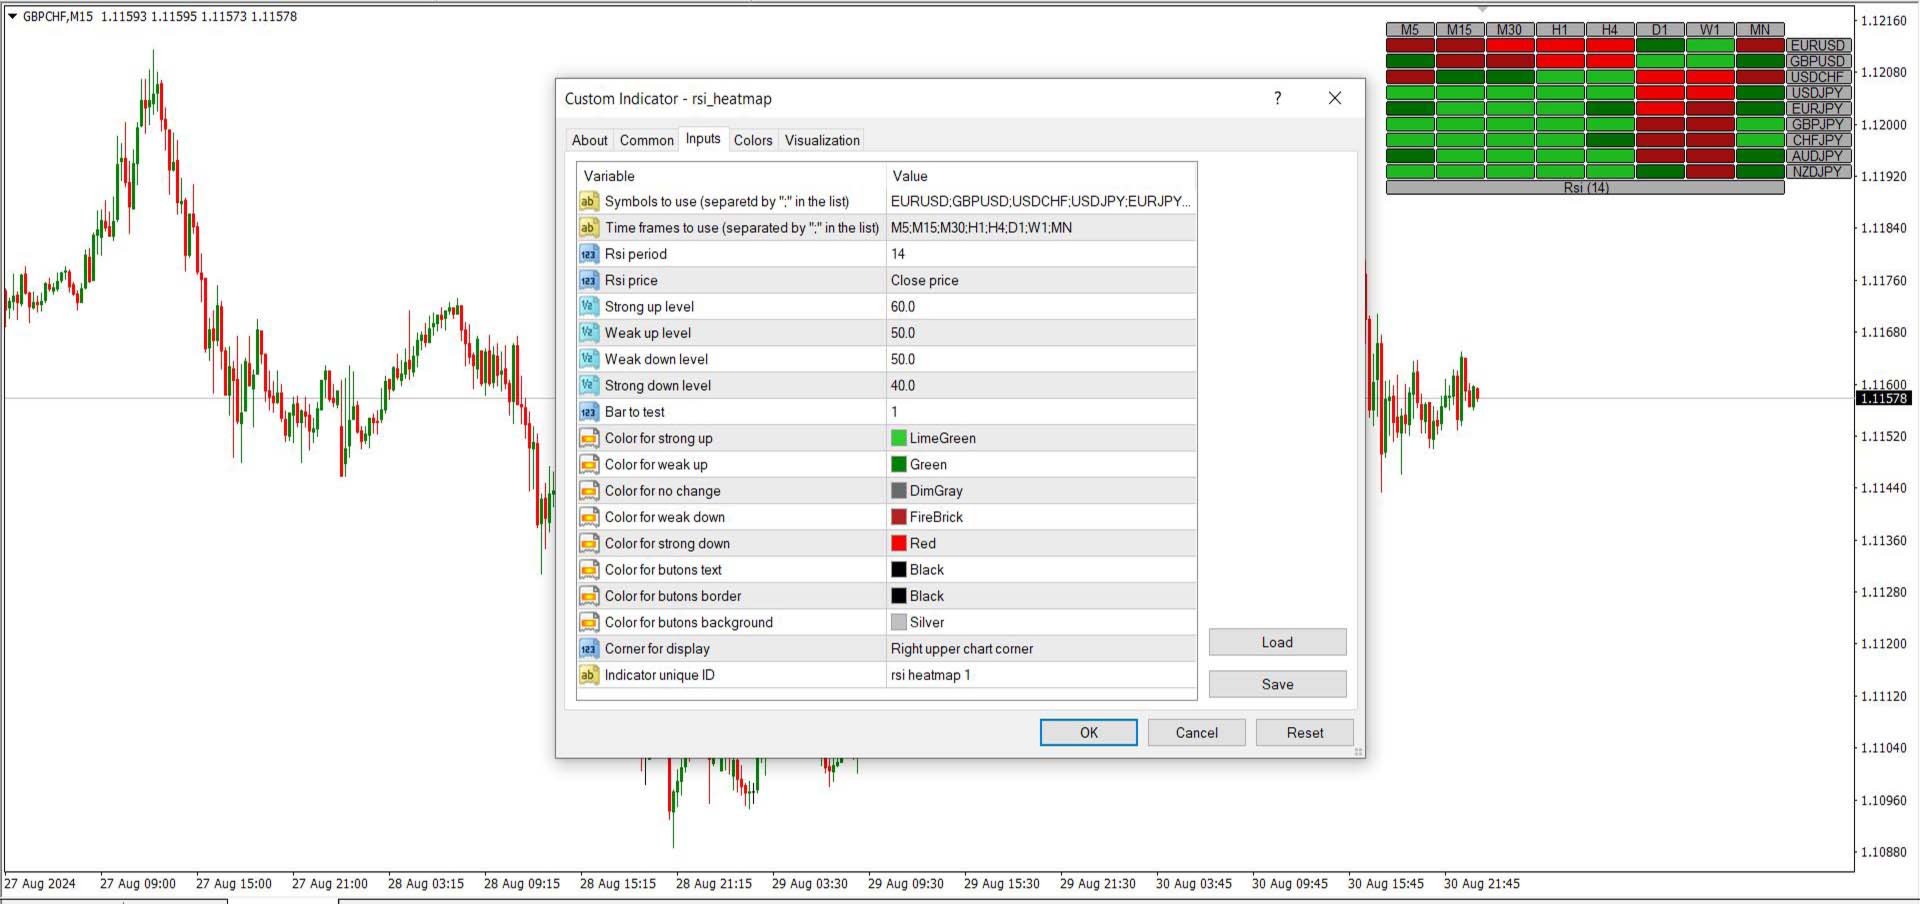
RSI Heatmap Indicator Settings
- Selected Symbols: EURUSD, GBPUSD, USDCHF, USDJPY, EURJPY, GBPJPY, CHFJPY, AUDJPY, NZDJPY
- Monitored Timeframes: M5 to Monthly (MN)
- RSI Period: 14
- RSI Calculation Price: Close
- Upper Threshold (Strong): RSI > 60 (Bullish confirmation)
- Upper Threshold (Weak): RSI > 50
- Lower Threshold (Weak): RSI < 50
- Lower Threshold (Strong): RSI < 40 (Bearish confirmation)
- Bar Evaluated: Second most recent candle
- Color Coding:
- Strong Bullish = Light Green
- Mild Bullish = Green
- Neutral = Gray
- Mild Bearish = Dark Red
- Strong Bearish = Red
- UI Elements:
- Button Text = Black
- Button Border = Black
- Background = Gray
- Chart Display Location: Top-right corner
- Unique ID: RSI Heatmap 1
Summary
The RSI Heatmap Indicator for MetaTrader4 is an essential utility for traders seeking a visual edge in understanding currency strength trends. Whether combined with existing strategies or used independently, it delivers clear RSI-based insights across multiple assets and timeframes, supporting better decision-making and trade validation.