• Visão global
  • Comentários
  • Discussão

RTS5Pattern profi

RTS5Pattern Profi 

Professional Pattern Detection for MetaTrader 5

RTS5Pattern is a professional indicator for MetaTrader 5, created specifically for Price Action traders who rely on clean charts and the key importance of support/resistance levels. This tool combines the simplicity of Price Action with intelligent analysis of recurring price structures. It is designed to quickly and accurately identify price patterns in important contexts—without cluttering the chart with unnecessary indicators.

Why RTS5Pattern for Price Action Traders? Because every pattern tells a story.

No need for oscillators, moving averages, or complex calculations—everything is based on raw price, candles, and market structure.

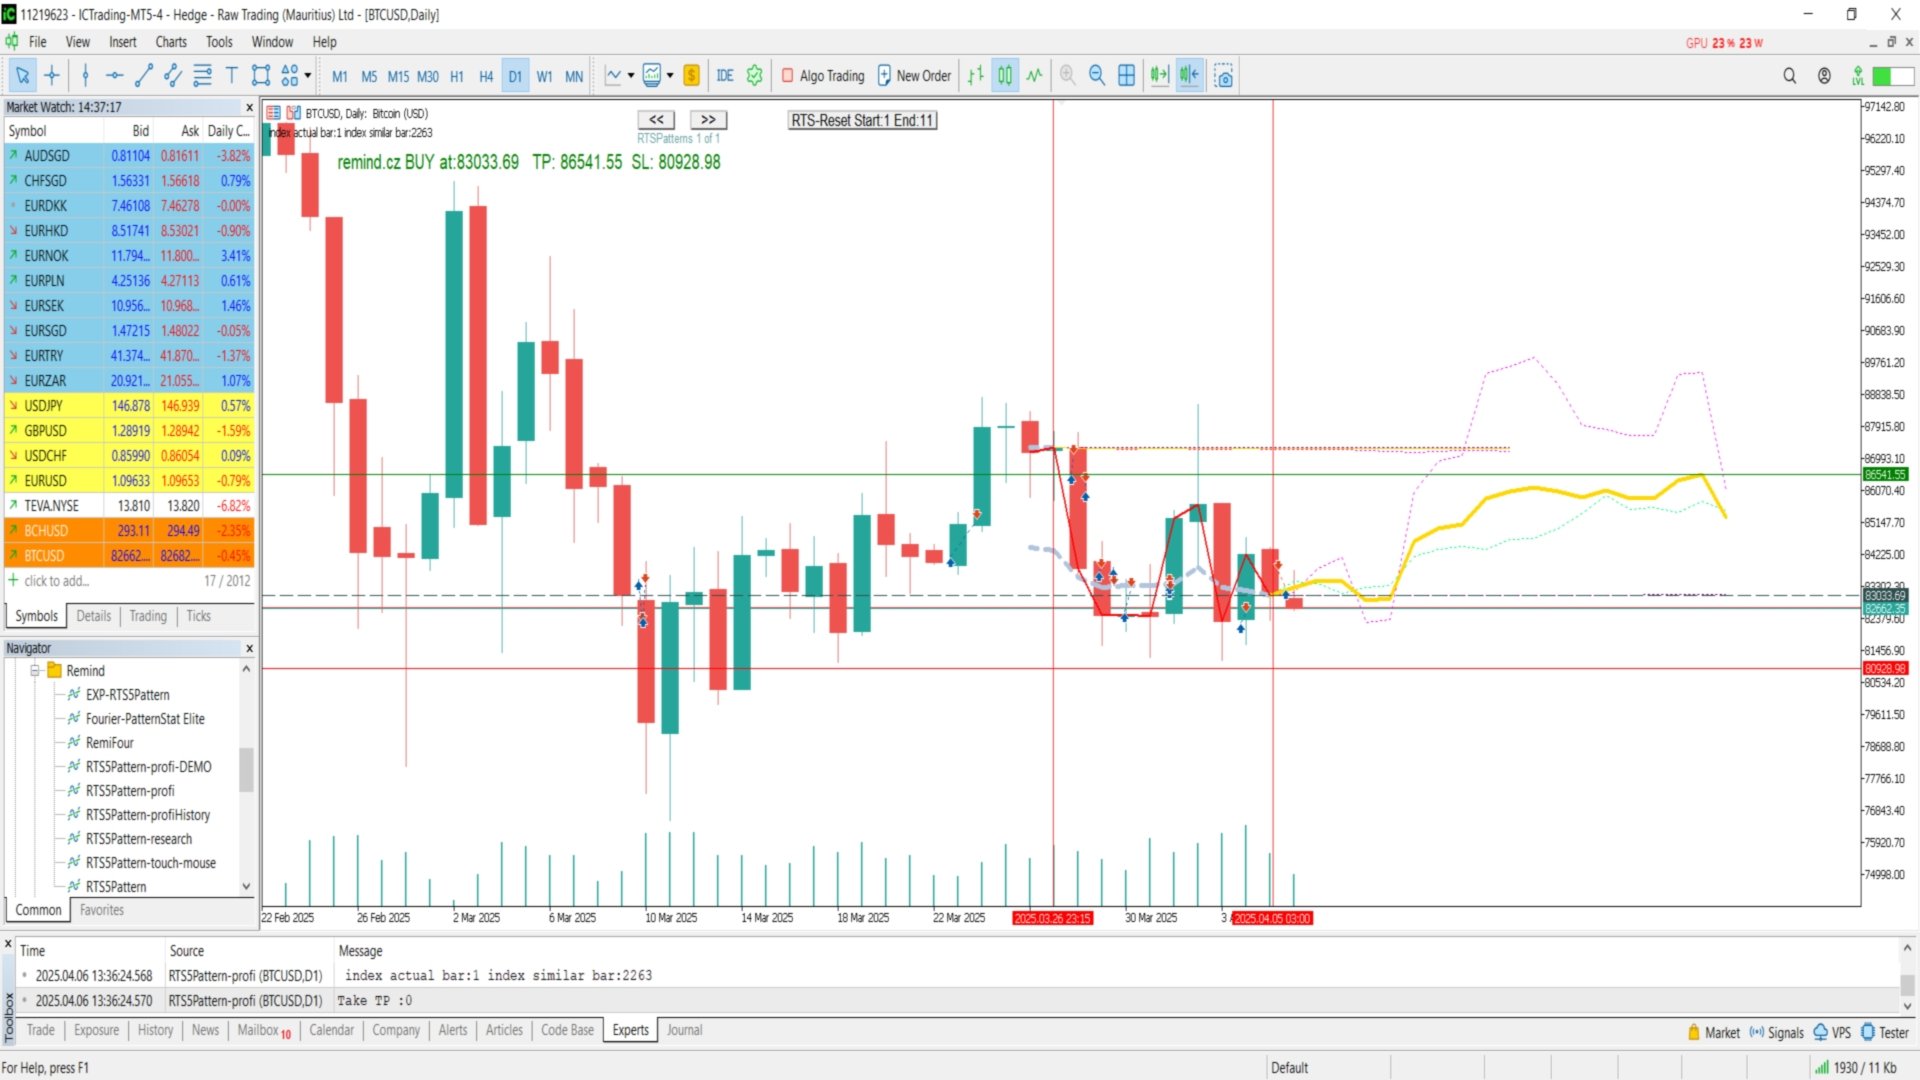
  • Context-based detection: Click on the first and last candle of the pattern near an important S/R level. The indicator scans historical data for similar market conditions and shows how price reacted in those cases.
  • S/R relevance: It works great for bounce tests, false breakouts, returns to balance zones, or breakouts from consolidation.

What can RTS5Pattern do?

  • Pattern detection based on trader’s selection: You decide which candles form a significant pattern (e.g. pin bar, engulfing, or three-candle reversal).
  • Instant comparison with historical situations: The indicator immediately finds and displays the most similar past occurrences along with how price developed afterward.
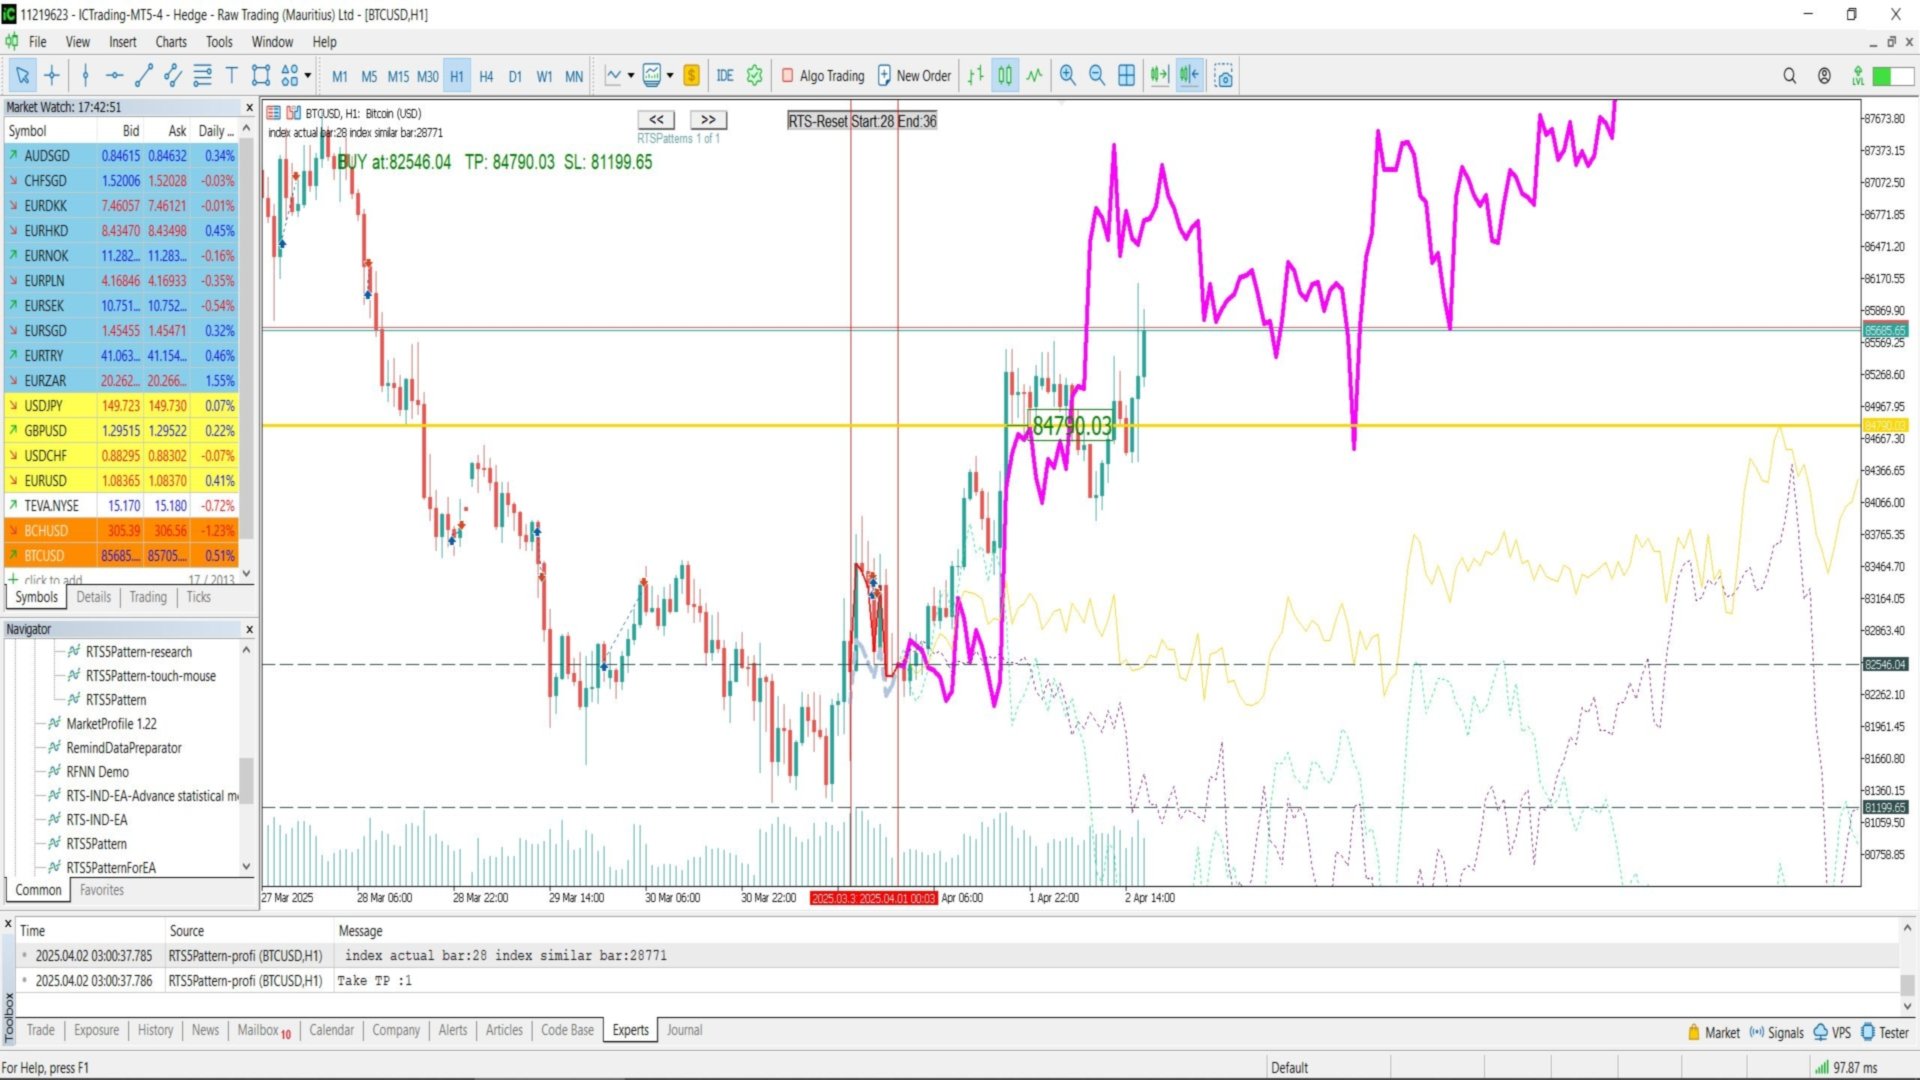
  • Movement prediction: It shows the likely direction and TP/SL distances based on the history of similar patterns.
  • Clean chart: All outputs are drawn subtly and clearly—they do not obscure the candles but complement them.

What does it give you?

  • Backtesting of your Price Action patterns in real historical context.
  • Support in decision-making—whether your pattern has a strong historical precedent.
  • Ability to evaluate pattern strength by seeing how the market moved in similar past situations.
  • High accuracy without overfitting—no curve fitting, no overtrained models.

Recommended Usage for Price Action S/R Style

  1. Prepare your chart – recommended timeframes: M15 to H4. Remove unnecessary indicators. Mark key support and resistance zones.
  2. Visually identify an interesting pattern in the S/R area, for example:
    • a pin bar testing support,
    • a inside bars,
    • a strong rejection after a breakout,
    • a reversal engulfing pattern just below resistance.
  3. Click on the first and last candle of the pattern – this gives the indicator a concrete example. It automatically scans history and finds the closest matches.
  4. Watch the prediction – three historically closest occurrences will be shown on the chart along with probable price movement. The aggregated result (yellow line) shows the dominant direction.
  5. Make decisions based on context:
    • If the pattern behaves historically consistently and shows strong directional movement (clear TP far from entry), the indicator confirms your idea.
    • If the development is erratic or no relevant matches are found, the entry might not be ideal.

Use it to confirm your ideas, not as an automatic entry signal. RTS5Pattern is not a “buy and sell” tool—it is for validating Price Action-based trading decisions.

RTS5Pattern is ideal for anyone trading Price Action and working with classic support/resistance levels. It helps traders quickly and efficiently verify whether their visually identified pattern has historical backing and provides context for future price expectations.

No unnecessary complexity. No overfitted algorithms. Just pure price, Price Action, and the power of history.


Produtos recomendados
This EA has been developed, tested and traded live on NASDAQ M15 TF. Everything is ready for immediate use on real account. Very SIMPLE STRATEGY with only FEW PARAMETERS.  Strategy is based on  EXPANSION ON THE DAILY CHART .   It enters if volatility raise after some time of consolidation .  It uses  STOP   pending orders with  ATR STOP LOSS.   To catch the profits is a  TRAILING PROFIT  function in the strategy.  EA has been backtested on more than 10-year long tick data with 99% quality of mo
Neuro Trader EA is an expert advisor developed using artificial intelligence, designed for analysis and automated trading in financial markets. The advisor focuses on utilizing a neural network, allowing for more flexible and precise responses to market changes. The algorithm analyzes market behavior using weight coefficients and dynamically adapts to changing conditions, making it particularly effective for short-term trading. Features of the Advisor: Neural Network for Decision-Making: The adv
CChart
Rong Bin Su
Overview In the fast-paced world of forex and financial markets, quick reactions and precise decision-making are crucial. However, the standard MetaTrader 5 terminal only supports a minimum of 1-minute charts, limiting traders' sensitivity to market fluctuations. To address this issue, we introduce the Second-Level Chart Candlestick Indicator , allowing you to effortlessly view and analyze market dynamics from 1 second to 30 seconds on a sub-chart. Key Features Support for Multiple Second-Level
TradeInfo MT5
Manuraj Dhanda
3.88 (8)
TradeInfo is a utility indicator which displays the most important information of the current account and position. Displayed information: Information about the current account (Balance, Equity, Free Margin). Current spread, current drawdown (DD), planned profit, expected losses, etc. Number of open position(s), volume (LOT), profit. Today’s and yesterday’s range. Remaining time to the next candle. Last day profit information. MagicNumber filter. Comment filter. Indicator parameters: ShowPro
FREE
Tim Trend
Oleksii Ferbei
Due to the fact that at each separate period of time, trading and exchange platforms from different parts of the planet are connected to the trading process, the Forex market operates around the clock. Depending on which continent trading activity takes place during a certain period, the entire daily routine is divided into several trading sessions. There are 4 main trading sessions: Pacific. European. American Asian This indicator allows you to see the session on the price chart. You can also
Gann Box MT5
Frederic Jacques Collomb
O indicador Gann Box é uma ferramenta poderosa e versátil projetada para ajudar os traders a identificar e explorar os níveis-chave do mercado. Este indicador permite desenhar um retângulo no gráfico, que é automaticamente dividido em várias zonas com níveis estratégicos 0, 0.25, 0.50, 0.75, 1 . Quando o preço atinge um desses níveis, alarmes são acionados, oferecendo assim uma ajuda valiosa para as decisões de trading. Você sabe instantaneamente como o mercado está evoluindo em relação à zona q
General Clock
Fernando Lahude Ritter
A Simple clock that on the left side "Time" shows r espectively the TimeCurrent, followed beneath by the TimeLocal. On the right hand side we have the remaining minutes and seconds of the current candle. TimeLocal is synced every 500 miliseconds however, the TimeCurrent and the time left on the candle are synced every tick, so this can lead to inconsistencies on the readings so keep that in mind. This indicator have no plots or buffers so it cannot be used in any time based EA.
FREE
MTF MultiMeter5
GRANTLEY LAURENCE CAUSE
Benefits: A new and innovative way of looking across multiple timeframes and multiple indicators on any chart. Provides instant multi-timeframe analysis of any market. i.e. forex currency pairs, cryptocurrency pairs, commodities, etc. It offers precise indications across multiple timeframes of volatility as measured by RSI, ADX and STOCH within one chart. Helps you determine high probability trading setups. See example strategy in comments. Can see bullish/bearish volatility building across mult
About indicator > The indicator is a function based on one value (open/high prices up to now) and then it is a mathematical representation of the whole function that is totally independent from any else values. So, if you ask yourself will the future be as it is on the graph... I can tell you - as it was the same as the trading function up to the moment "now"... In conclusion, the point of the indicator is  to try to show the future of the trading function into eternity. The graphic is sometime
The UZFX - Delete All Drawing and Objects on Chart Instantly is a simple yet powerful MetaTrader 5 (MT5) script designed to instantly remove all drawing objects from the active chart. This script is useful for traders who need to quickly clear their charts from technical analysis drawings, trend lines, Fibonacci tools, text labels, and other objects without manually deleting them one by one. Checkout All Other Products -->  HERE Features: Deletes all objects and drawings on the active chart. W
FREE
The professional browser of News and Trading Sessions is now available in MetaTrader 5. Now all the most important market information is collected on one dial! News located on the Time scale. Planning your working time has never been so easy and convenient ... The news scale can be switched a day, two, a week, a month forward or backward (see the details in the short video). All news updates in real time. Thanks to the built-in filters, you can configure the display of news by importance, cou
Find My Rules
Daniel Maximiliano Serkin
Find My Rules   It is an fully custimizable Expert Advisor. You can choose multiple parameters that act as a trigger to execute a buy or sell order.  The parameters available to configure to your liking are:  lots, stop loss, take profit, dynamic lots, order type,timeframe. Indicator combinations for triggering orders and for preconditions (two factors) are:  RSI, EMA1, EMA2, EMA3, EMA4,MACD. INPUTS PARAMETERS: OPERATION OPTIONS magic number =  number for identification lots  =  lots for operati
QuantumAlert Stoch Navigator is a free indicator available for MT4/MT5 platforms, its work is to provide "alerts" when the market is inside "overbought and oversold" regions in the form of "buy or sell" signals. This indicator comes with many customization options mentioned in the parameter section below, user can customise these parameters as needful. Join our   MQL5 group , where we share important news and updates. You are also welcome to join our private channel as well, contact me for the p
FREE
Show Pips for MT5
Roman Podpora
4.64 (22)
Este indicador de informação será útil para quem quer estar sempre atento à situação atual da conta. -   Indicadores mais úteis O indicador exibe dados como lucro em pontos, porcentagem e moeda, bem como o spread do par atual e o tempo até o fechamento da barra no período atual. Existem várias opções para colocar a linha de informação no gráfico: À direita do preço (corre atrás do preço); Como comentário (no canto superior esquerdo do gráfico); No canto selecionado da tela. Também é possível se
FREE
Multi Light MT5
Volodymyr Zubov
The multi-currency EA provides the ability to manage trading on 30 symbols from a single interface in MetaTrader 5. It is based on a comprehensive approach to market analysis. Forex pairs and metals such as XAUUSD and XAGUSD are supported. Automatic processing of symbol names is possible for users. The EA is equipped with a self-learning mechanism that dynamically adjusts the entry threshold depending on changes in market conditions and transaction statistics. Options allow you to choose betwee
Essa ferramenta Pequena permite definir um contador de tempo em minutos para o fechamento de suas posições de acordo com o número de minutos que você definiu. Por exemplo, se você definir 30 Min, a ferramenta fechará cada posição aberta após 30 minutos de sua abertura. As configurações ATIVO: É para ativar a ferramenta e usá-la para fechar suas posições após o número de minutos definido. GERENCIAR: você pode escolher com os símbolos gerenciados pela ferramenta. Escolha "TODAS AS CU
FREE
Candle Perspective Structure Indicator MT5 is a simple indicator that defines and displays the candlestick structure of the market. This indicator will suit both experienced traders and beginners who find it difficult to follow the structure visually. Main functions: Determining High and Low swings using the three candlestick pattern. Determination of structure breaks. Setting the visual display of structural elements. Setting the period for which the structure is analysed. Input parameters:
FREE
MACD Level Alert MT5
Prafull Manohar Nikam
This is a simple arrow system based on MACD indicators Main/Base line and MACD Levels. It gives you alerts when MACD's Main Line crosses above/below certain level. Which type of alerts available? 1. It paints on chart Up/Down Arrows. 2. Popup message and sound alert in trading terminal window. 3. Push notification or Alert on your android and ios mobile phones (requires MT4 or MT5 app installed!)
This Utility Bot is for New Traders, that struggle to spot the Trend direction. It also make you conscious about different Timeframes Bar Status.  Utility have 3 Moving Averages totally configurable by input parameters. 3MA Based Trend is shown for the current Timeframe selected on the chart. (Line 1) 3MA Based Trend for Daily Timeframe. (Line 2nd) Also provide quick information about the currently Hourly Daily and Weekly Candle Status.  Utility work on 1 Min Bar control, so comment section info
FREE
Auto Trend Fit
Ross Adam Langlands Nelson
5 (4)
Automatic Trend Line Fit. This indicator automatically plots the straight line and parabolic (curved) trend to any symbol at any timeframe. The plotted straight line is a good indication of the current trend and the curved line is an indication of a change momentum or change in the current trend. Plotting the straight line over about 2/3 the number of candles as the curved line is usually a good way to determine entry and exit points as it shows the current trend and momentum of the market. This
FREE
Trade Panel R3
Eduardo Terra
5 (1)
Painel de negociação, simples e fácil de usar. Substitui o painel padrão do Meta Trader 5. Este novo painel permite acrescentar stop loss e take profit (em pontos). Também permite clicar e arrastar ele para qualquer lugar da tela, facilitando a parte visual e operacional. Escolha a cor do painel, e a posição inicial do mesmo, bem como se deseja desabilitar o painel padrão do MT5. Ao fechar o Trade Panel R3, o painel padrão do MT5 será restaurado. A opção Expert advisor > Permitir algotrading dev
FREE
Special time limited offer: BUY for 70 USD. Be a market analyst, not just a trader! Stop wasting time by round-the-clock market mionitoring. Do your market analysis, set trading range and market sentiment for a day session and let this EA trade for you! It was created to help all day traders using price action to distance themselves from the emotional influence caused by instant market monitoring and routine decisions to open and close trades which is the source of most trading mistakes.
Highly configurable Average True Range (ATR) indicator. Features: Highly customizable alert functions (at levels, crosses, direction changes via email, push, sound, popup) Multi timeframe ability Color customization (at levels, crosses, direction changes) Linear interpolation and histogram mode options Works on strategy tester in multi timeframe mode (at weekend without ticks also) Adjustable Levels Parameters: ATR Timeframe: You can set the lower/higher timeframes for ATR. ATR Bar Shift: you
FREE
Demo Version of Strategy Manager Plus ! This Demo is a simply view of the Dashboard with the followings strategy :    - if SMA 6 is upper than SMA 18 --> Blue color    - if SMA 6 is lower than SMA 18 --> Red Color No need of the external GUI, Load configuration is not available, no manual trading is available. Visit  https://www.mql5.com/en/market/product/46420  for full version !
FREE
Axilgo PipPiper CoPilot
Theory Y Technologies Pty Ltd
5 (2)
Axilgo Pip Piper CoPilot Elevate your trading game with the Axilgo Pip Piper CoPilot, the first in our revolutionary Pip Piper Series. This all-inclusive toolset is meticulously crafted for serious traders, focusing on key areas such as Risk Management, Trade Management, Prop Firm Rule Compliance, and Advanced Account Management . With CoPilot, you’re not just investing in a tool—you’re gaining a strategic partner in the intricate world of trading. Important Notice: To ensure you receive the fu
FREE
Previous High Low Levels
Artur Alves De Carvalho
The Previous High Low Levels indicator displays the high and low of the previous candle from a selected higher timeframe. This helps traders identify key support and resistance zones while trading on lower timeframes. Features: Plots the previous high and low from a higher timeframe Works on all timeframes and instruments Helps identify strong support and resistance levels Lightweight and does not repaint How to Use: Select a higher timeframe (e.g., H1, H4, D1) in the settings. T
FREE
Afribold Cybernetic Affluence
Itumeleng Mohlouwa Kgotso Tladi
AfriBold Cybernetic Affluence  Your Key to Autonated Trading In the dynamic world of financial markets, navigating the intricate patterns and making informed decisions can be a daunting task. Even seasoned traders face challenges in consistently outperforming the market. This is where the AfriBold Cybernetic Affluence emerges as a powerful tool, designed to automate your trading strategies. Harnessing the Power of AI The AfriBold Cybernetic Wealth Expert Advisor is a cutting-edge trading tool
Visual EMA Trend Force Indicator
AL MOOSAWI ABDULLAH JAFFER BAQER
VisualEMA TrendForce Indicator — Empower Your Trading with Precision Price: $65 Discover a Smarter Way to Trade with EMAs! The VisualEMA TrendForce Indicator is designed to elevate your trading with a reliable and visually intuitive trend-following system. Leveraging the power of Exponential Moving Averages (EMAs), this indicator provides actionable buy and sell signals based on dynamic market conditions, enabling traders to capture profitable trends with confidence. Core Features: Dynamic EMA
Esta pequena ferramenta ajuda você a definir seu gerenciamento de riscos com um simples arrastar de linha no gráfico. Ele mostra o tamanho real do lote calculado na% da conta ou no valor fixo em dinheiro diretamente na linha. Tudo o que você precisa fazer é ativar a linha pressionando a tecla “t” do teclado e arrastar a linha até o ponto de stop loss. É isso. Nas configurações você pode definir a cor e a largura da linha e do texto, também o espaço do texto a linha e à direita e pode definir o
FREE
Positions Risk Analyzer
Jacobus Nicolaas Van Staden
Positions Risk Analyzer Utility The Trade Analyzer is a powerful tool designed for real-time monitoring of your trading performance directly on the chart. It provides insights into: Total Open Positions : Number of active trades. Potential Profit (TP) : Estimated profit if all Take Profits are hit. Potential Loss (SL) : Maximum potential loss if all Stop Losses are triggered. Floating Profit/Loss : Real-time net profit or loss of all open trades. This utility dynamically updates its calculation
FREE
Os compradores deste produto também adquirem
Quantum TrendPulse
Bogdan Ion Puscasu
5 (13)
Apresentando   Quantum TrendPulse   , a ferramenta de negociação definitiva que combina o poder do   SuperTrend   ,   RSI   e   Stochastic   em um indicador abrangente para maximizar seu potencial de negociação. Projetado para traders que buscam precisão e eficiência, este indicador ajuda você a identificar tendências de mercado, mudanças de momentum e pontos de entrada e saída ideais com confiança. Principais características: Integração SuperTrend:   siga facilmente a tendência predominante do
Este é sem dúvida o indicador de reconhecimento automático de formação de preço harmônico mais completo que você pode encontrar para a MetaTrader Platform. Ele detecta 19 padrões diferentes, leva as projeções de Fibonacci tão a sério quanto você, exibe a Zona de Reversão Potencial (PRZ) e encontra níveis adequados de stop loss e take-profit. [ Guia de instalação | Guia de atualização | Solução de problemas | FAQ | Todos os produtos ] Detecta 19 formações harmônicas de preços diferentes Traça
MTF Supply Demand Zones MT5
Georgios Kalomoiropoulos
5 (1)
Próxima geração de zonas automatizadas de oferta e demanda. Algoritmo novo e inovador que funciona em qualquer gráfico. Todas as zonas estão sendo criadas dinamicamente de acordo com a ação do preço do mercado. DOIS TIPOS DE ALERTAS --> 1) QUANDO O PREÇO ATINGE UMA ZONA 2) QUANDO UMA NOVA ZONA É FORMADA Você não recebe mais um indicador inútil. Você obtém uma estratégia de negociação completa com resultados comprovados.     Novas características:     Alertas quando o preço atinge a zona d
O Oscilador de Índice de Precisão (Pi-Osc) de Roger Medcalf da Precision Trading Systems A Versão 2 foi cuidadosamente reconfigurada para carregar rapidamente em seu gráfico, e algumas outras melhorias técnicas foram incorporadas para aprimorar a experiência. O Pi-Osc foi criado para fornecer sinais precisos de temporização de negociações projetados para encontrar pontos de exaustão extremos, os pontos para os quais os mercados são forçados a ir apenas para tirar as ordens de todos. Este pro
MetaBands M5
Vahidreza Heidar Gholami
4.5 (2)
MetaBands utiliza algoritmos poderosos e únicos para desenhar canais e detectar tendências, a fim de fornecer aos traders pontos potenciais para entrar e sair de negociações. É um indicador de canal mais um indicador de tendência poderoso. Inclui diferentes tipos de canais que podem ser mesclados para criar novos canais simplesmente usando os parâmetros de entrada. O MetaBands usa todos os tipos de alertas para notificar os usuários sobre eventos de mercado. Recursos Suporta a maioria dos algori
The   Time_Price_SQ9_Degree   indicator is based on the 9 Gann square. Using this indicator, you can identify strong time and price zones. The indicator displays the levels as a degree value. The degrees can be set in the settings. After launching, the MENU button appears. If it is highlighted, it can be moved to any point on the graph, and after double-clicking on it, it stops being highlighted and menu buttons appear. To hide the menu, just double-click on the button, it will become highlight
Indicador único que implementa uma abordagem profissional e quantitativa para significar negociação de reversão. Ele capitaliza o fato de que o preço desvia e retorna à média de maneira previsível e mensurável, o que permite regras claras de entrada e saída que superam amplamente as estratégias de negociação não quantitativas. [ Installation Guide | Update Guide | Troubleshooting | FAQ | All Products ] Sinais de negociação claros Incrivelmente fácil de negociar Cores e tamanhos personalizáveis
TPSpro RFI Levels MT5
Roman Podpora
4.55 (20)
Zonas de reversão / Volumes de pico / Zonas ativas de um grande player =       SISTEMA TS TPSPRO INSTRUÇÕES RUS       /       INSTRUÇÕES       ENG       /           Versão MT4        Cada comprador deste indicador recebe adicionalmente GRATUITAMENTE: 6 meses de acesso aos sinais de negociação do serviço RFI SIGNALS - pontos de entrada prontos de acordo com o algoritmo TPSproSYSTEM. Materiais de treinamento com atualizações regulares - mergulhe na estratégia e aumente seu nível profissional. Su
Legend mt5
Vladyslava Shaviernieva
This is an indicator that includes the best basic forex indicators , without redrawing. Based on this data, a sell or buy signal is generated. It does not disappear anywhere after the signal, which gives us the opportunity to see the results on the history. It can be used on any currency pair, crypto, metals, stocks It is best used on an hourly chart, but other periods are also acceptable. The best results for the period H1,H4,daily If customers have any questions, I will answer them and af
RelicusRoad Pro MT5
Relicus LLC
4.78 (18)
Agora US $ 147 (aumentando para US $ 499 após algumas atualizações) - Contas ilimitadas (PCs ou Macs) Manual do usuário do RelicusRoad + vídeos de treinamento + acesso ao grupo de discórdia privado + status VIP UMA NOVA FORMA DE OLHAR PARA O MERCADO O RelicusRoad é o indicador de negociação mais poderoso do mundo para forex, futuros, criptomoedas, ações e índices, oferecendo aos traders todas as informações e ferramentas necessárias para se manterem rentáveis. Fornecemos análises técnicas e
DESCRIÇÃO ICSM (Impulse-Correction SCOB Mapper) é o indicador que analisa o movimento do preço e identifica impulsos válidos, correções e SCOBs (Single Candle Order Block). É uma ferramenta poderosa que pode ser usada com qualquer tipo de análise técnica porque é flexível, informativa, fácil de usar e melhora substancialmente a consciência do trader sobre as zonas de interesse mais líquidas. CONFIGURAÇÕES Geral | Visuais Tema de cor — define o tema de cor do ICSM. SCOB | Visuais Mostrar S
Advanced Supply Demand MT5
Bernhard Schweigert
4.5 (14)
Atualmente com 33% de desconto! A melhor solução para qualquer Trader Novato ou especialista! Este indicador é uma ferramenta de negociação exclusiva, de alta qualidade e acessível porque incorporamos uma série de recursos proprietários e uma nova fórmula. Com esta atualização, você poderá mostrar fusos horários duplos. Você não só será capaz de mostrar um TF mais alto, mas também mostrar ambos, o TF do gráfico, MAIS o TF mais alto: MOSTRANDO ZONAS ANINHADAS. Todos os traders de Oferta e Demanda
FxaccurateLS
Shiv Raj Kumawat
WHY IS OUR FXACCCURATE LS MT5 THE PROFITABLE ? PROTECT YOUR CAPITAL WITH RISK MANAGEMENT Gives entry, stop and target levels from time to time. It finds Trading opportunities by analyzing what the price is doing during established trends. POWERFUL INDICATOR FOR A RELIABLE STRATEGIES We have made these indicators with a lot of years of hard work. It is made at a very advanced level. Established trends provide dozens of trading opportunities, but most trend indicators completely ignore them! The
Blahtech Supply Demand MT5
Blahtech Limited
4.54 (13)
Was: $299  Now: $149  Supply Demand uses previous price action to identify potential imbalances between buyers and sellers. The key is to identify the better odds zones, not just the untouched ones. Blahtech Supply Demand indicator delivers functionality previously unavailable on any trading platform. This 4-in-1 indicator not only highlights the higher probability zones using a multi-criteria strength engine, but also combines it with multi-timeframe trend analysis, previously confirmed swings
Wolfe Waves são padrões de negociação naturais presentes em todos os mercados financeiros e representam uma luta por um preço de equilíbrio. Esses padrões podem se desenvolver em prazos de curto e longo prazo e são um dos padrões de reversão preditiva mais confiáveis existentes, normalmente precedendo movimentos de preços fortes e longos. [ Guia de instalação | Guia de atualização | Solução de problemas | FAQ | Todos os produtos ] Sinais de negociação claros Surpreendentemente fácil de negociar
MT4 Version SMT Divergences MT5 SMT Divergences is one of the most innovative indicators in the market. It offers the possibility of analyzing price divergences between 2 pairs. These divergences highlight and help to foresee what banks and institutions are planning to do. SMT divergences also provides you with a kill zones indicator and the possibility of filtering divergences occurring during these kill zones.  This indicator is specially powerful if applied in 2 highly correlated pairs. A pri
TPA True Price Action indicator reveals the true price action of the market makers through 100% non-repainting signals strictly at the close of a candle! TPA shows entries and re-entries, every time the bulls are definitely stronger than the bears and vice versa. Not to confuse with red/green candles. The shift of power gets confirmed at the earliest stage and is ONE exit strategy of several. There are available now two free parts of the TPA User Guide for our customers. The first "The Basics"
Volume by Price MT5
Brian Collard
3.25 (4)
Volume Profile, Footprint and Market Profile TPO (Time Price Opportunity). Volume and TPO histogram bar and line charts. Volume Footprint charts. TPO letter and block marker collapsed and split structure charts. Static, dynamic and flexible range segmentation and compositing methods with relative and absolute visualizations. Session hours filtering and segment concatenation with Market Watch and custom user specifications. Graphical layering, positioning and styling options to suit the user's a
Was: $249  Now: $149   Market Profile defines a number of day types that can help the trader to determine market behaviour. A key feature is the Value Area, representing the range of price action where 70% of trading took place. Understanding the Value Area can give traders valuable insight into market direction and establish the higher odds trade. It is an excellent addition to any system you may be using. Inspired by Jim Dalton’s book “Mind Over Markets”, this indicator is designed to suit the
IQ Gold Gann Levels a non-repainting, precision tool designed exclusively for XAUUSD/Gold intraday trading. It uses W.D. Gann’s square root method to plot real-time support and resistance levels, helping traders spot high-probability entries with confidence and clarity. William Delbert Gann (W.D. Gann) was an exceptional market analyst, whose trading technique was based on a complex blend of mathematics, geometry, astrology, and ancient mathematics which proved to be extremely accurate. Download
Royal Wave Pro M5
Vahidreza Heidar Gholami
3.5 (4)
Royal Wave is a Trend-Power oscillator which has been programmed to locate and signal low-risk entry and exit zones. Its core algorithm statistically analyzes the market and generates trading signals for overbought, oversold and low volatile areas. By using a well-designed alerting system, this indicator makes it easier to make proper decisions regarding where to enter and where to exit trades. Features Trend-Power Algorithm Low risk Entry Zones and Exit Zones Predictions for Overbought and Over
CBT Quantum Maverick Sistema de Negociação de Opções Binárias de Alta Eficiência O CBT Quantum Maverick é um sistema de opções binárias de alto desempenho, projetado para traders que buscam precisão, simplicidade e um enfoque disciplinado. Não exige personalização: o sistema está otimizado para resultados eficazes desde o início. Basta seguir os sinais, que podem ser dominados com um pouco de prática. Principais características: Precisão nos sinais: Sinais baseados na próxima vela, utilizando
Super Zone indicator
Dmitriy Sotnikov
5 (1)
Super Zone   For several years of observing the principles of the market, Super Zone worked, both then and now, because the indicator  allows you to see the trading range of the  week and even the month that major market participants use. It’s very easy to use, we work on H4 in the weekly range (  in the tester it doesn’t work in the demo mode  ) - we sell from the upper zones, we buy from the lower ones. It marks the zones from the beginning of the week (month) that are  not redrawn  , works on
MetaForecast M5
Vahidreza Heidar Gholami
5 (3)
MetaForecast prevê e visualiza o futuro de qualquer mercado com base nas harmonias nos dados de preços. Embora o mercado nem sempre seja previsível, se houver um padrão nos preços, o MetaForecast pode prever o futuro com a maior precisão possível. Em comparação com outros produtos similares, o MetaForecast pode gerar resultados mais precisos ao analisar as tendências do mercado. Parâmetros de entrada Past size (Tamanho do passado) Especifica o número de barras que o MetaForecast usa para criar
PZ Trend Trading MT5
PZ TRADING SLU
3.8 (5)
O Trend Trading é um indicador projetado para lucrar o máximo possível com as tendências que ocorrem no mercado, cronometrando retrocessos e rupturas. Ele encontra oportunidades de negociação analisando o que o preço está fazendo durante as tendências estabelecidas. [ Guia de instalação | Guia de atualização | Solução de problemas | FAQ | Todos os produtos ] Negocie mercados financeiros com confiança e eficiência Lucre com as tendências estabelecidas sem ser chicoteado Reconhecer retrocessos
Royal Scalping Indicator M5
Vahidreza Heidar Gholami
5 (6)
Royal Scalping Indicator is an advanced price adaptive indicator designed to generate high-quality trading signals. Built-in multi-timeframe and multi-currency capabilities make it even more powerful to have configurations based on different symbols and timeframes. This indicator is perfect for scalp trades as well as swing trades. Royal Scalping is not just an indicator, but a trading strategy itself. Features Price Adaptive Trend Detector Algorithm Multi-Timeframe and Multi-Currency Trend Low
Berma Bands
Muhammad Elbermawi
5 (3)
O indicador Berma Bands (BBs) é uma ferramenta valiosa para traders que buscam identificar e capitalizar tendências de mercado. Ao analisar a relação entre o preço e os BBs, os traders podem discernir se um mercado está em uma fase de tendência ou de variação. Visite o [ Blog Berma Home ] para saber mais. As Bandas de Berma são compostas por três linhas distintas: a Banda de Berma Superior, a Banda de Berma Média e a Banda de Berma Inferior. Essas linhas são plotadas em torno do preço, criando u
[ MT4 Version ] Are you tired of spending months on demo or live accounts to test your trading strategies? The Backtesting Simulator is the ultimate tool designed to elevate your backtesting experience to new heights. Utilizing Metatrader historical symbol information, it offers an unparalleled simulation of real market conditions. Take control of your testing speed, test ideas quickly or at a slower pace, and witness remarkable improvements in your testing performance. Forget about wasting tim
KT Trend Trading Suite MT5
KEENBASE SOFTWARE SOLUTIONS
O KT Trend Trading Suite é um indicador multifuncional que combina uma estratégia de acompanhamento de tendência com múltiplos pontos de rompimento como sinais de entrada. Assim que uma nova tendência é estabelecida, o indicador oferece várias oportunidades de entrada para aproveitar o movimento. Um limite de recuo é utilizado para evitar entradas menos significativas. Versão para MT4 disponível aqui  https://www.mql5.com/en/market/product/46268 Recursos Combina diversas dinâmicas de mercad
Timeframes Trend Scanner   is a trend analyzer or trend screener indicator that helps you know the trend in   all timeframes of selected symbol you are watching . This indicator provides clear & detailed analysis results on a beautiful dashboard, let you able to use this result right away without need to do any additional analysis. How it works Step 1: Calculate values of 23 selected & trusted technical indicators (Oscillator & Moving Average indicators) Step 2: Analyze all indicators using bes
Mais do autor
The indicator provides a superior alternative to price action analysis. It enables the identification of normalized patterns, which are then transformed into a graphical representation to forecast future steps within a time series. In the top-left corner, you'll find information regarding the expected prediction accuracy, determined through a complex MSQE calculation. You have the flexibility to adjust the time window, making it easy to validate the indicator's performance. Additionally, you can
Indicator Name : Fourier Transform Curve Indicator Description : The Fourier Transform Curve Indicator for MetaTrader 5 is a powerful tool that leverages Fourier analysis to depict curves directly on your price chart. It is designed to provide valuable insights into the underlying harmonic components of the price data. Parameters : Input Candle Count : This parameter allows you to specify the number of candles to include in the Fourier transformation calculation. A higher value will capture lon
Filtro:
Sem comentários
Responder ao comentário