TrendWaveAnalyzer
- Utilitários
- Rong Bin Su
- Versão: 1.0
- Ativações: 5
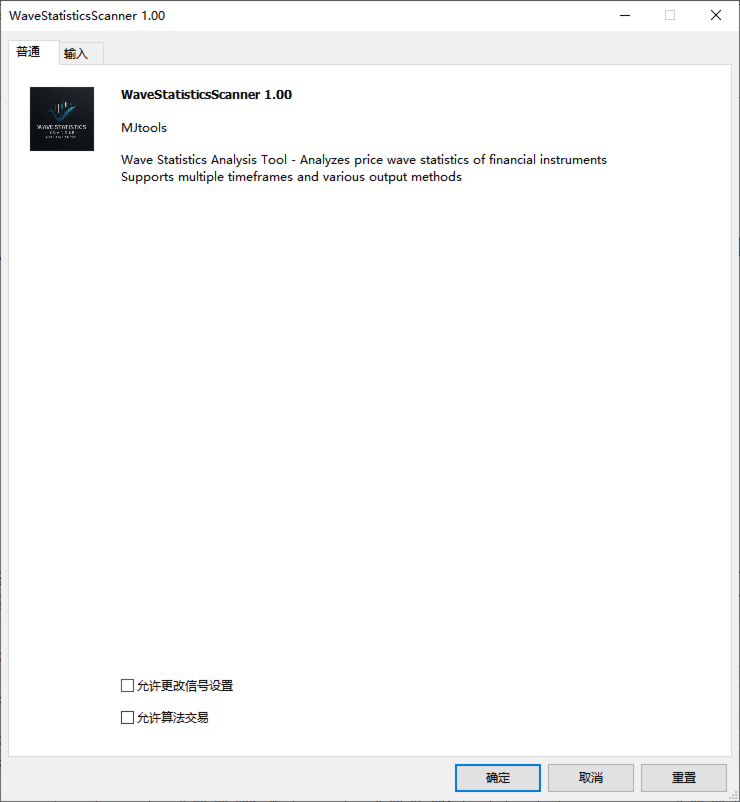
Overview
The Wave Statistics Scanner is a specialized MQL5 tool for MetaTrader 5 that performs statistical analysis of price volatility across multiple financial instruments.It focuses on identifying and measuring price waves(high-low ranges)within individual price bars,allowing traders to quantify market volatility and identify potential trading opportunities based on statistical patterns.
#Key Features
-Multi-symbol Scanning:Analyze volatility across multiple trading instruments
-Volatility Measurement:Quantifies price ranges using points or price values
-Wave Categorization:Automatically classifies waves as small,medium,or large
-Time Filtering:Allows analysis during specific trading sessions or days
-Direction Analysis:Identifies bullish,bearish,or neutral price movements
-Visual Representation:Highlights significant price waves directly on charts
-Data Export:Saves detailed wave data to CSV files for further analysis
-Frequency Analysis:Calculates the frequency of waves exceeding specified thresholds
#Technical Approach
The tool examines the high-low range of each price bar to measure volatility,then applies filtering criteria to identify statistically significant waves.It provides comprehensive statistics on wave distribution,helping traders understand typical volatility patterns in different market conditions and timeframes.
Installation
1.Download the WaveStatisticsScanner.mq5 file
2.Open MetaTrader 5 platform
3.Navigate to File→Open Data Folder
4.Place the file in the MQL5/Scripts folder
5.Restart MetaTrader 5 or refresh the Navigator panel
6.The script will appear in the Navigator under"Scripts"
Running the Analysis
1.Open a chart for any symbol you wish to analyze
2.Double-click on the WaveStatisticsScanner script in the Navigator panel
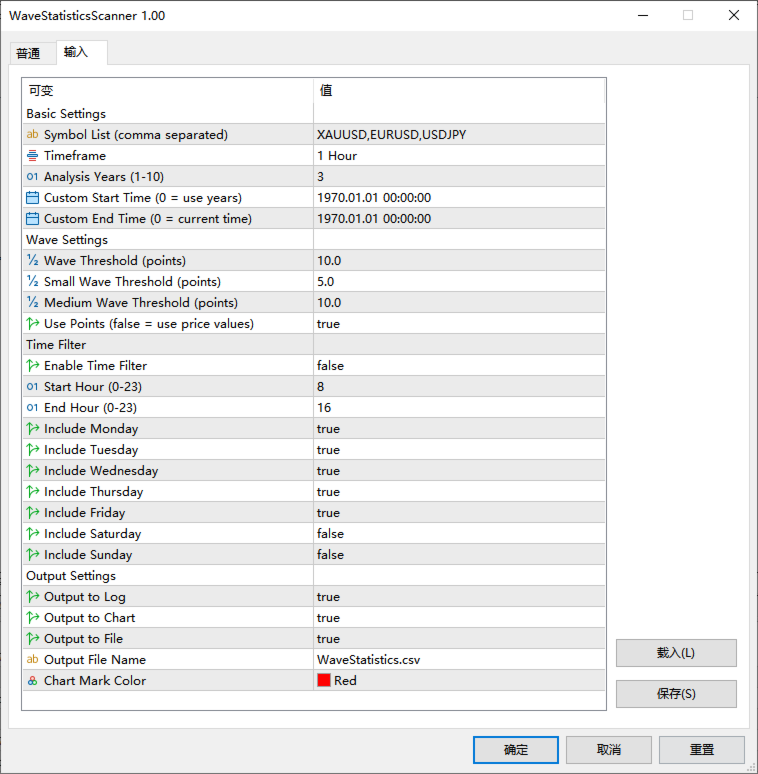
3.Configure the input parameters in the dialog that appears:
-Basic Settings:Define symbols to analyze,timeframe,and time range
-Wave Settings:Set wave thresholds and measurement method(points or price)
-Time Filter:Configure specific time periods for analysis(optional)
-Output Settings:Select desired output methods and visualization options
4.Click"OK"to start the analysis
Interpreting Results
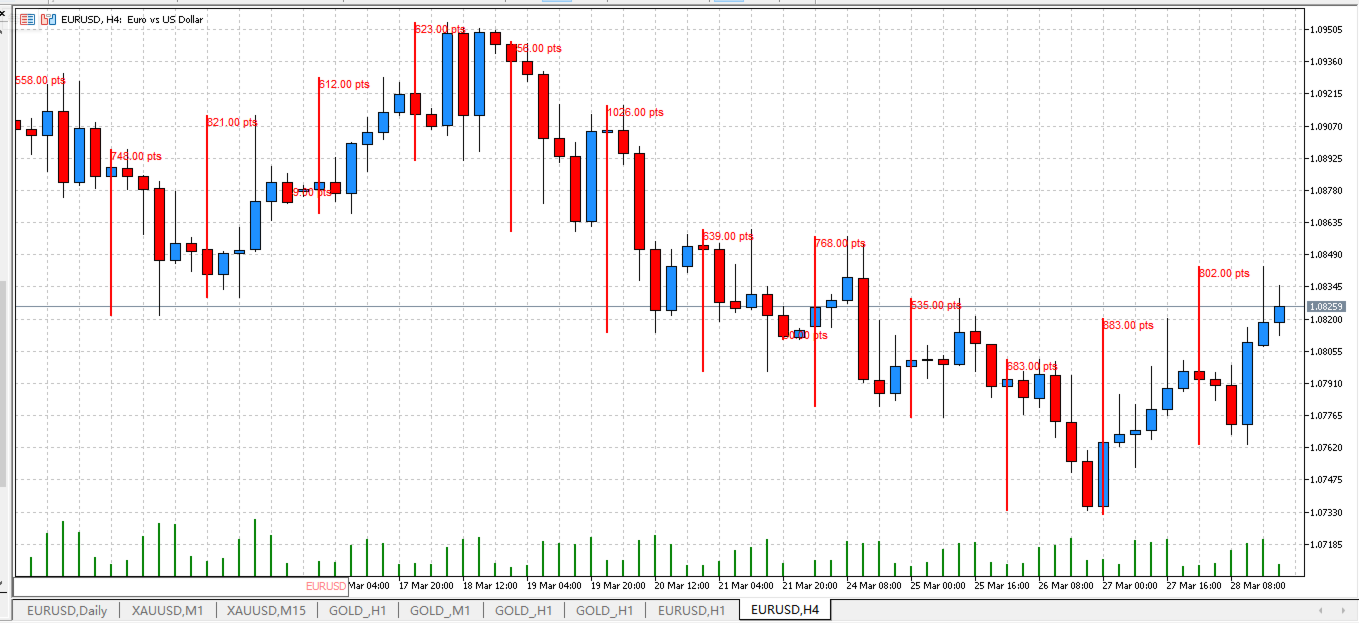
-Chart Visualization:
-Red vertical lines show significant price waves
-Labels display the wave size in points or price value
-Higher concentration of marks indicates areas of increased volatility
-Experts Log:
-Check the"Experts"tab for detailed statistics and information
-Summary statistics show frequency and distribution of waves
-CSV Export:
-Find the CSV file in the MQL5/Files directory
-The file contains detailed data about each identified wave
-Includes time,symbol,wave size,price details,and wave category
Advanced Usage
-Use the wave threshold to focus on only the most significant price movements
-Apply time filters to analyze volatility during specific market sessions
-Compare wave statistics across different instruments for correlation analysis
-Track changes in wave frequency over time to identify shifts in market conditions
-Use the wave categorization to identify regular volatility patterns