Trendscout indicator MT5
- Indicadores
- Chinedu Peter
- Versão: 1.0
- Ativações: 12
Receive notifications for multi-trendline or single trendline breakout. Yes! You heard us right! You will be notified the moment price crosses any and all the timeframe trendlines that you have chosen.
1. ADDING MULTIPLE OR SINGLE TRENDLINES IN THE SAME DIRECTION
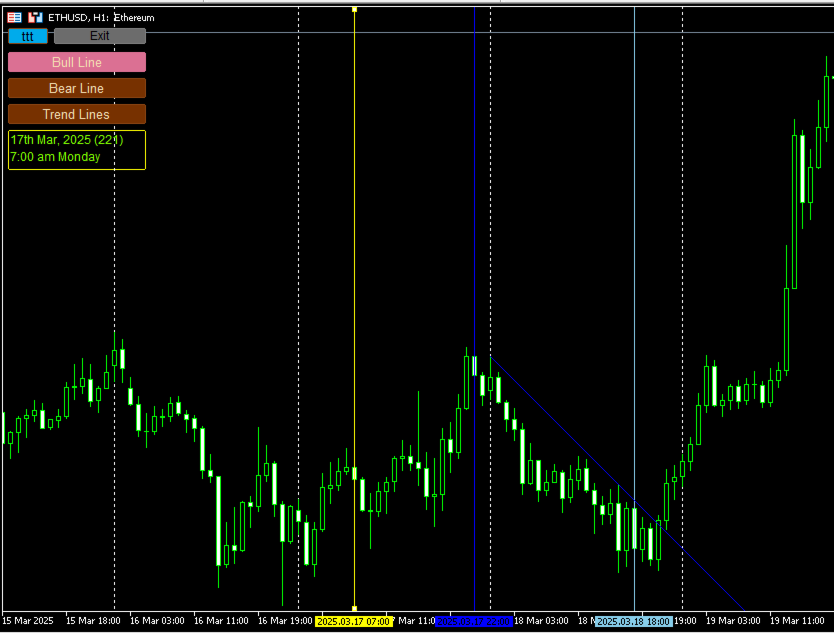
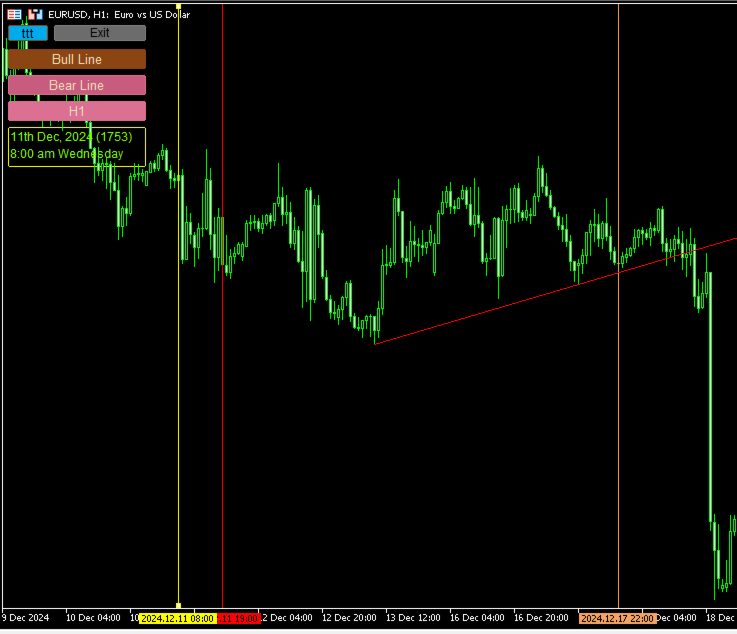
To trigger a stronger trading opportunity you can require that price breaks one or more trend lines of different timeframes in the same direction. To do this navigate to the timeframe for which you want to add a trendline and click the "Bull Line" or "Bear Line" button as the case may be. Next, navigate to the timeframe for which you want to add the second trendline. Click on the "Bull Line" or "Bear Line" button twice. This will place the second trend line based on the current timeframe without deleting the first trendline. You can do this for as many timeframes as needed. A trading opportunity will be triggered only when price breaks all the trendlines in the direction they are placed. A trendline timeframe is identified by the name of the timeframe that appears on the tooltip of each trend line and also on its vertical handles.
2. PUSH AND EMAIL NOTIFICATIONS
Trendscout indicator can send push notification to your mobile phone the moment price crosses all the trendlines you have chosen in any timeframes of your choice, all happening in the current timeframe that you are working on. Be sure to enter your MetaQuote ID at the "Notification" tab of the "Option" settings of the "Tools" menu. Also, check the "Enable Push Notifications" box. Trendscout indicator can also send email notifications to your email address. All you need do is enter your email parameters at Menu\Tools\Options\Email. Also check the "Enable" check box.
3. EXECUTION TIMEFRAME
This is the interval or duration of time in which Trendscout indicator has to wait before searching for a breakout. They are identified by timeframes in the parameter window setting. Hence, the EA does not depend on the timeframe of the chart upon which it is attached. Popular execution frequencies are hourly, every thirty minutes and every fifteen minutes for intraday traders. Larger execution timeframes can be used for longer term traders. This is the only setting available at the parameter window. The default execution timeframe is M15.
4. "EXPERTS" TAB MESSAGES
At the end of each execution frequency, a message containing the number of bull and bear trendlines displayed on the chart and whether they have been crossed by price will be displayed at the "Expert" tab of the trading platform.
A message similar to the following may also be appear once in a while:
"At least one bull trendline must be placed in the future, as positions cannot be opened using trendlines placed solely on price history."
You get such message when trendlines are placed solely on the price history without giving room for the most current price to cross the trendline at a future time. In this case this message is displayed twice in an active session - the moment the trendlines have been placed solely on price history and the next time execution timeframe ends. The message is also sent through push notification and to email
5. PANEL/EXIT BUTTONS
Click the panel button to display the operating buttons. Use the "Exit" button to clear all operating buttons.
6. ATTACHING TRENDSCOUT INDICATOR TO MULTIPLE CHARTS
The indicator can be attached to as many charts as are open on the trading platform. You can use the "ttt" ("---") button to block Trendscout indicator from accessing network on the charts in which you are not ready to place trendlines at the moment. The symbol "ttt" indicates that network is accessible by Trendscout indicator, while "---" indicates that network is not accessible by Trendscout indicator.
7. TREND LINE TYPES
Two types of trend lines are available based on the selected chart type. When using candlesticks or bar charts, the trend line will switch to price high/low mode automatically. When using line charts, the trendline will switch to close mode without additional action required.
8. PLACING TWO OPPOSITE TRENDLINES FOR ONE TIMEFRAME SIMULTANEOUSELY
Use the "Trend Lines" button to place bull and bear trend lines to the current timeframe. This button does not append new trend lines to existing ones.
9. TIMEFRAME HOPPING (REVISITING A TIMEFRAME FOR TRENDLINE READJUSTMENT)
If you have a trendline in one timeframe and switch to another timeframe, you can modify the trendline for the previous timeframe using the trendline handles only when you return to that timeframe. You can also delete and re-add it using the appropriate "Bull Line" or "Bear Line" button. In other words, you CANNOT modify the trend lines whose timeframe you are not currently on.
10. DELETING ALL TRENDLINES
To remove all placed trendlines on the chart simultaneously, click the "Trend Lines" button when the button caption displays a timeframe name.
11. USING THE DATE ANCHOR AND DATE ANCHOR BUTTON
The “Date Anchor” can be useful for the following reasons:
(i) View the date, time and bar position on the “Date anchor button” as well as on the tooltip of the "Date anchor line".
(ii) The date anchor time is in the trading server's time zone and also of type am/pm as against the server’s traditional 24 hour type. This is an added advantage.
(iii) The date anchor of all charts are at synch with one another.
(iv) The date anchor allows you to compare and analyze data across multiple charts from a reference date/time.
N.B.: Trendscout indicator works on live and demo accounts, but not on strategy tester.