CISD High and Low ICT Indicator in MT5
- Indicadores
- Eda Kaya
- Versão: 1.11
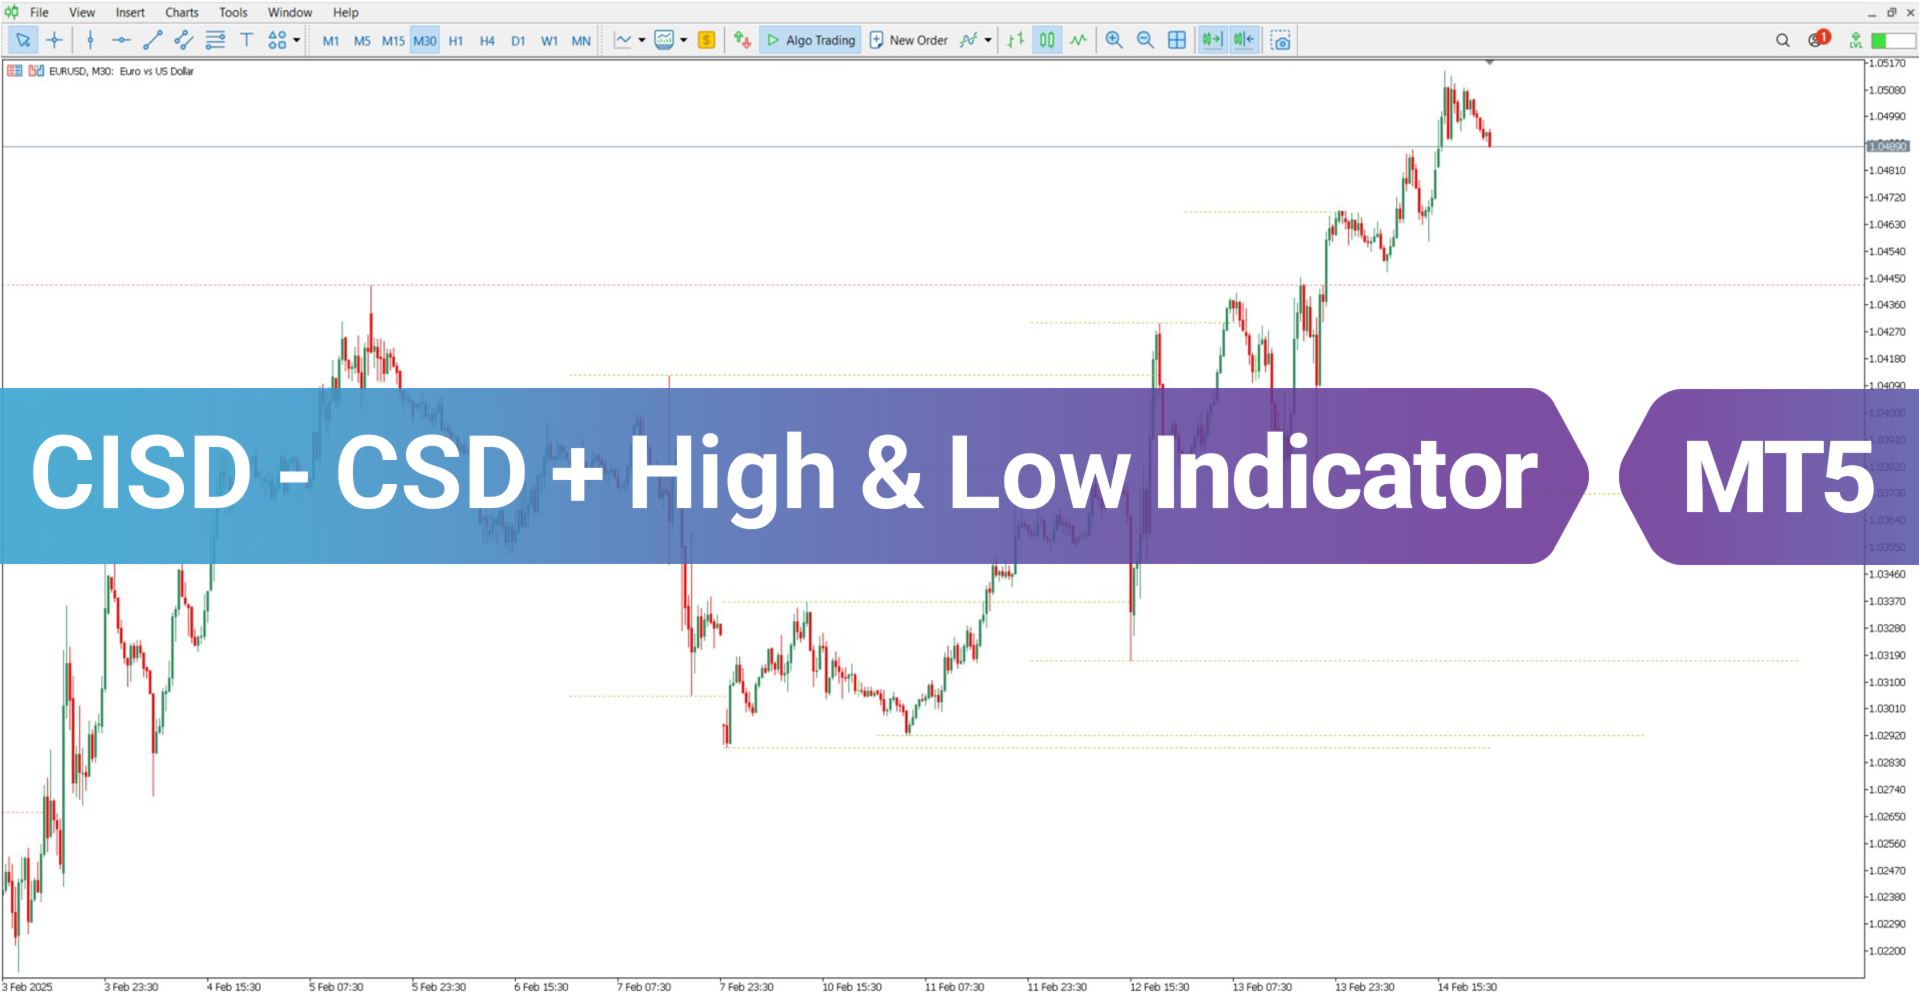
CISD - CSD + High & Low ICT Indicator in MetaTrader 5
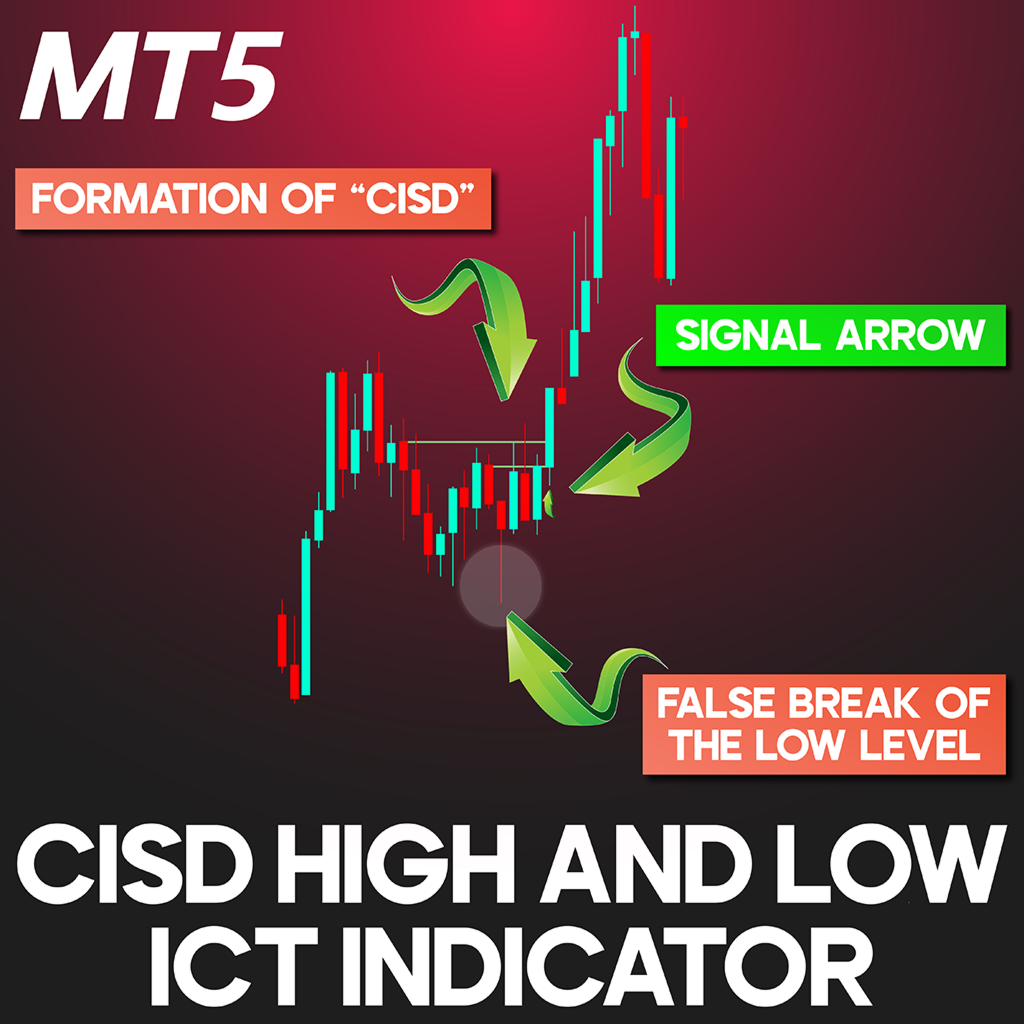
The CISD – CSD + High and Low Indicator is a powerful tool that plots key High and Low-price levels while highlighting CISD formations on the chart. Designed based on the ICT trading strategy, this MT5 indicator helps identify false breakouts at major price levels and marks CISD occurrences with arrows to signal trade opportunities.
CISD + High/Low Indicator Features
Below is a breakdown of the CISD - CSD + High and Low Indicator specifications:
| Category | ICT - Smart Money - Signal & Forecasting |
| Platform | MetaTrader 5 |
| Skill Level | Advanced |
| Indicator Type | Reversal - Continuation |
| Timeframe | Multi-timeframe |
| Trading Style | Day Trading |
| Market | All Markets |
Overview of the CISD – CSD Indicator
This MT5 indicator effectively plots CISD signals alongside key High/Low levels across daily, weekly, and monthly charts. When a CISD formation occurs, an arrow appears, giving traders a precise entry signal.
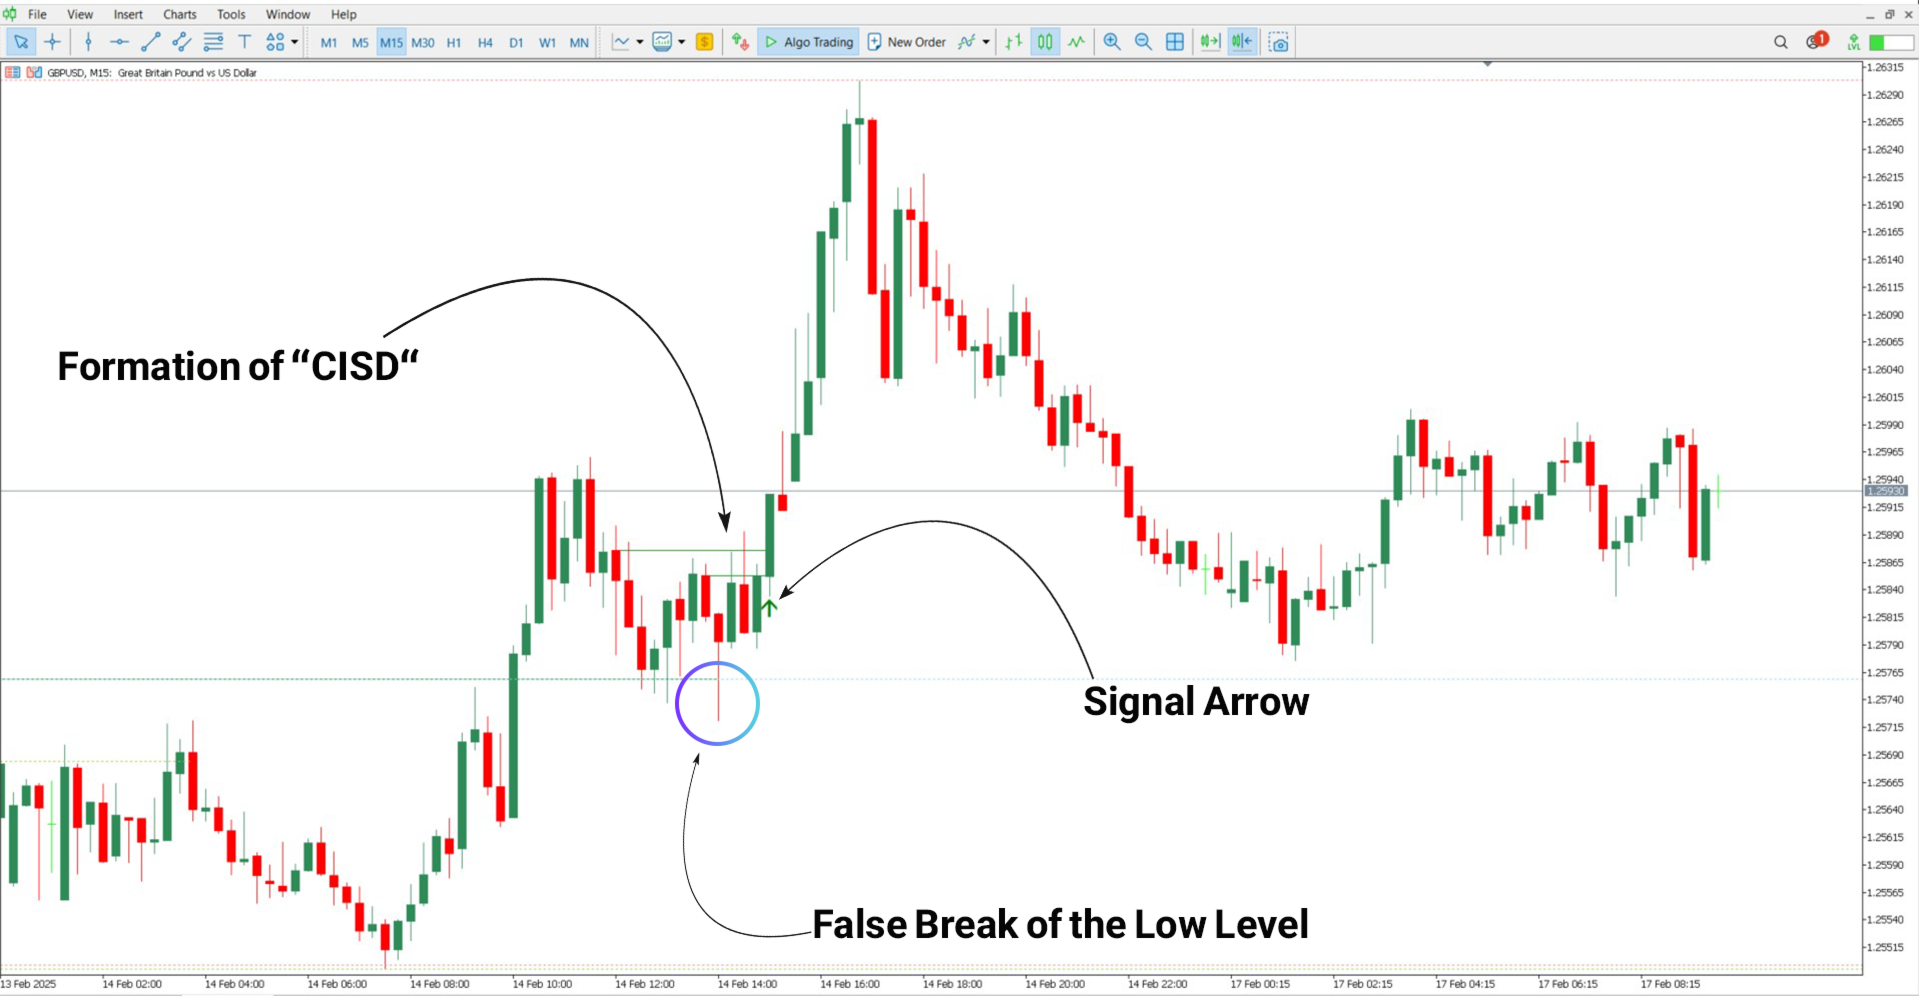
Buy Trade Setup Example
On a 15-minute GBP/USD chart, the price first experiences a false breakout below a swing Low before reversing and forming a CISD. The indicator then places a green arrow, confirming an optimal entry point for a long trade.
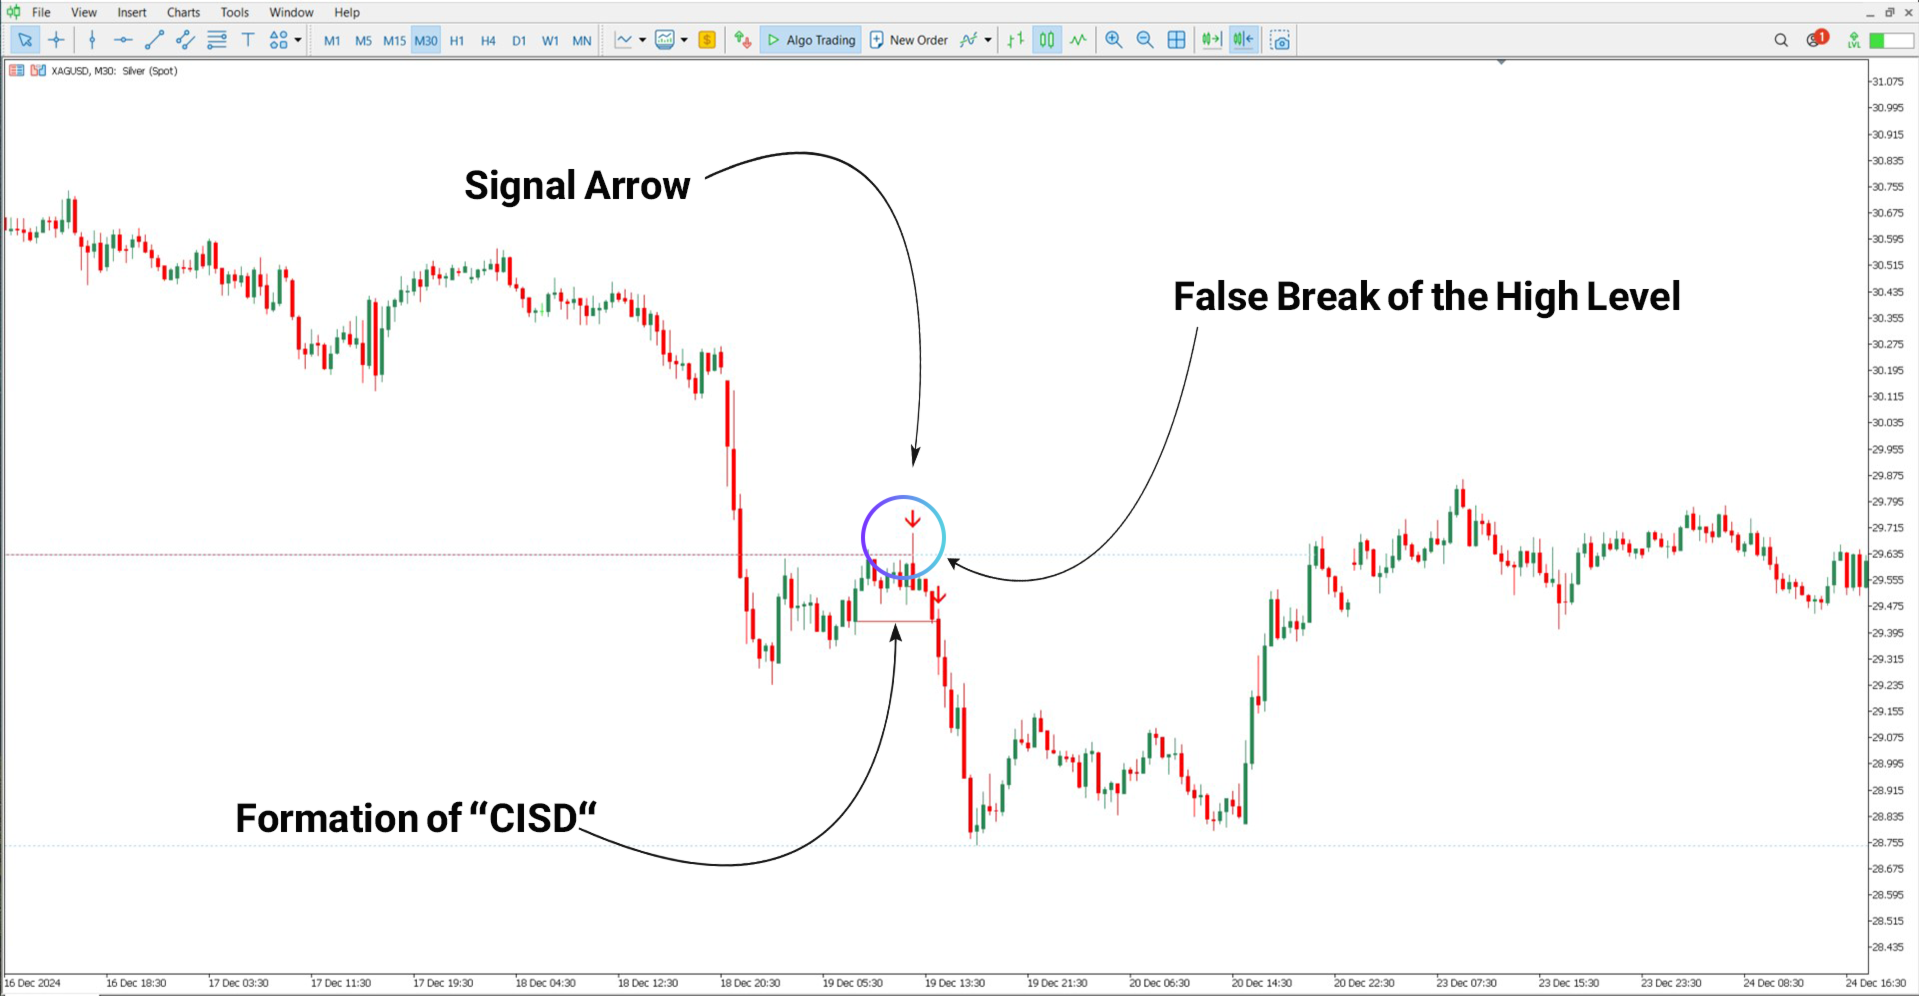
Sell Trade Setup Example
In a 30-minute XAG/USD (Silver/USD) chart, a false break takes place during a bullish pullback, resulting in a CISD formation. The indicator generates a red arrow, indicating a sell entry opportunity.
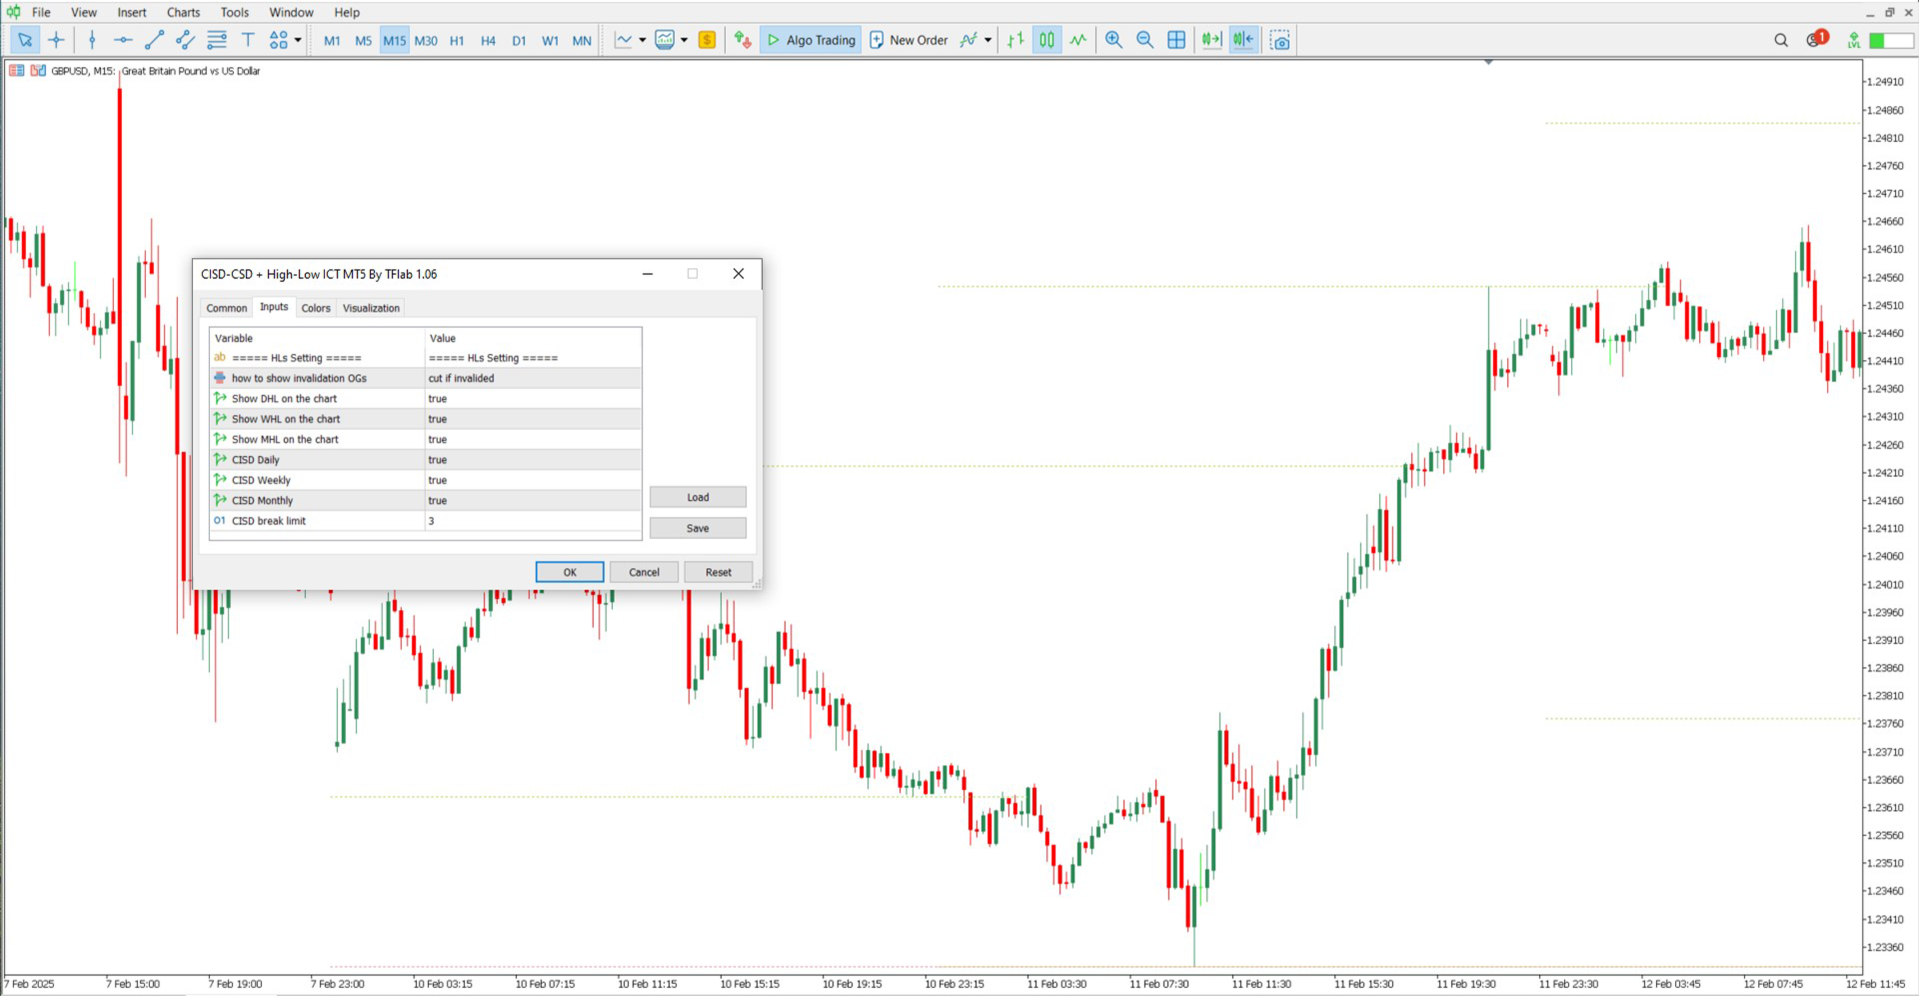
CISD + High and Low Indicator Settings
The CISD - CSD + High and Low Indicator comes with the following adjustable settings:
- Display invalidation OGs – Enables visibility of invalid zones.
- Show DHL on chart – Plots the daily high and low levels.
- Show WHL on chart – Displays the weekly high and low levels.
- Show MHL on chart – Shows the monthly high and low levels.
- CISD Daily – Activates CISD signals for daily timeframes.
- CISD Weekly – Enables CISD signals for weekly timeframes.
- CISD Monthly – Plots CISD signals for monthly charts.
- CISD Break Limit – Defines the threshold for CISD breakout validation.
Conclusion
The CISD - CSD + High and Low Indicator is a valuable tool for analyzing market structure by marking CISD formations and plotting key High/Low levels across multiple timeframes. Based on Supply and Demand principles, this MT5 indicator is well-suited for traders using ICT strategies and liquidity-based analysis.