Daily Max Min Channel
- Indicadores
- Cristian Mateo Duque Ocampo
- Versão: 1.70
General Description of the Indicator
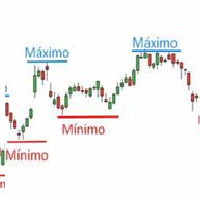
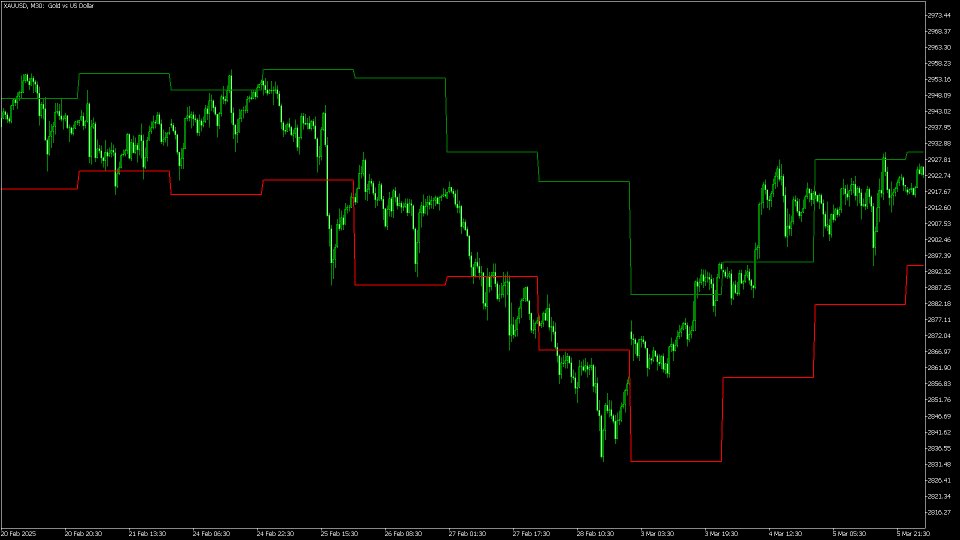
This indicator is a visual tool that plots the high, low, and mid levels of each day on the chart. These levels are calculated based on the daily timeframe (D1) but can be displayed on any other timeframe (M1, M5, H1, etc.). Additionally, the indicator allows:
-
Horizontal shifting of the high and low levels based on a user-specified number of days (parameter Shift ).
-
Limiting the display to a specific number of days (parameter VisibleDays ).
-
Customizing the colors and thickness of the plotted lines.
This indicator is useful for identifying key daily support and resistance levels, as well as observing market volatility based on daily ranges.
Usage Summary
Day Shifting:
-
Use the Shift parameter to move the high and low levels to the left or right.
-
For example, Shift = -1 displays the previous day's levels in the current day's position.
Visual Customization:
-
Use the MiddleLineColor , UpperLineColor , LowerLineColor , and LineWidth parameters to customize the appearance of the lines.
Visible Days Limitation:
-
Use the VisibleDays parameter to display only the last N days on the chart.
Minimum Data Requirements:
-
Ensure the chart has at least MinBarsForCalculation bars for the indicator to work correctly.
Example Configuration
-
Shift: -1 (shows the previous day's levels in the current day's position).
-
MiddleLineColor: clrPurple (midline in purple).
-
UpperLineColor: clrBlue (high line in blue).
-
LowerLineColor: clrDarkOrange (low line in dark orange).
-
LineWidth: 2 (line thickness).
-
MinBarsForCalculation: 100 (the indicator requires at least 100 bars to function).
-
VisibleDays: 0 (displays all available days).









good indicator