SMT Divergence Indices ICT MT4
- Indicadores
- Eda Kaya
- Versão: 1.11
Smart Money Divergence ICT Indices MT4
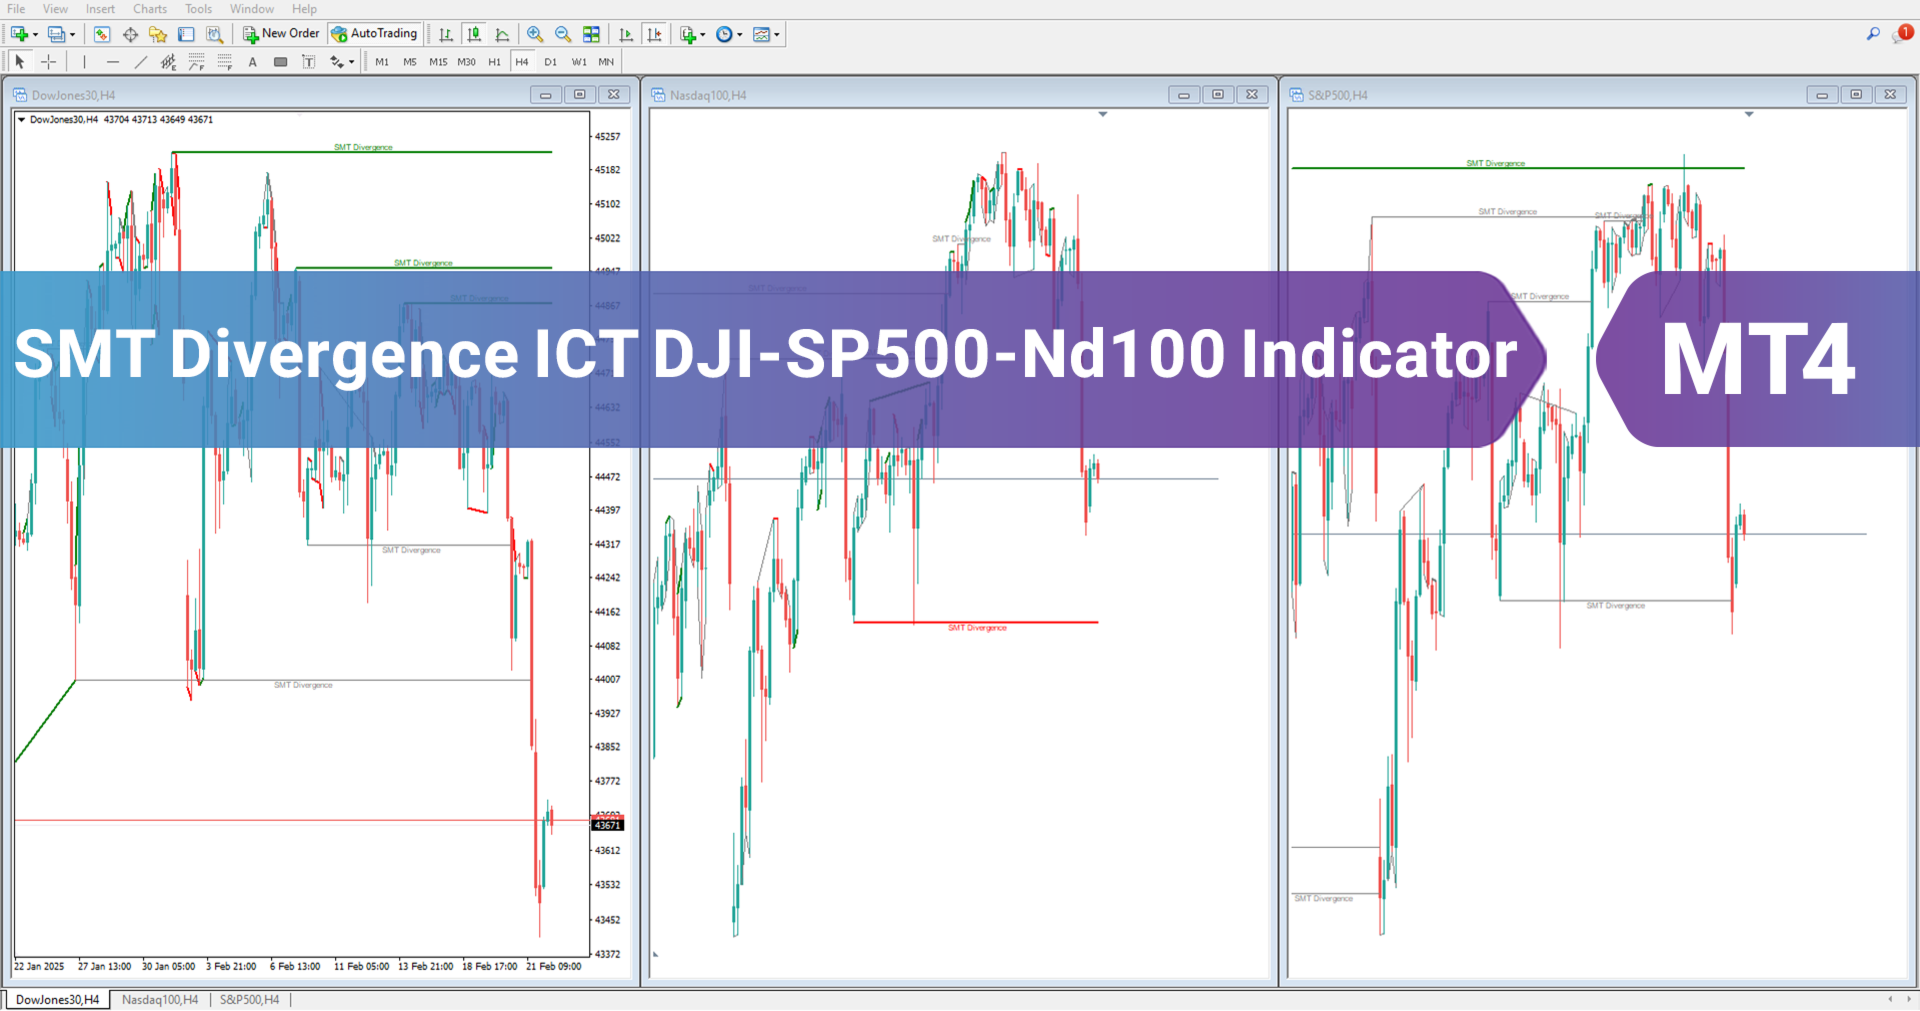
The SMT Divergence Indices ICT indicator is a specialized tool available for MetaTrader 4, designed to assist ICT traders in recognizing Smart Money Divergences across three major indices: Dow Jones (DJI), Nasdaq (NASDAQ), and S&P 500. By using this indicator, traders can identify crucial SMT Divergence points, offering insights into potential price movements.
Additionally, the indicator detects trendline divergences, as well as high and low price variations, allowing for more precise technical analysis. This feature makes it a valuable tool for traders employing ICT methodologies in their strategies.
«Indicator Installation & User Guide»
MT4 Indicator Installation | SMT Divergence Indices ICT MT5 | ALL Products By TradingFinderLab | Best MT4 Indicator: Refined Order Block Indicator for MT4 | Best MT4 Utility: Trade Assistant Expert TF MT4 | TP & SL Tool: Risk Reward Ratio Calculator RRR MT4 | Money Management: Easy Trade Manager MT4
Smart Money Divergence Indicator Table
The table below provides an overview of the key specifications of the SMT Divergence Indices ICT indicator:
| Category | ICT - Smart Money - Trading Tool |
| Platform | MetaTrader 4 |
| Skill Level | Advanced |
| Indicator Type | Reversal - Breakout - Entry |
| Timeframe | Multi-Timeframe |
| Trading Style | Scalping - Day Trading - Intra-day Trading |
| Markets | Forex - Stocks - Indices |
Indicator Overview
The Smart Money Divergence Indicator is specifically designed for ICT traders looking to analyze Smart Money divergences on financial charts. While primarily optimized for Dow Jones, Nasdaq, and S&P 500, it can be applied to other assets as well.
By detecting these divergence signals, traders can refine their entry and exit strategies, making better-informed trading decisions.
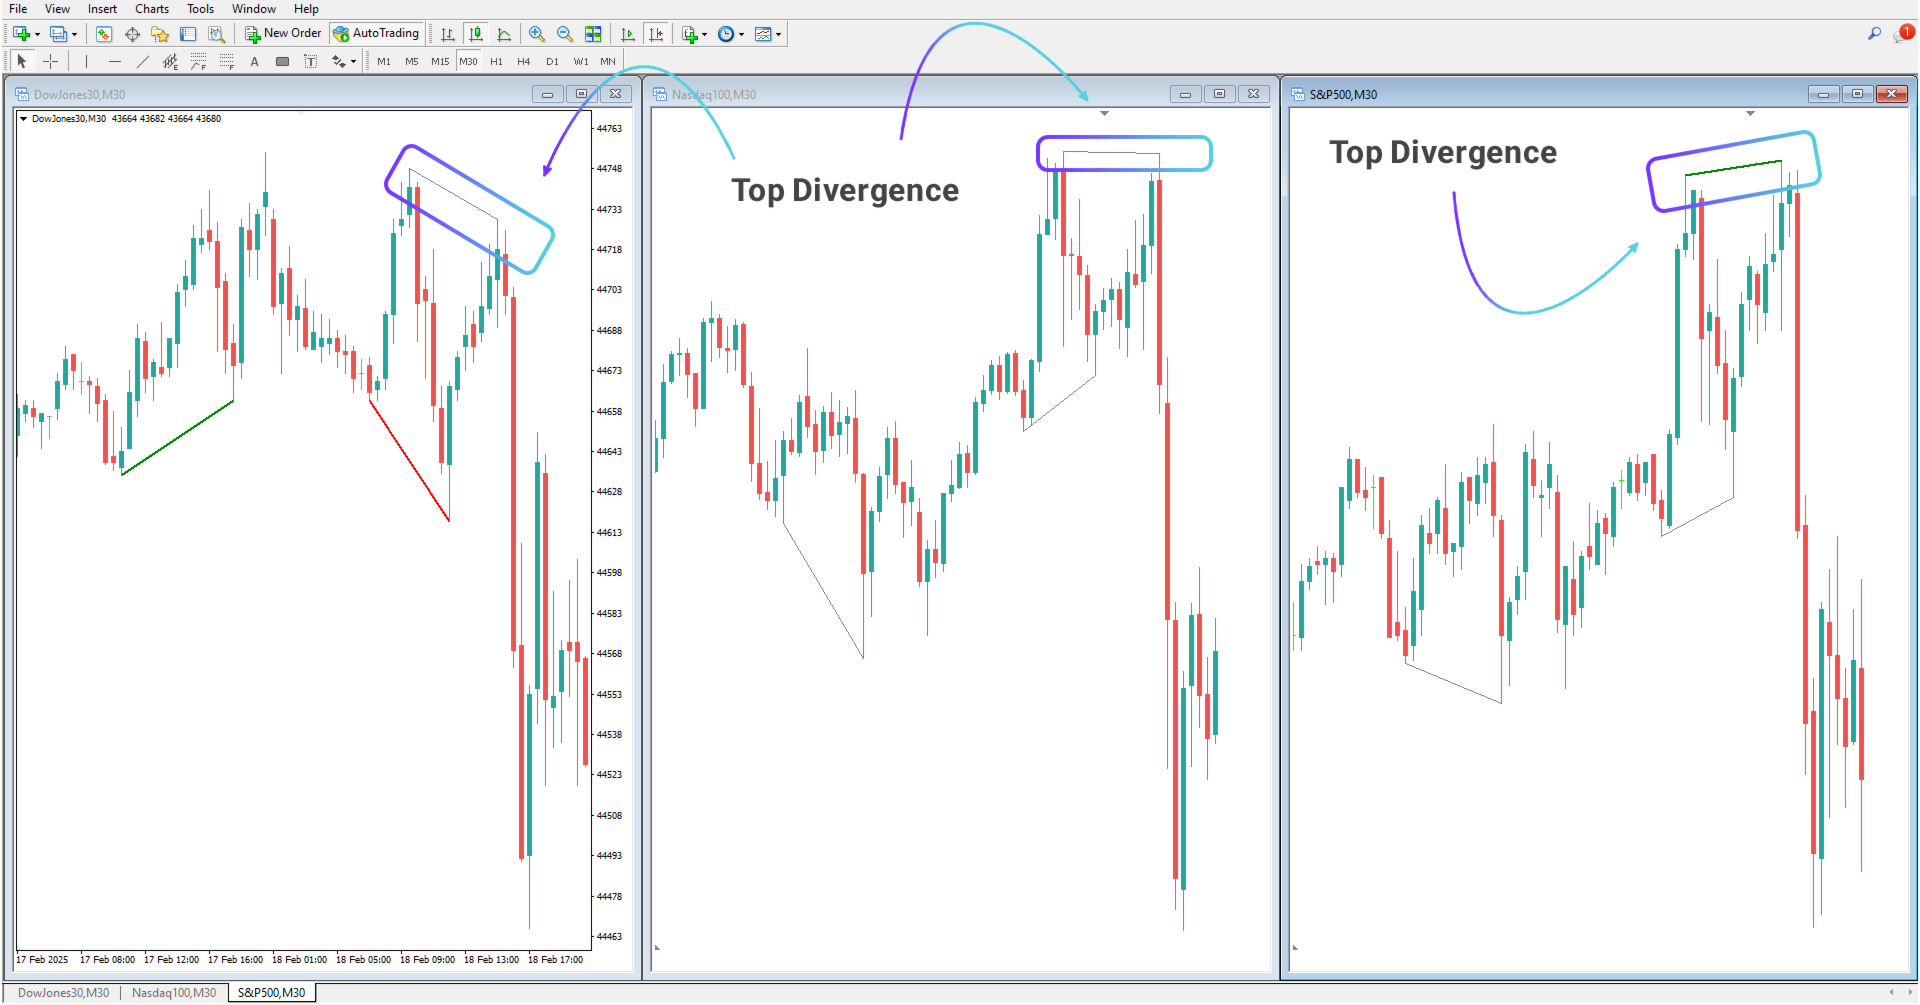
Bullish Smart Money Divergence
On the 4-hour charts of Dow Jones, Nasdaq, and S&P 500, the SMT Divergence Indices ICT indicator identifies liquidity levels. In this case:
- Dow Jones and S&P 500 prices reached and absorbed the liquidity zone.
- However, Nasdaq failed to reach this level, which may indicate a shift in market structure.
ICT traders can use this data to gauge liquidity conditions and adjust their trading strategies accordingly.
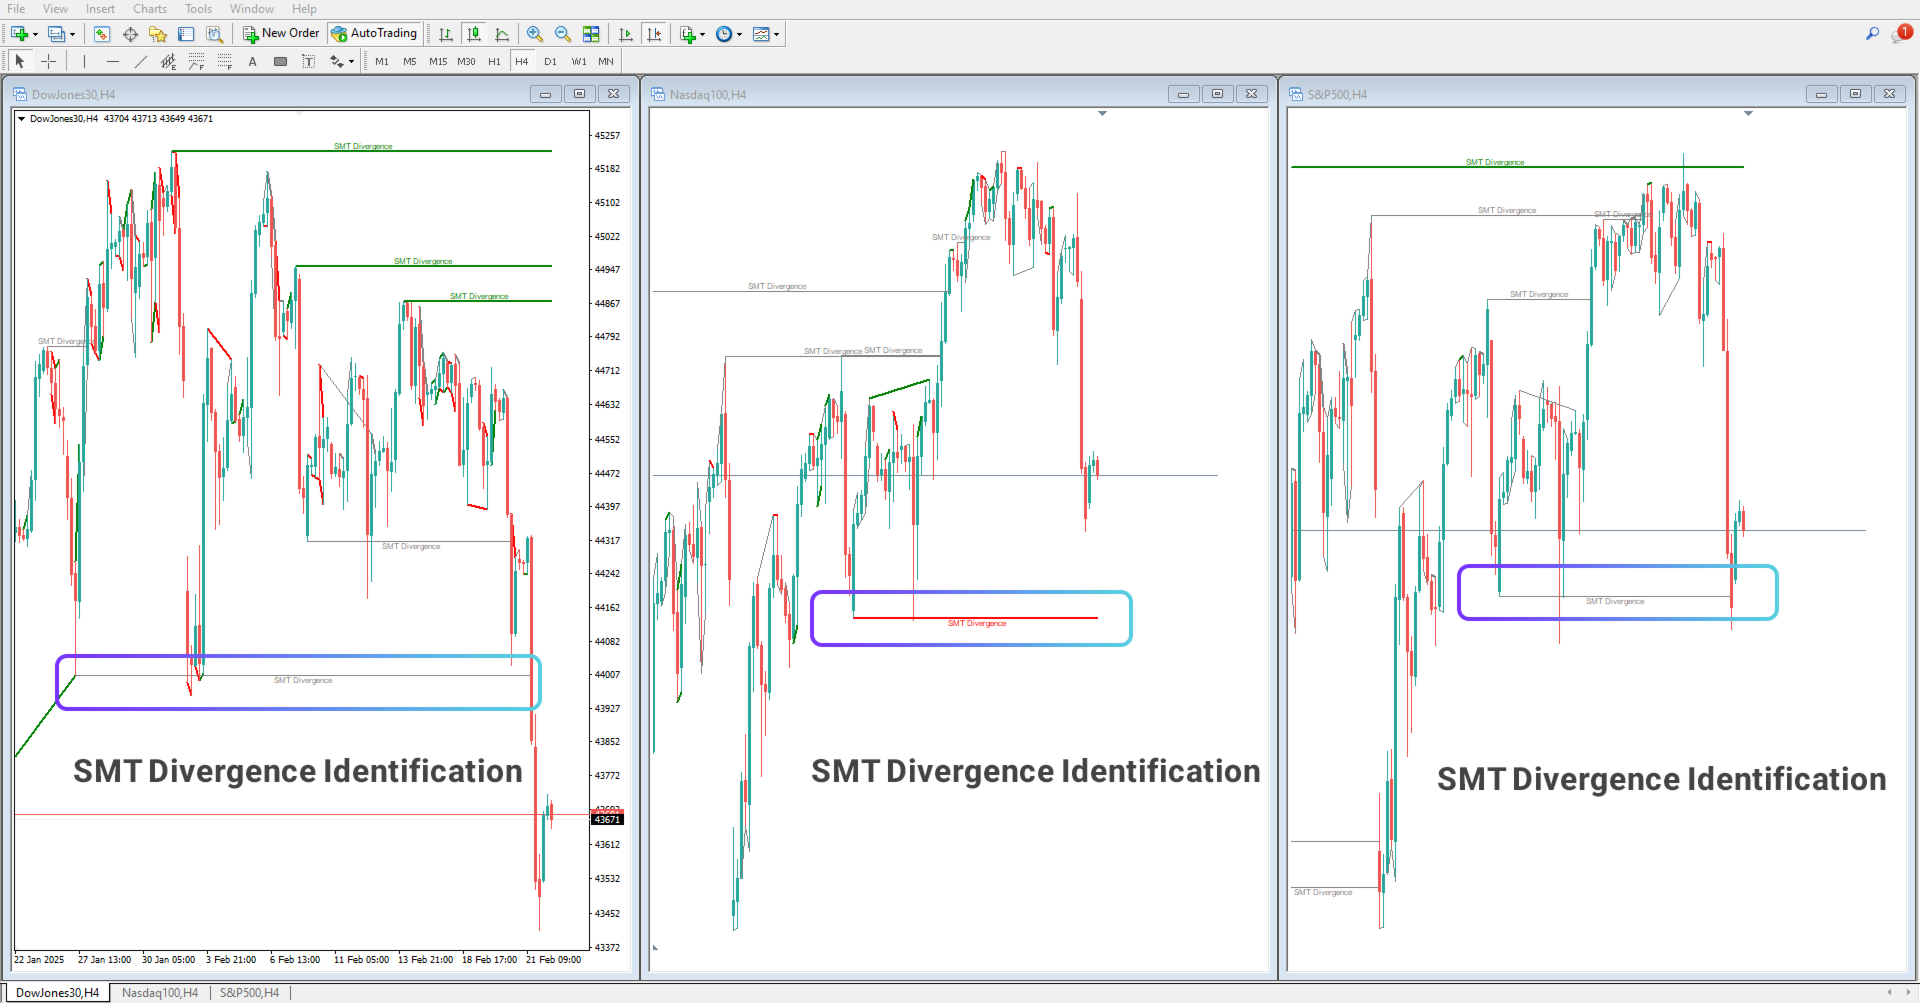
Bearish Trendline Divergence
In the charts of Dow Jones, Nasdaq, and S&P 500, the Smart Money Divergence Indicator (SMT Divergence Indices ICT) detects a trendline divergence:
- In Nasdaq and Dow Jones, prices failed to form a higher high, instead making a lower high than the previous peak.
- Meanwhile, S&P 500 formed a higher high, signaling a Trendline Divergence.
Such divergence can indicate a potential market trend reversal. In the observed charts, following the divergence, a downward move was initiated, confirming a shift in momentum.
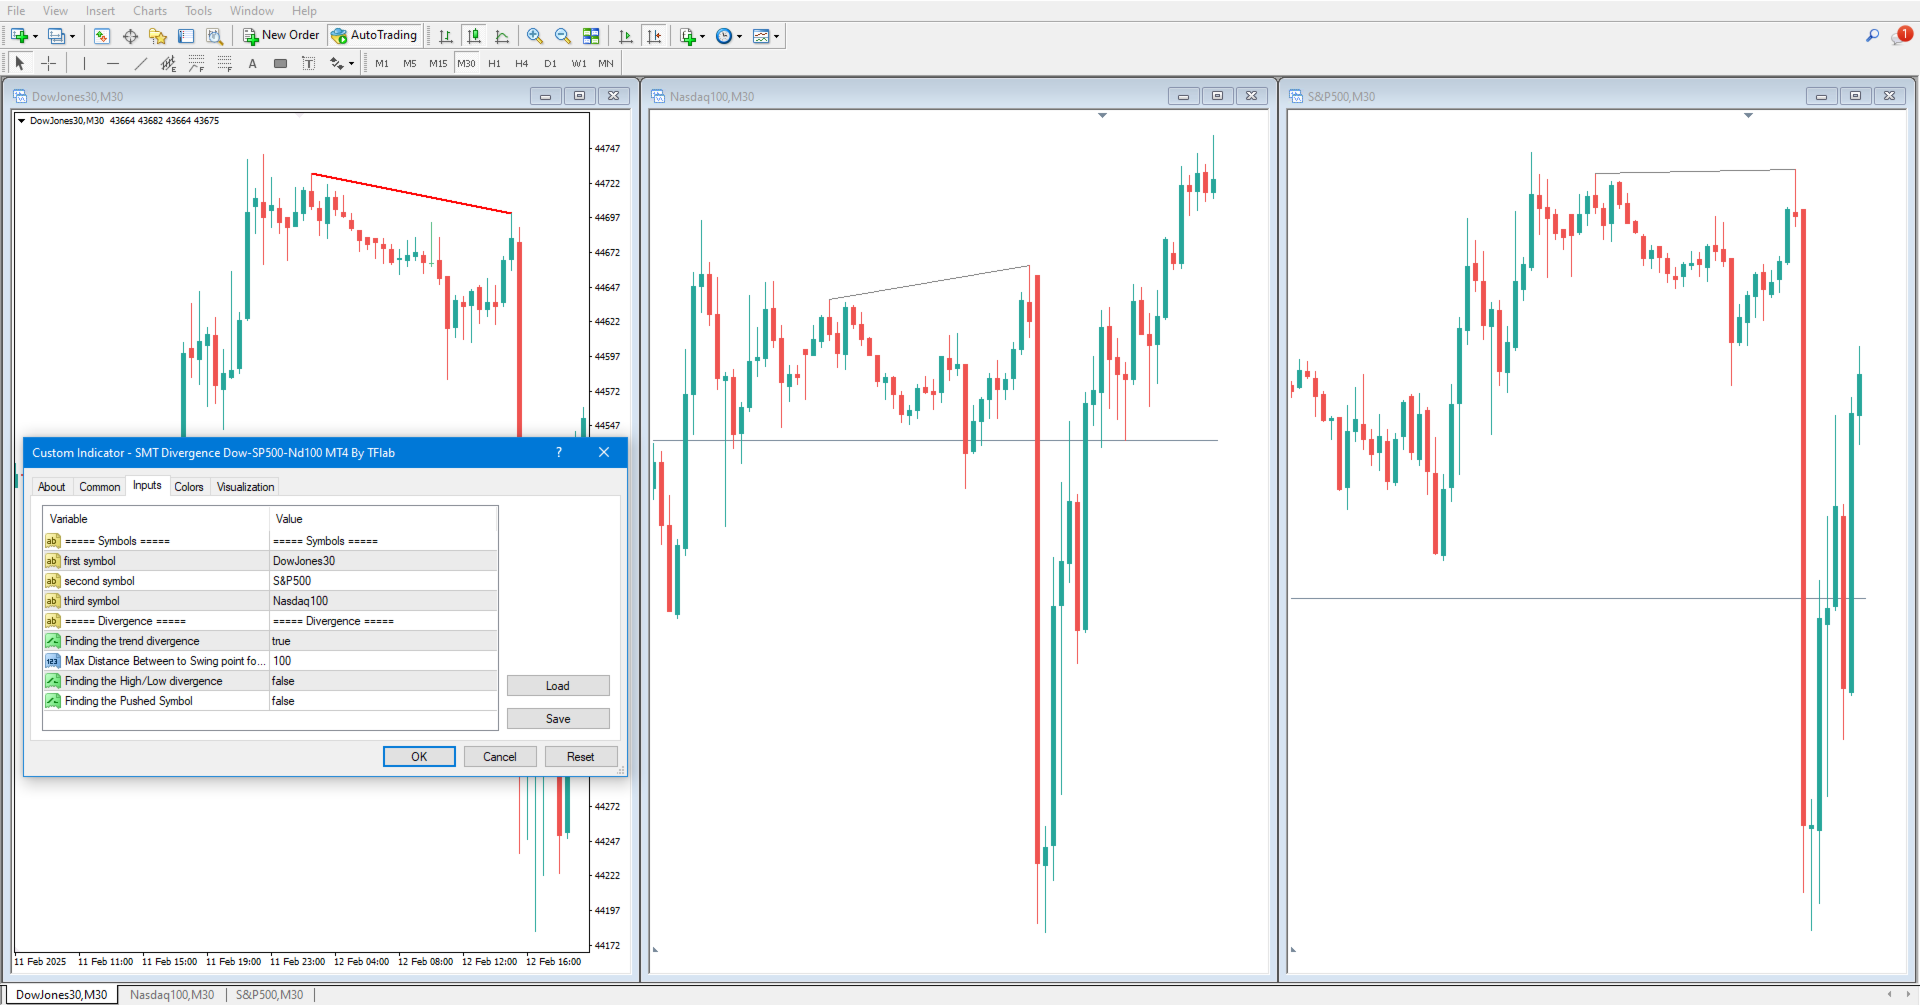
Smart Money Divergence Indicator Settings
Below are the adjustable parameters for the SMT Divergence Indices ICT indicator:
Symbols
- First Symbol: Select the first asset.
- Second Symbol: Select the second asset.
- Third Symbol: Select the third asset.
Divergence Detection
- Identify Trendline Divergence: Enable/Disable trendline divergence.
- Max Distance Between Swing Points: Set the maximum distance for divergence analysis.
- Identify High/Low Divergence: Enable/Disable high/low divergence.
- Detect Pushed Symbol: Enable/Disable SMT detection.
Conclusion
The SMT Divergence Indices ICT indicator is a powerful MetaTrader 4 tool tailored for ICT traders who seek to analyze Smart Money divergence across financial markets. It provides three critical types of divergence:
- Trendline Divergence
- High & Low Divergence
- Smart Money Divergence
By utilizing this indicator, traders can identify significant divergence levels in Dow Jones, Nasdaq, and S&P 500, gaining valuable insights into potential market reversals and trend shifts to enhance their trading strategies.