XAMD or AMDX Indicator ICT MT4
- Indicadores
- Eda Kaya
- Versão: 1.11
XAMD/AMDX Indicator ICT MT4
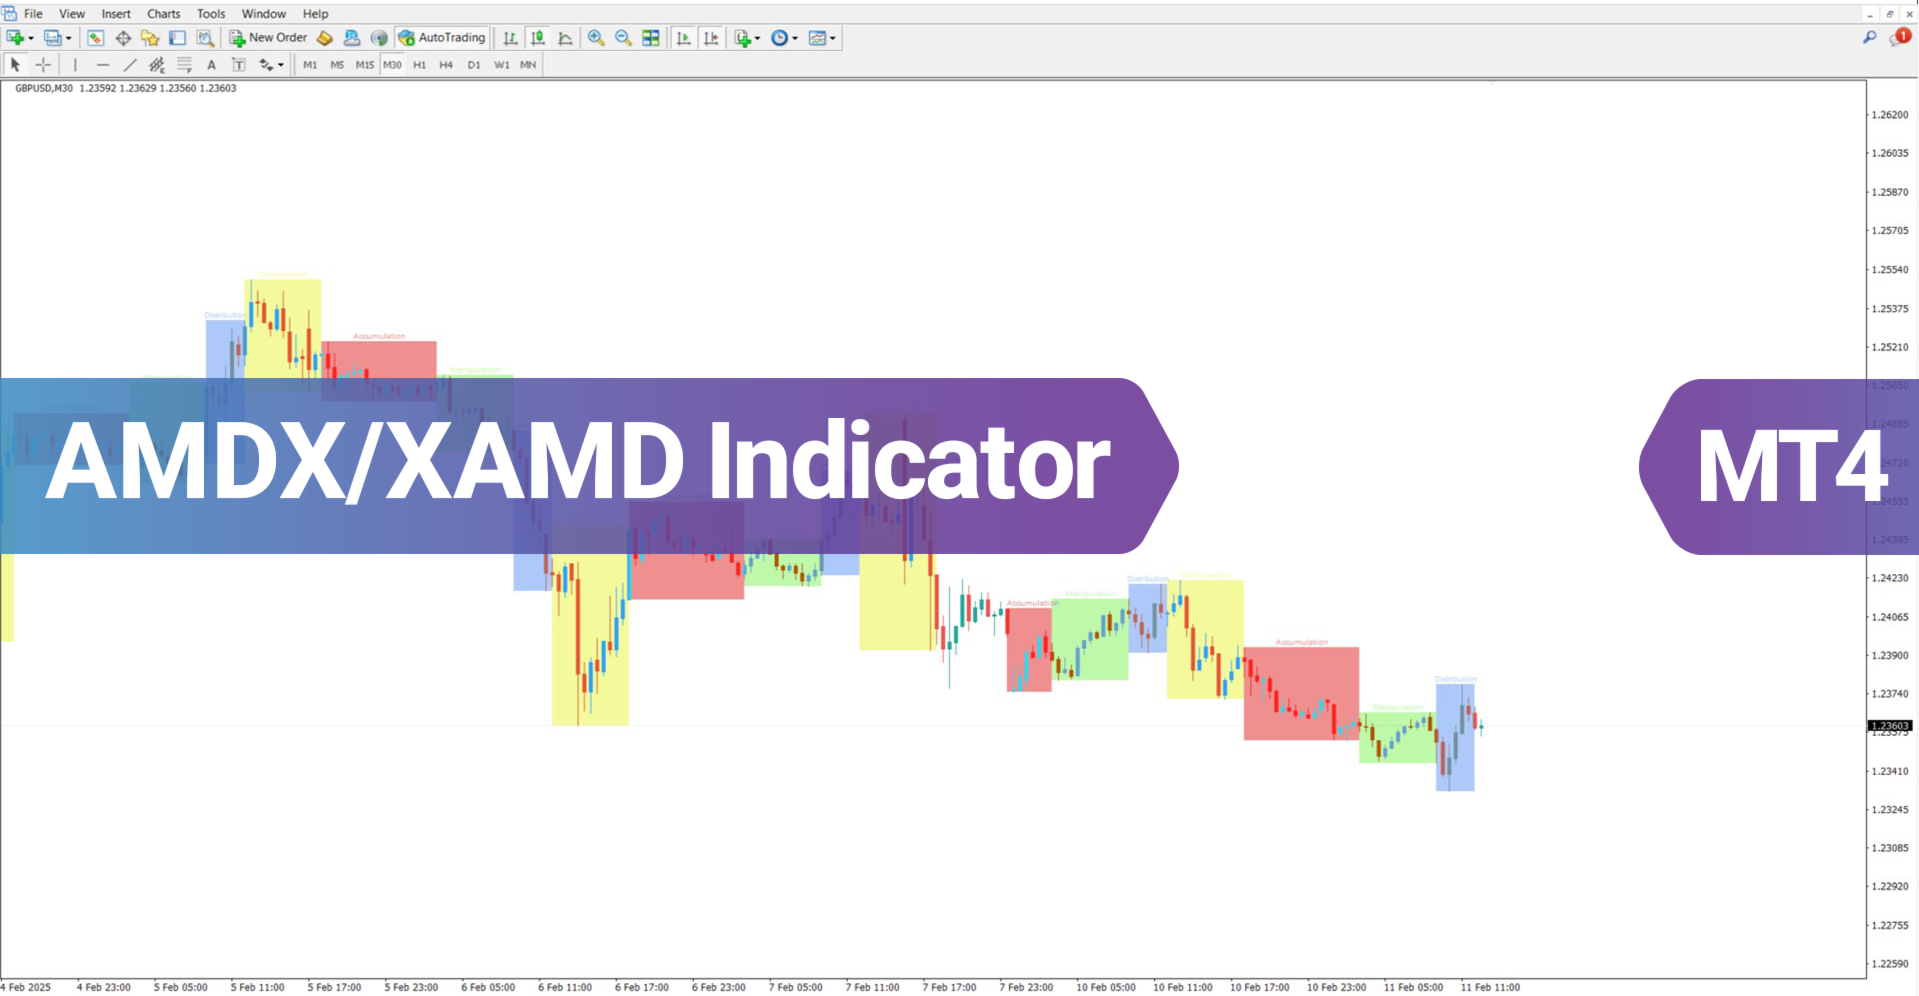
The XAMD/AMDX ICT indicator is a specialized tool for MetaTrader 4, designed to highlight possible market trend shifts. It segments price movement into three distinct phases—Accumulation (red), Distribution (blue), and Manipulation (green)—using a color-coded box system. Unlike the traditional AMD ICT indicator, this version introduces an additional "X" phase, which serves as a marker for either trend continuation or reversal.
XAMD/AMDX Indicator Specifications
Below are the essential specifications of the XAMD/AMDX indicator:
| Category | ICT - Smart Money - Liquidity |
| Platform | MetaTrader 4 |
| Skill Level | Advanced |
| Indicator Type | Continuation - Reversal |
| Timeframe | Multi-Timeframe |
| Trading Style | Scalping - Intraday Trading |
| Market | Crypto - Forex - Stocks - Commodities |
Indicator Overview
A yellow box is used to indicate the continuation or reversal (X) phase. The placement of this phase varies based on user-defined settings, appearing either at the beginning or end of a market cycle. This "X" zone acts as a key reference point for potential trend continuation or reversal, depending on price action and market momentum.
Bullish Trend Conditions
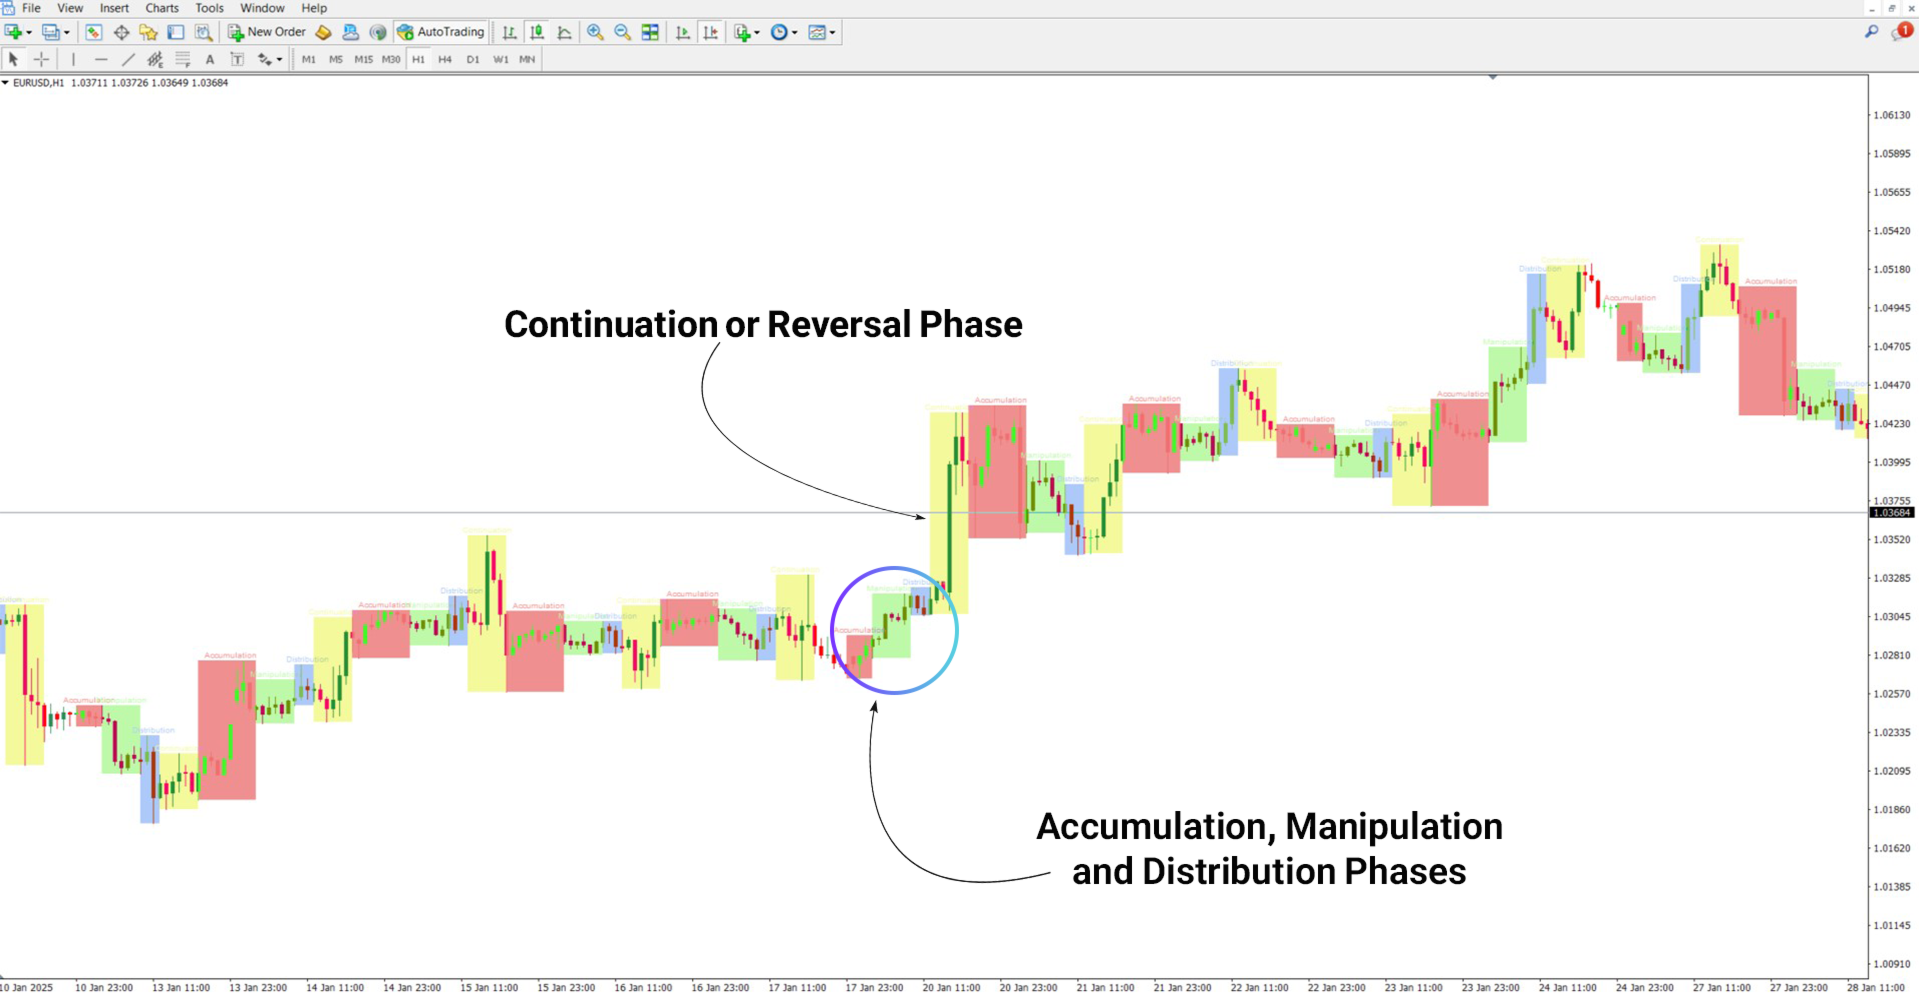
In the EUR/USD 1-hour chart, bullish price movement becomes evident as the price transitions through accumulation, manipulation, and distribution phases. Buying pressure escalates when the price interacts with the yellow "X" phase, signaling a strong upward push. The observed cycle follows the "AMDX" pattern in this case, where the continuation phase (X) appears first.
Bearish Trend Conditions
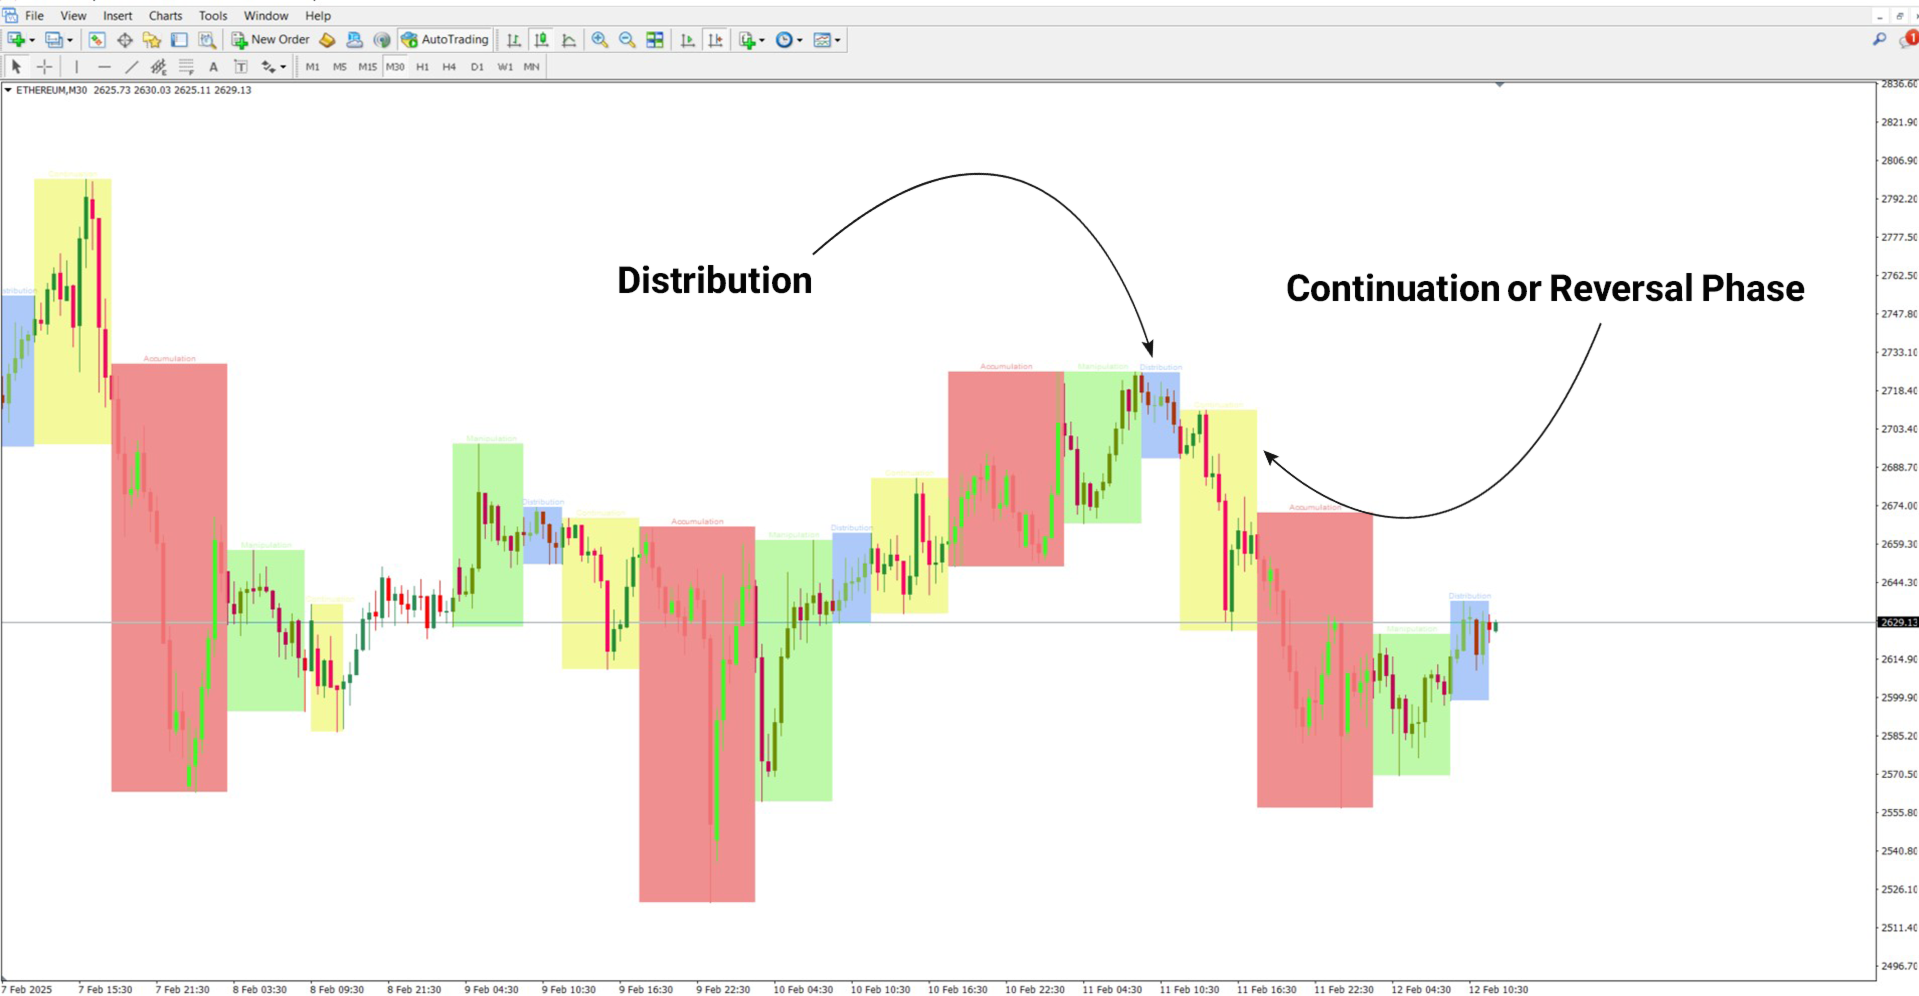
On the 30-minute Ethereum (ETH) chart, price action initially consolidates within the accumulation phase (red box), then experiences a temporary upward move in the manipulation phase. The market shifts downward during the distribution phase (blue box). The continuation or reversal (X) phase confirms the bearish trend, marking a strategic entry point for sell positions.
Alt: XAMD/AMDX Indicator in Bearish Trend
Caption: Bearish Trend Analysis Using XAMD/AMDX Indicator
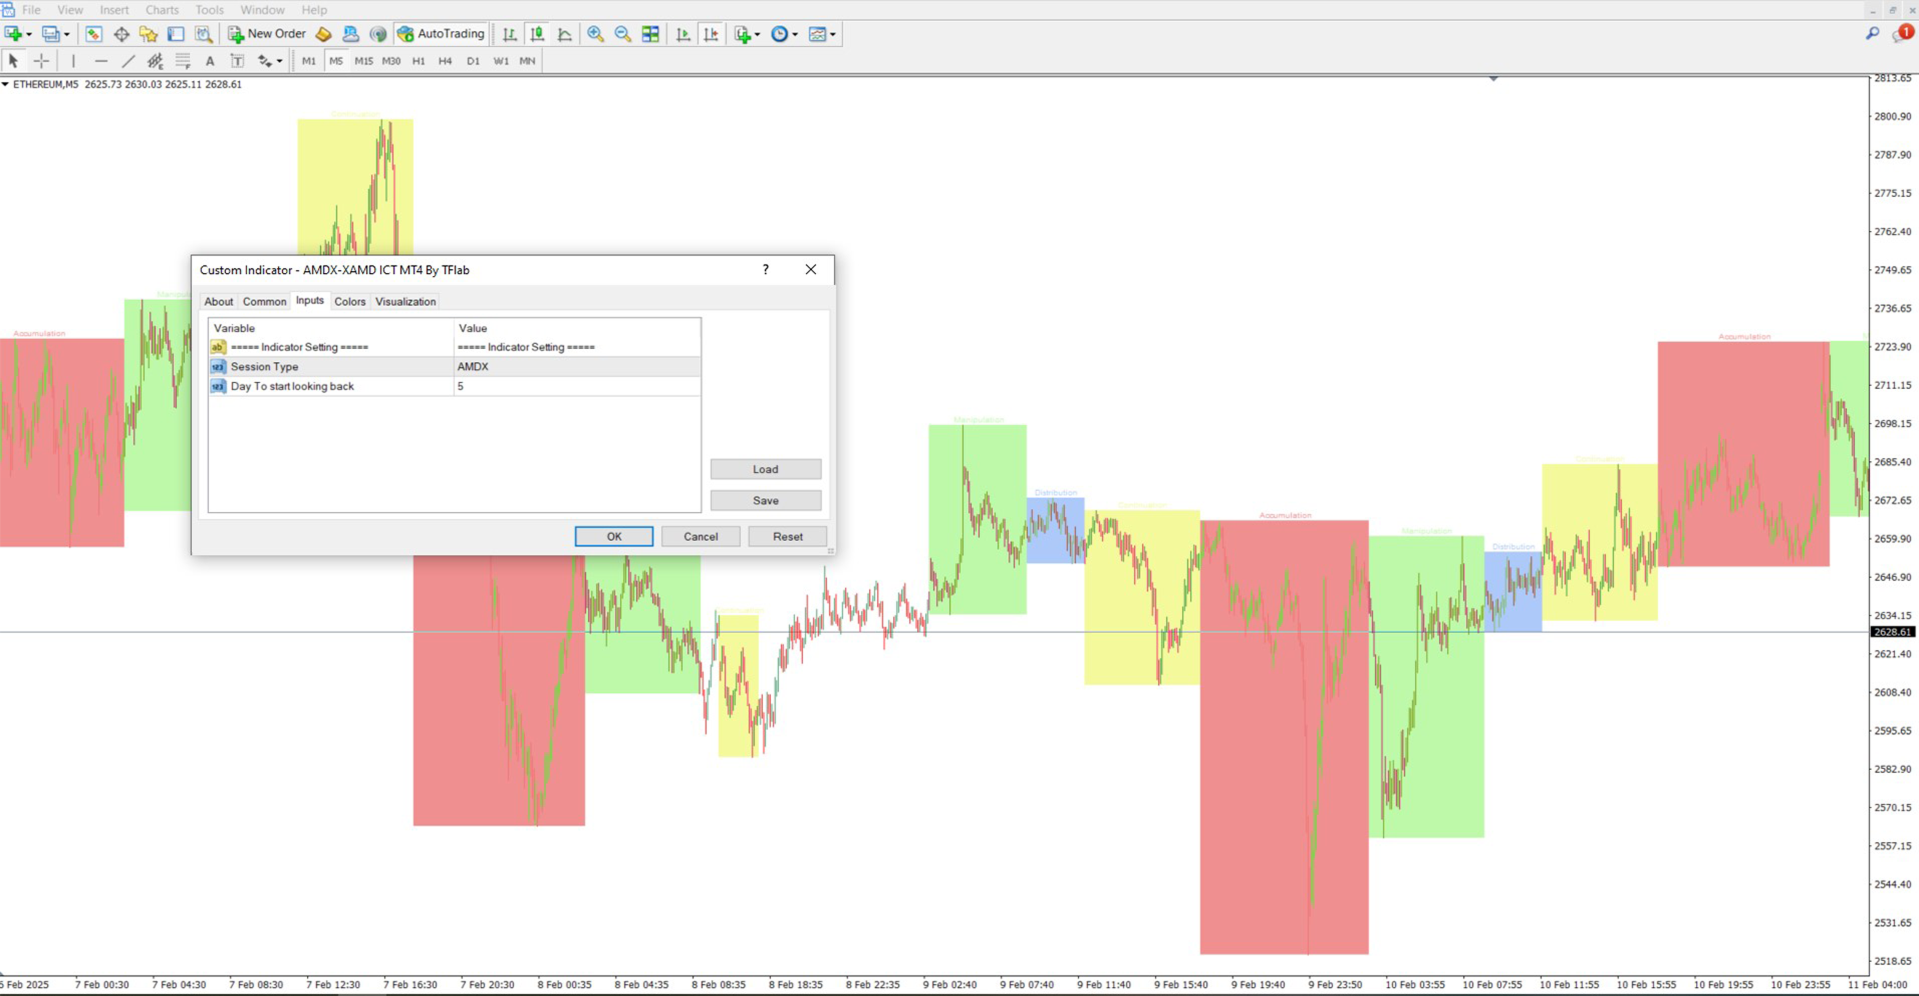
XAMD/AMDX Indicator Settings
Key parameters available for user customization in the XAMD/AMDX indicator:
- Session Type: Select between "AMDX" and "XAMD"
- Lookback Days: Define the period for market trend evaluation
Conclusion
The XAMD/AMDX cycle indicator for MetaTrader 4 is a powerful tool for identifying liquidity-driven market trends. It categorizes price movements into three primary phases—Accumulation (red), Distribution (blue), and Manipulation (green)—while incorporating a distinct continuation/reversal (X) phase, marked in yellow. This additional phase helps traders assess whether a trend is likely to persist or shift direction, making it an essential tool for traders following Smart Money strategies.