Epsilon Trend
- Indicadores
- Pieter Gerhardus Van Zyl
- Versão: 1.0
- Ativações: 10
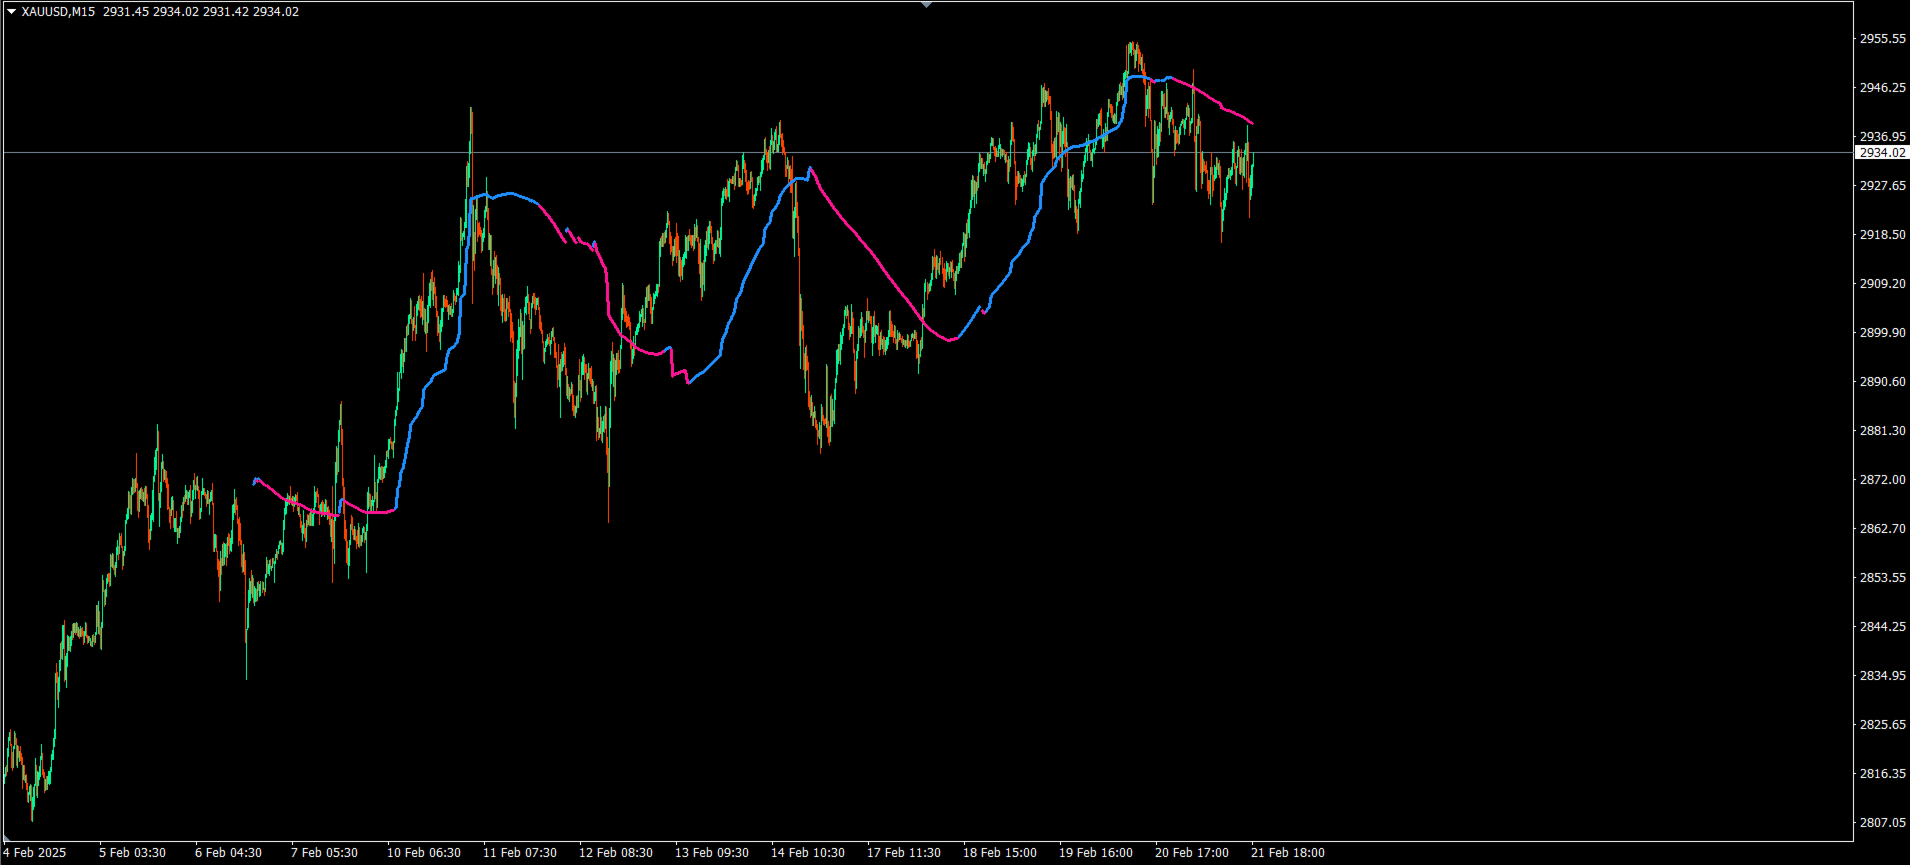
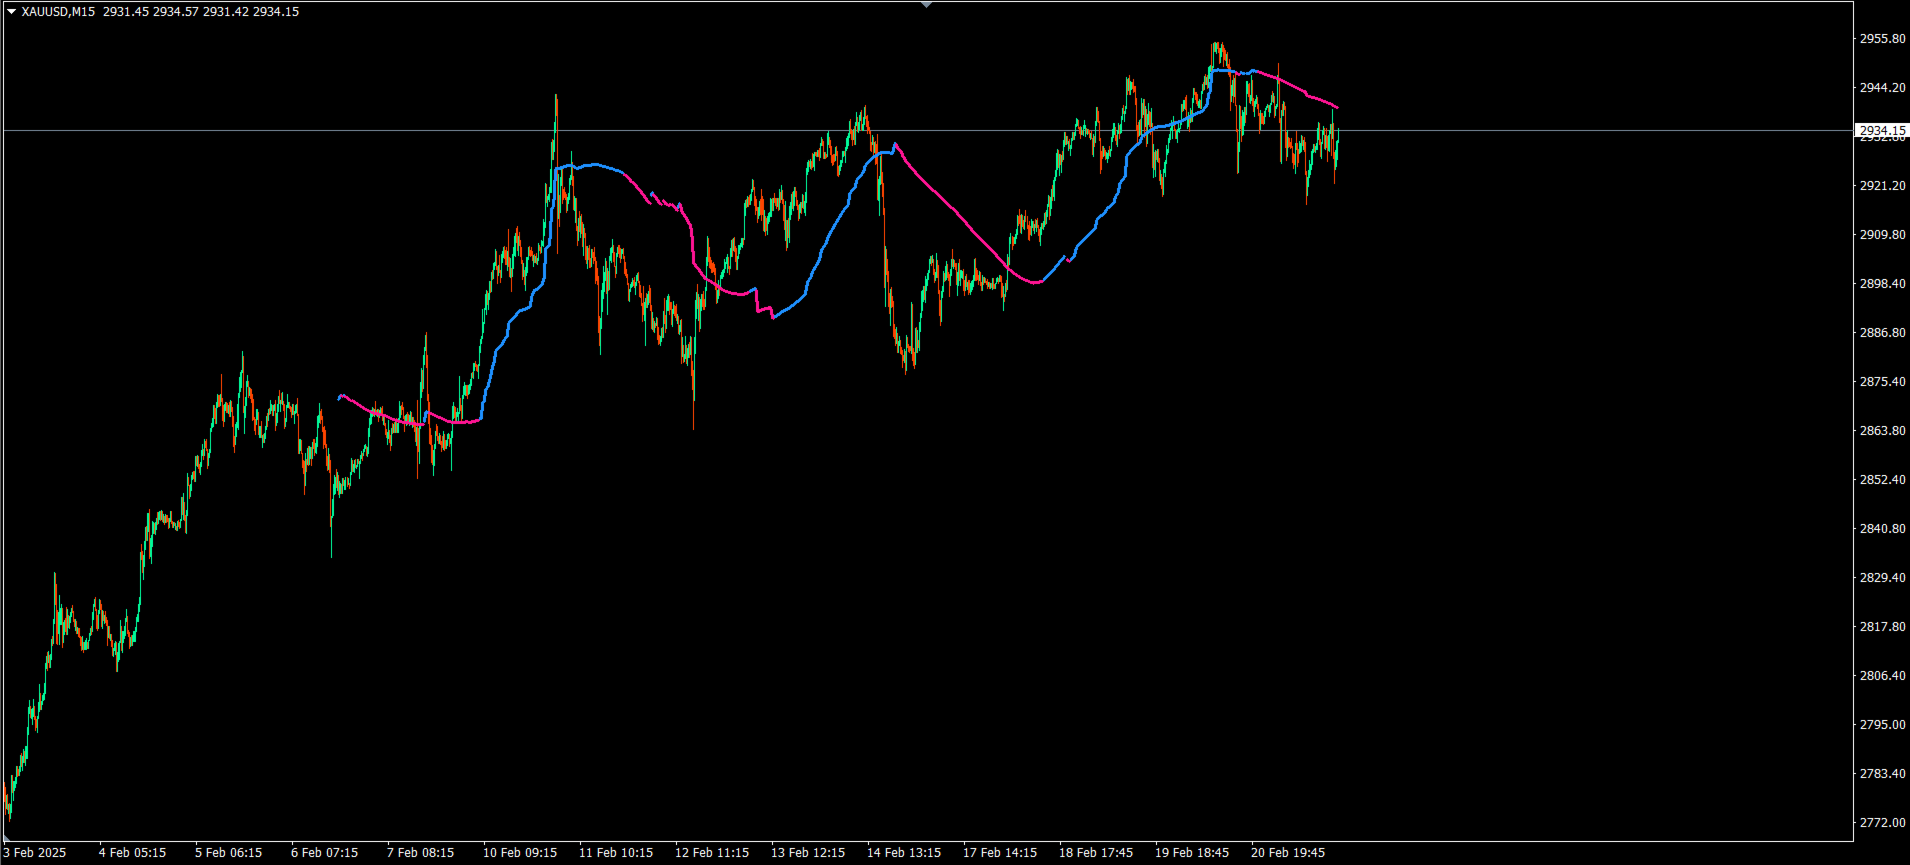
Epsilon Trend computes a smoothed price line by first normalizing the price over a lookback period and then smoothing the result with a simple moving average. The smoothed normalized value is then re‑scaled to price so it appears as an overlay similar to a MA.
The color change is computed by comparing the current bar’s smoothed value with that of the previous bar and only switching trend if the difference exceeds a small threshold (epsilon) thus minimizing constant flickering.
Use on any symbol or timeframe as you prefer