Monte Carlo Trading Heatmap
- Indicadores
- Ignacio Gonzalez Alvarez
- Versão: 1.0
- Ativações: 5
O indicador utiliza movimento Browniano e iterações de Monte Carlo para calcular a probabilidade de que o preço se mova em uma determinada direção.
O que o indicador mostra?
Por um lado, ele desenha um mapa de calor que divide a área em três zonas de acordo com a probabilidade de o preço atingir certos níveis:
- 🔴 Zona vermelha: Probabilidade maior que 50%.
- 🟠 Zona laranja: Probabilidade entre 25% e 50%.
- 🟢 Zona verde: Probabilidade inferior a 25%.
Por outro lado, ele traça uma linha azul, que representa a trajetória com maior probabilidade.
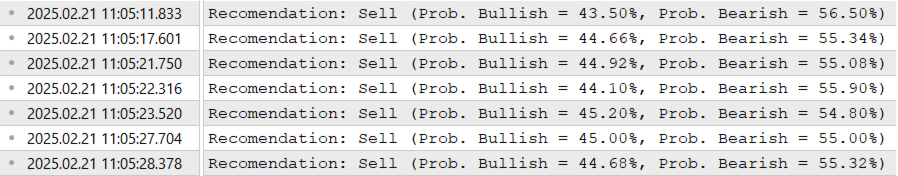
Finalmente, ele leva em consideração o número de estados de probabilidade de alta e baixa, exibindo na janela de especialistas a probabilidade de que todo o movimento seja altista ou baixista.
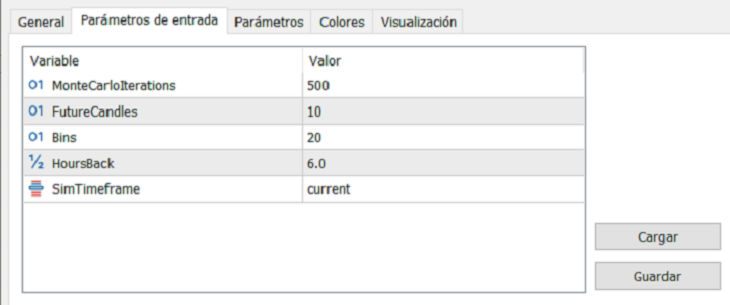
Parâmetros de entrada
- MonteCarloIterations - Número de simulações de Monte Carlo por vela futura. Quanto maior o valor, mais precisa será a estimativa de probabilidade, mas também mais lento será o cálculo.
- FutureCandles - Número de velas futuras a serem simuladas, quantas velas no futuro serão projetadas no mapa de calor e na trajetória azul.
- Bins - Número de divisões no histograma do mapa de calor, mais bins significam maior granularidade na distribuição dos preços.
- HoursBack - Quantidade de horas de dados históricos a serem analisados, mais horas melhoram a estabilidade estatística.
- SimTimeframe - Periodicidade usada para a simulação, você pode trabalhar com diferentes timeframes ou usar o do gráfico atual.
Ajuste esses parâmetros de acordo com a potência do seu computador e suas necessidades de análise.
Como posso usar o indicador?
Este indicador pode ser utilizado para diversas finalidades:
- O limite externo da zona verde pode ser usado para definir áreas onde colocar o Stop Loss.
- O mapa de calor permite estimar em qual período de tempo e com que velocidade um objetivo pode ser atingido.
- A linha azul serve para confirmar movimentos ou entradas.
- Se a janela de especialistas mostrar uma divergência significativa na probabilidade de alta-baixa, isso pode servir como um sinal para confirmar ou buscar oportunidades de entrada.