Trend and Lines
- Indicadores
- Oliver Hinrichs
- Versão: 1.2
- Ativações: 5
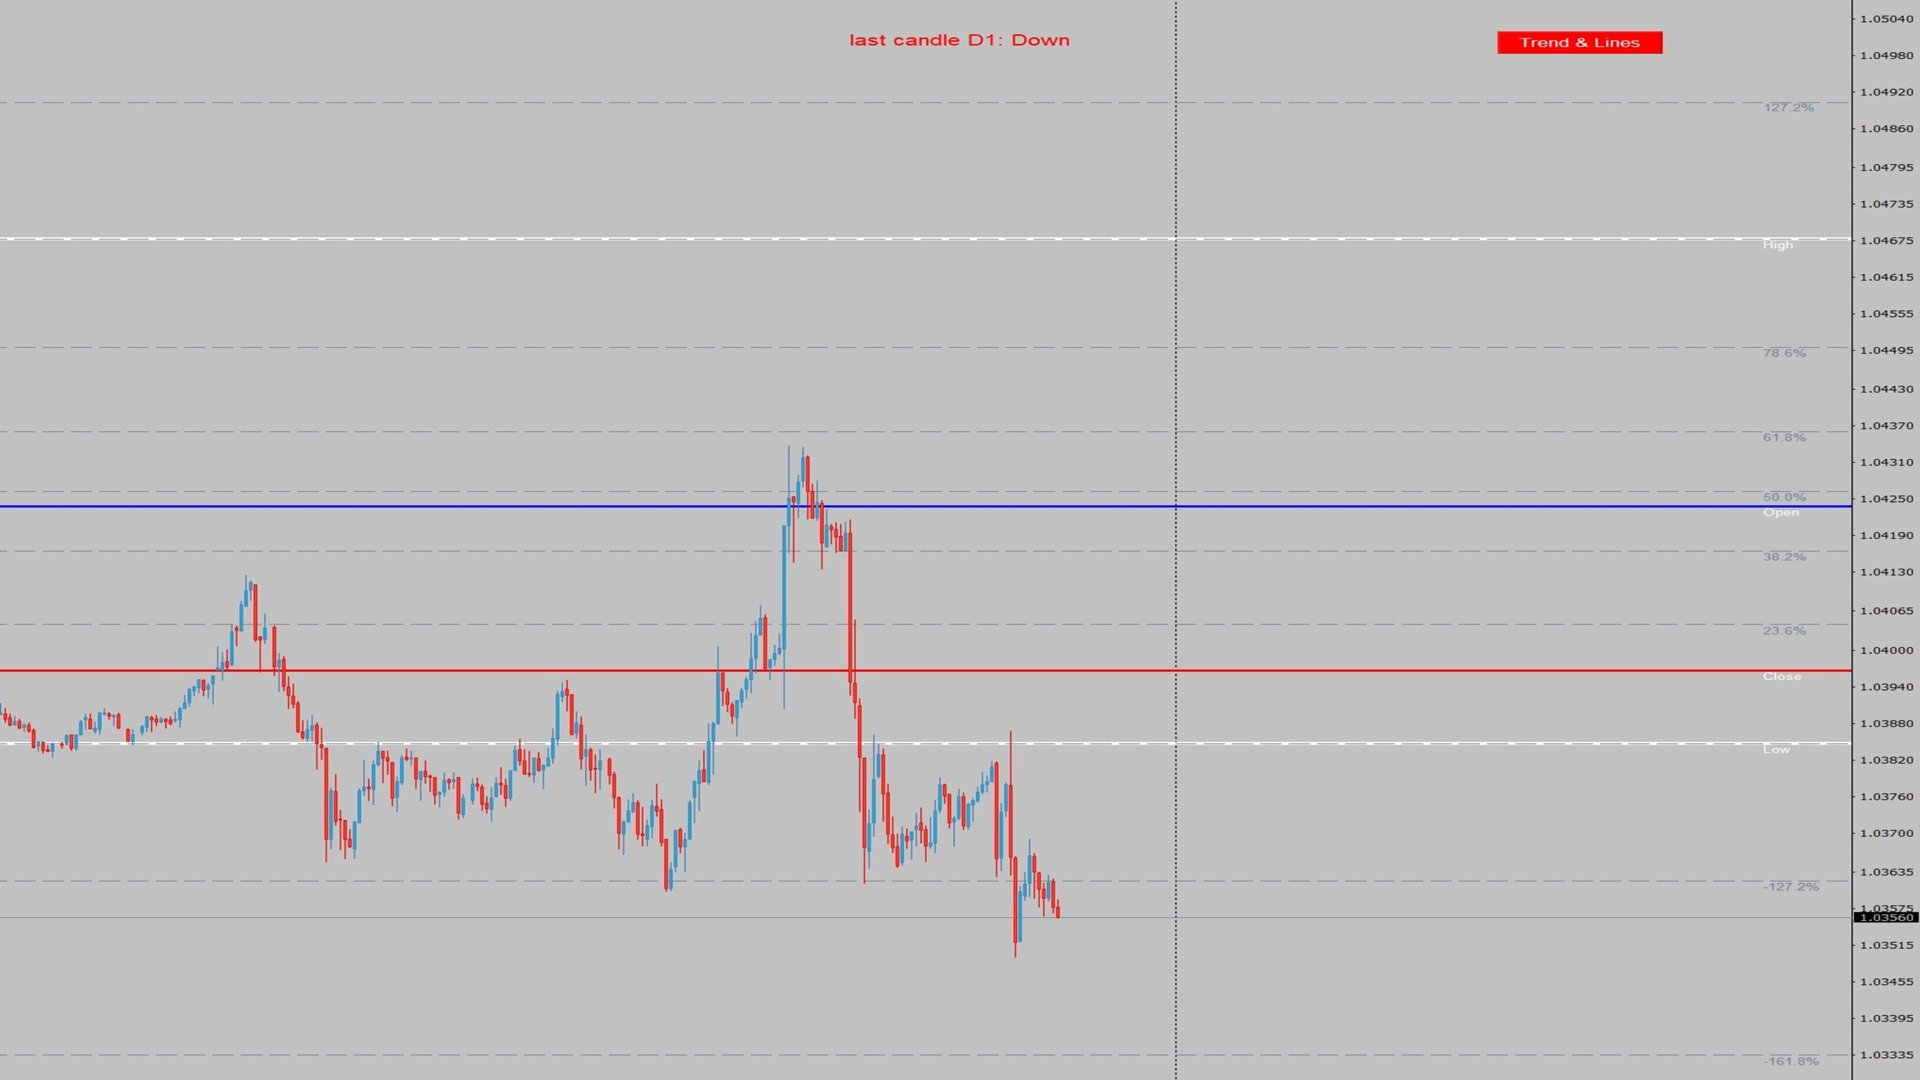
This indicator draws lines at the open, close, high and low price of the last chart candle from the set timeframe.
In addition, a label shows whether it was an up or down candle.
The standard settings follow the original idea of getting the price data from the daily timeframe for day trading/scalping, but
since this indicator is fully customizable, you can also set a different timeframe.
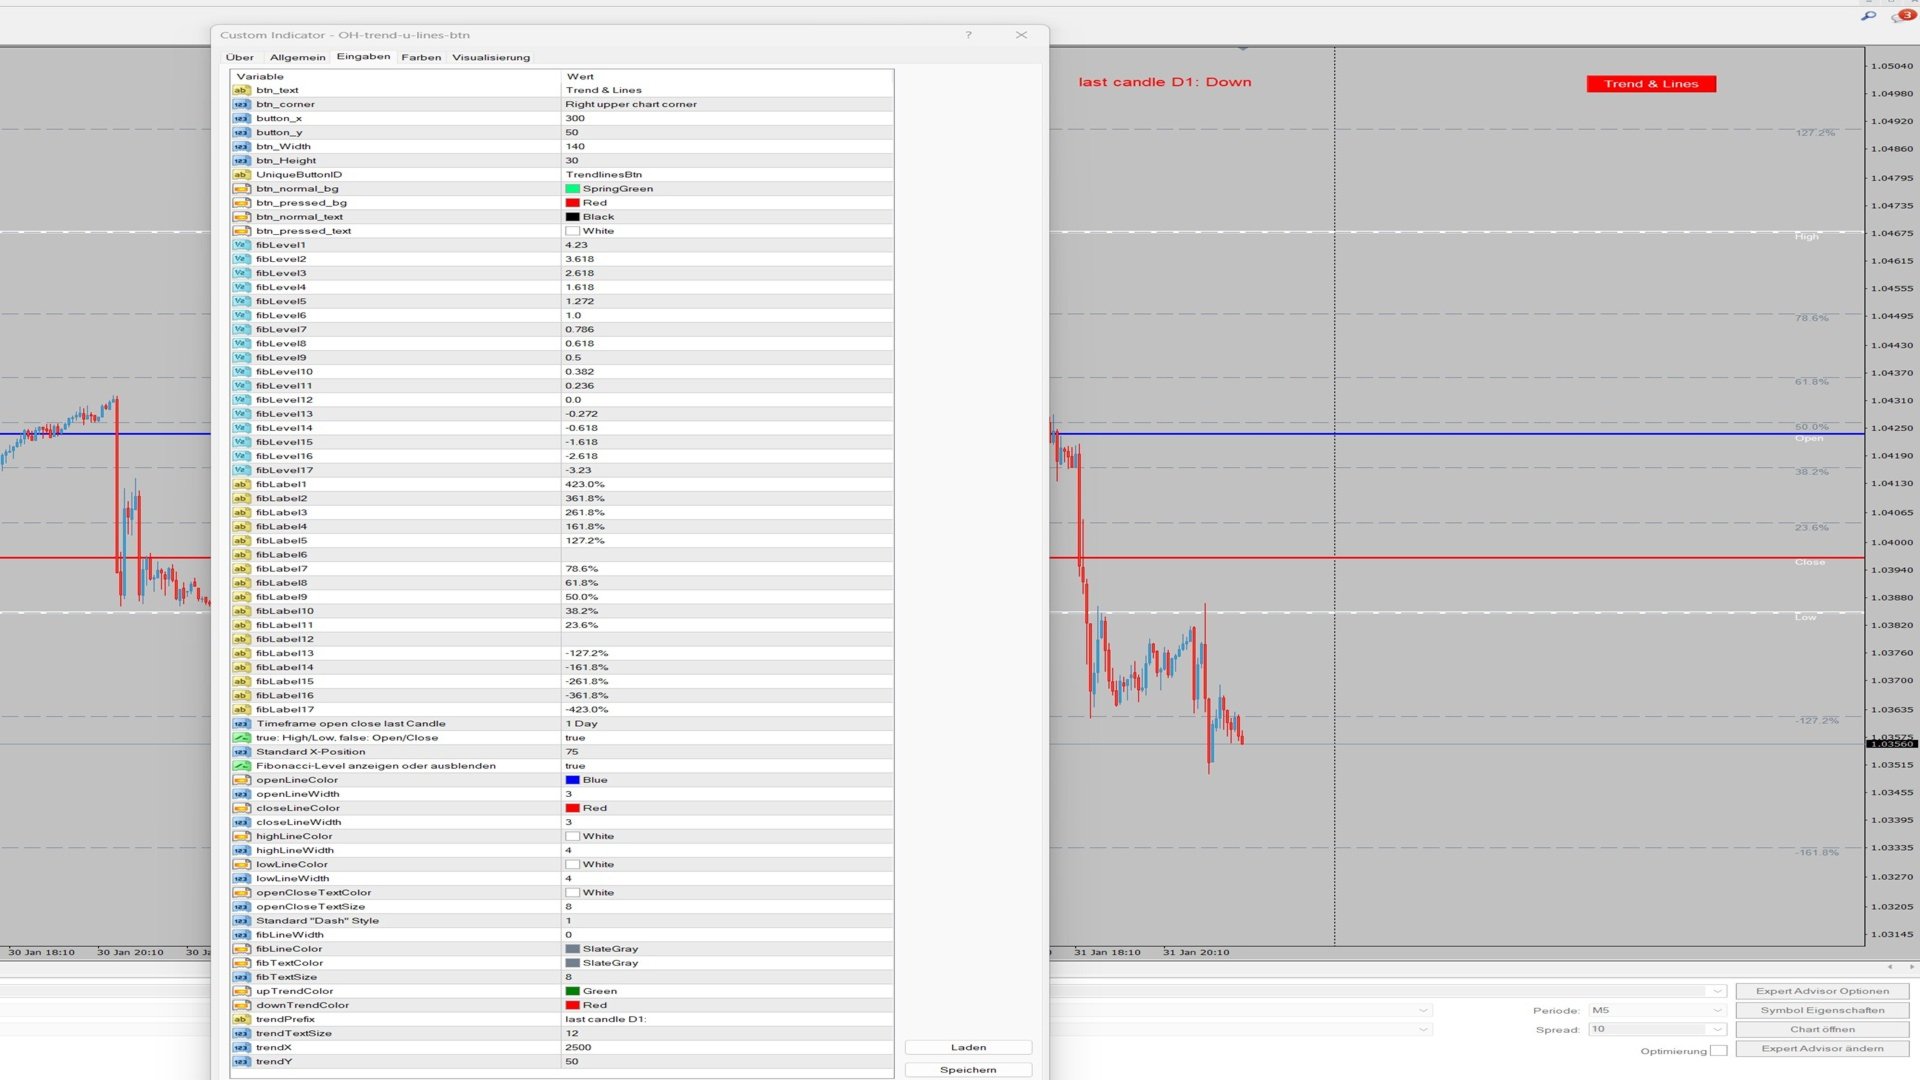
Based on the drawn price lines, you can then also display Fibonacci levels.
This function can also be switched on and off in the settings, just as you can set whether the levels should be created based on open/close or high/low.
To keep the chart clear, this indicator can also be switched on and off using a button on the chart.
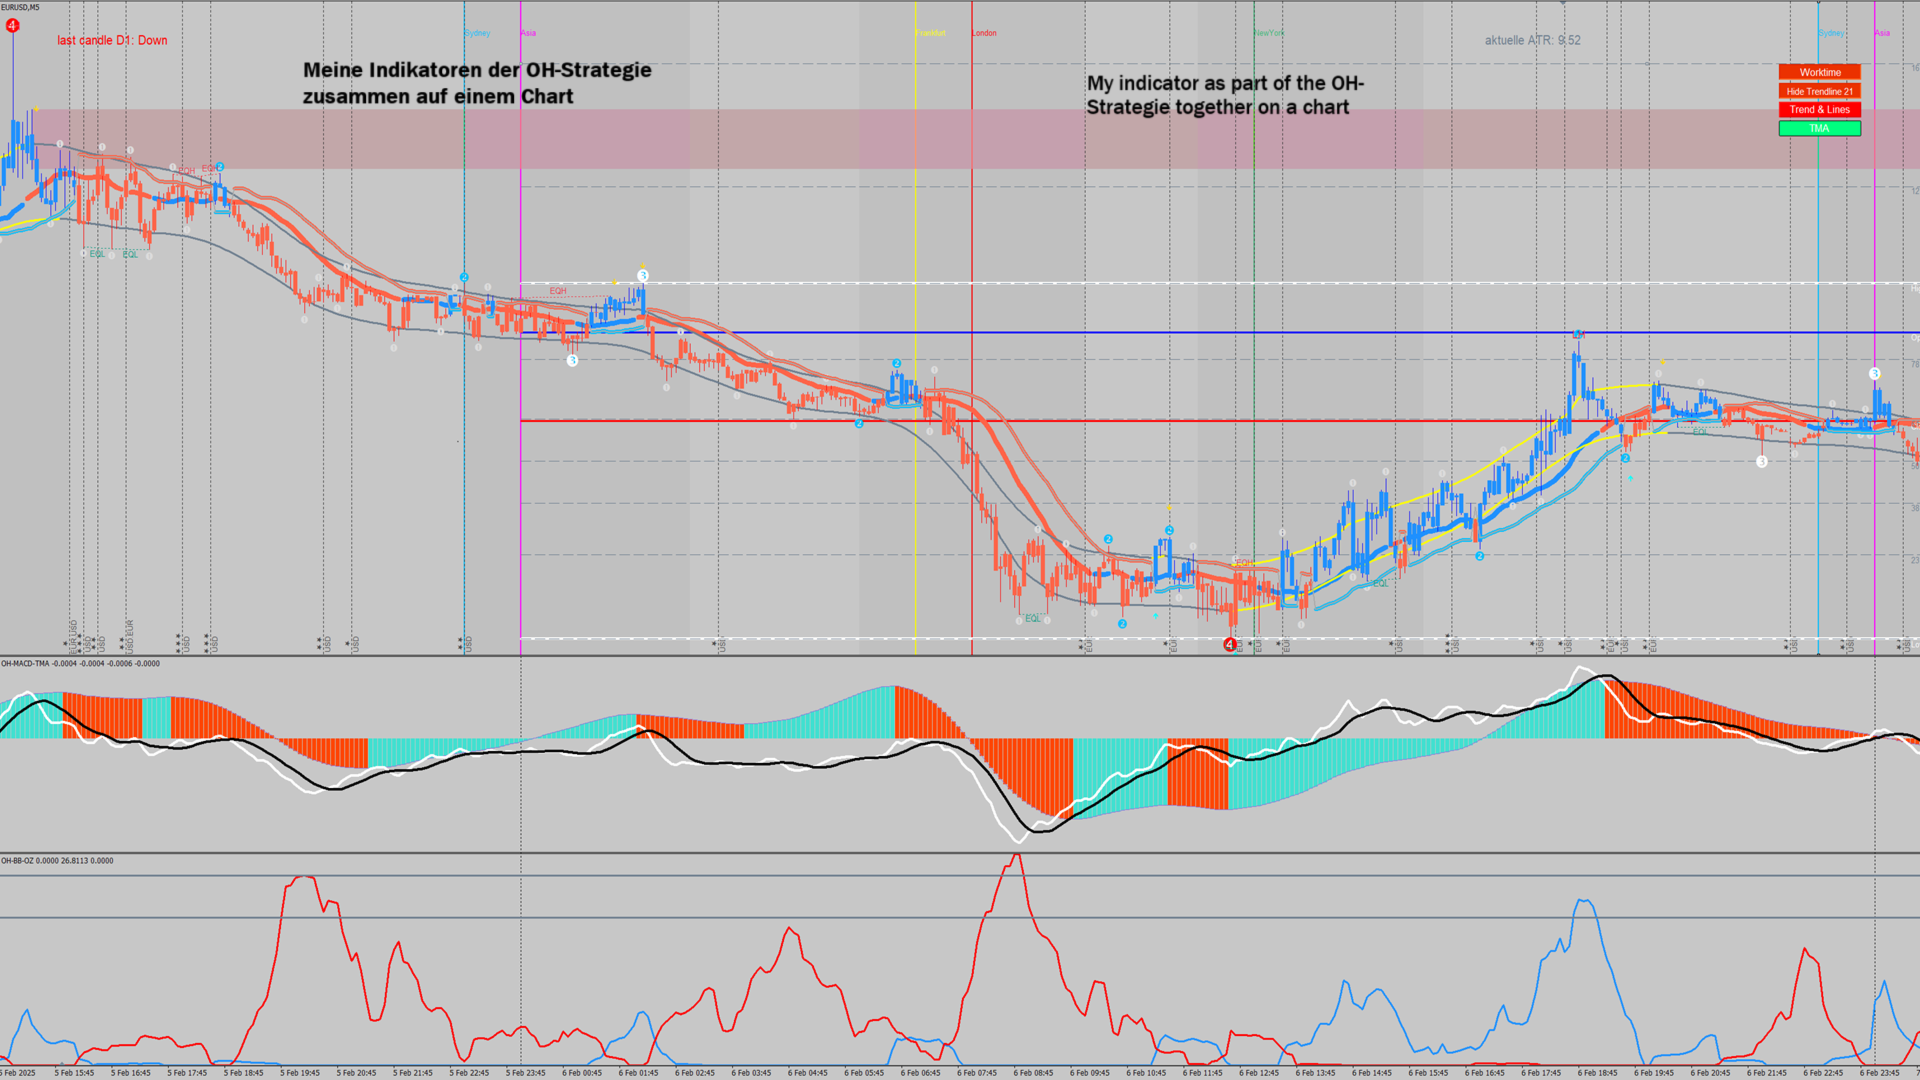
The position, design and label of the button can be adjusted, as can the position of all labels and the line type, line thickness, line color, etc. This indicator is part of the OH strategy. You can view other indicators of this strategy if you click on my name as a seller.