Volatility Region MT5
- Indicadores
- Yonggang Shang
- Versão: 2.0
- Atualizado: 3 fevereiro 2025
- Ativações: 5
Indicator Introduction:
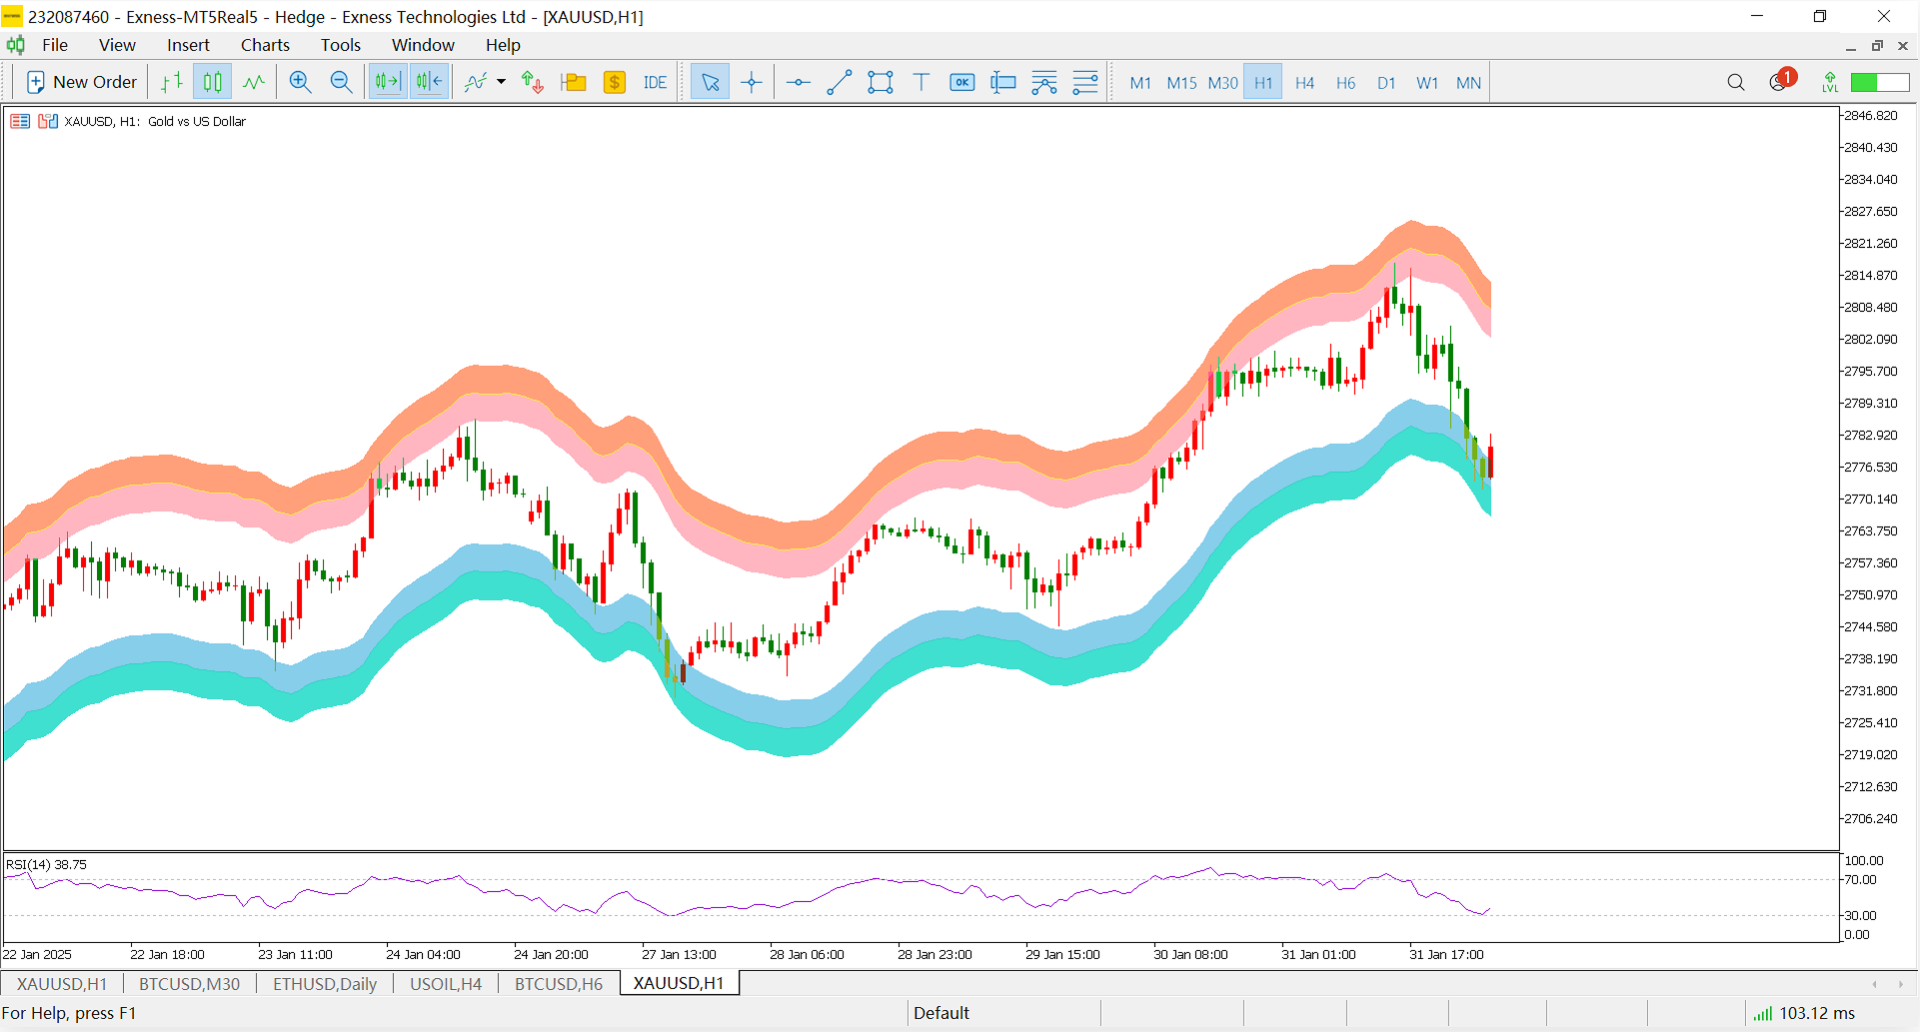
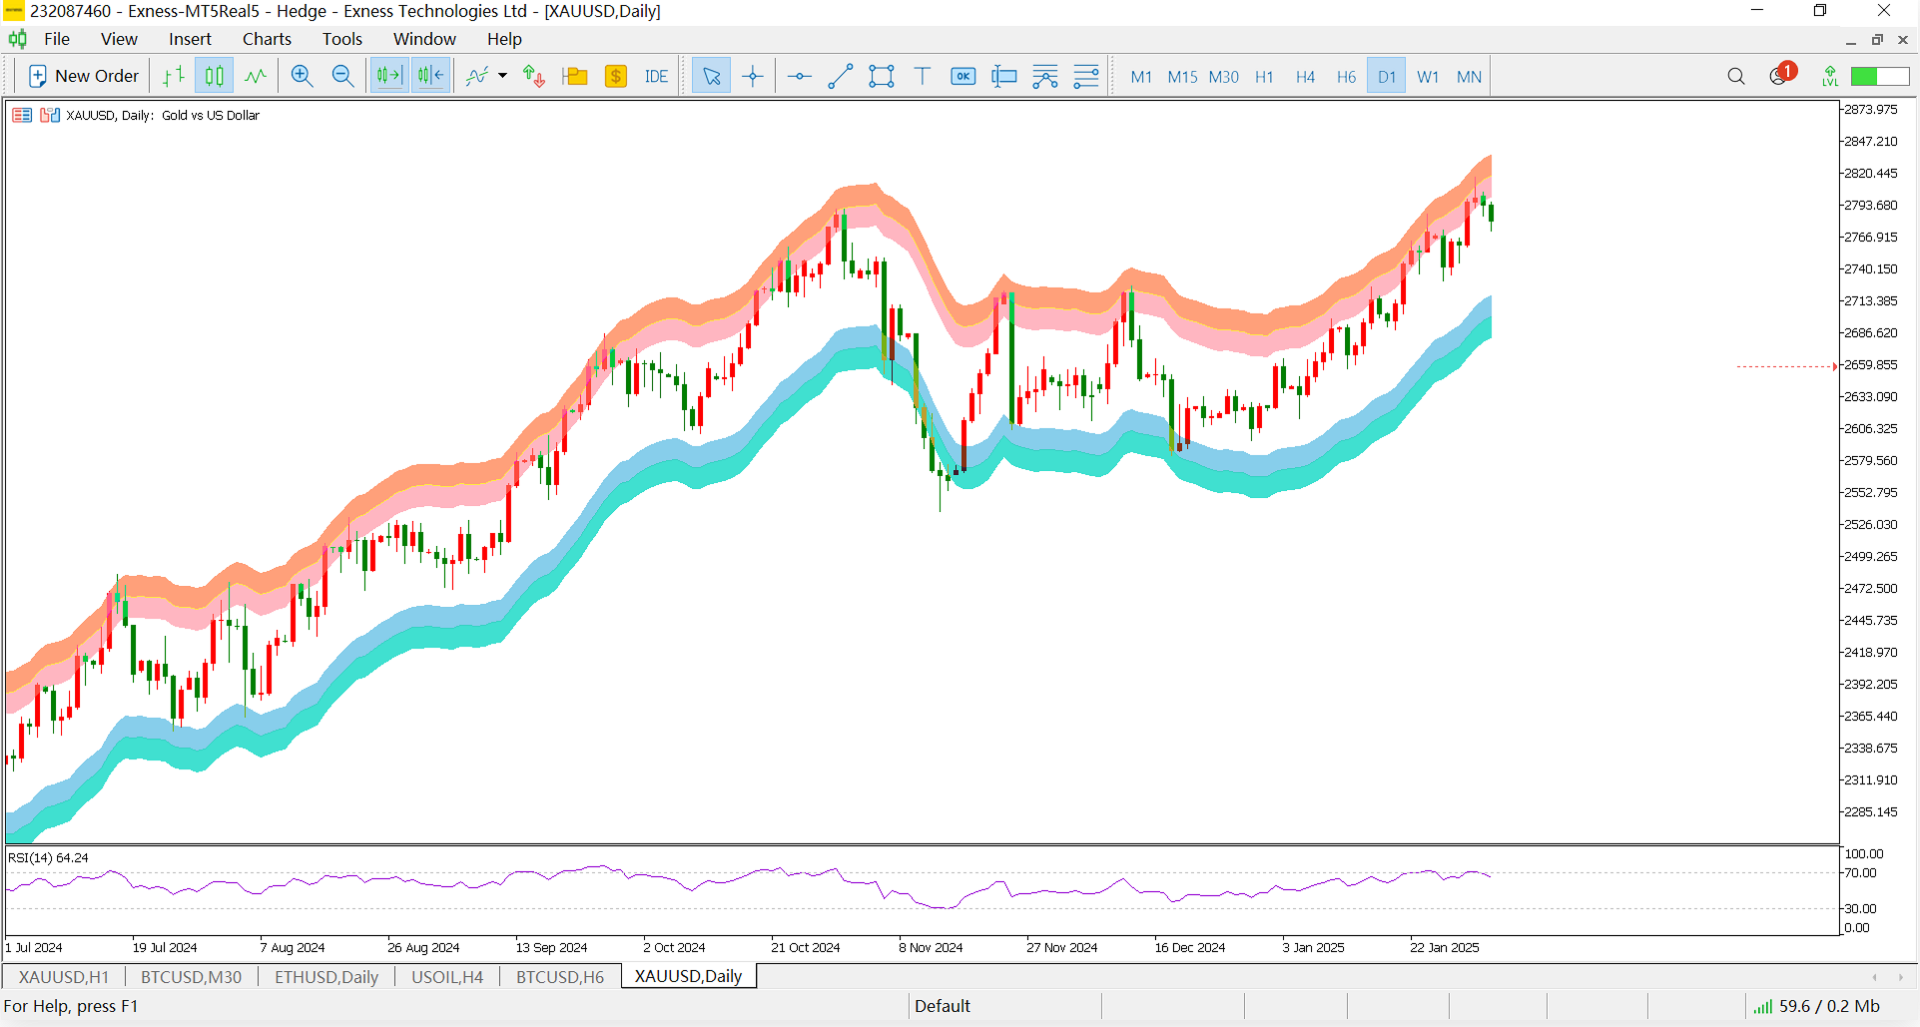
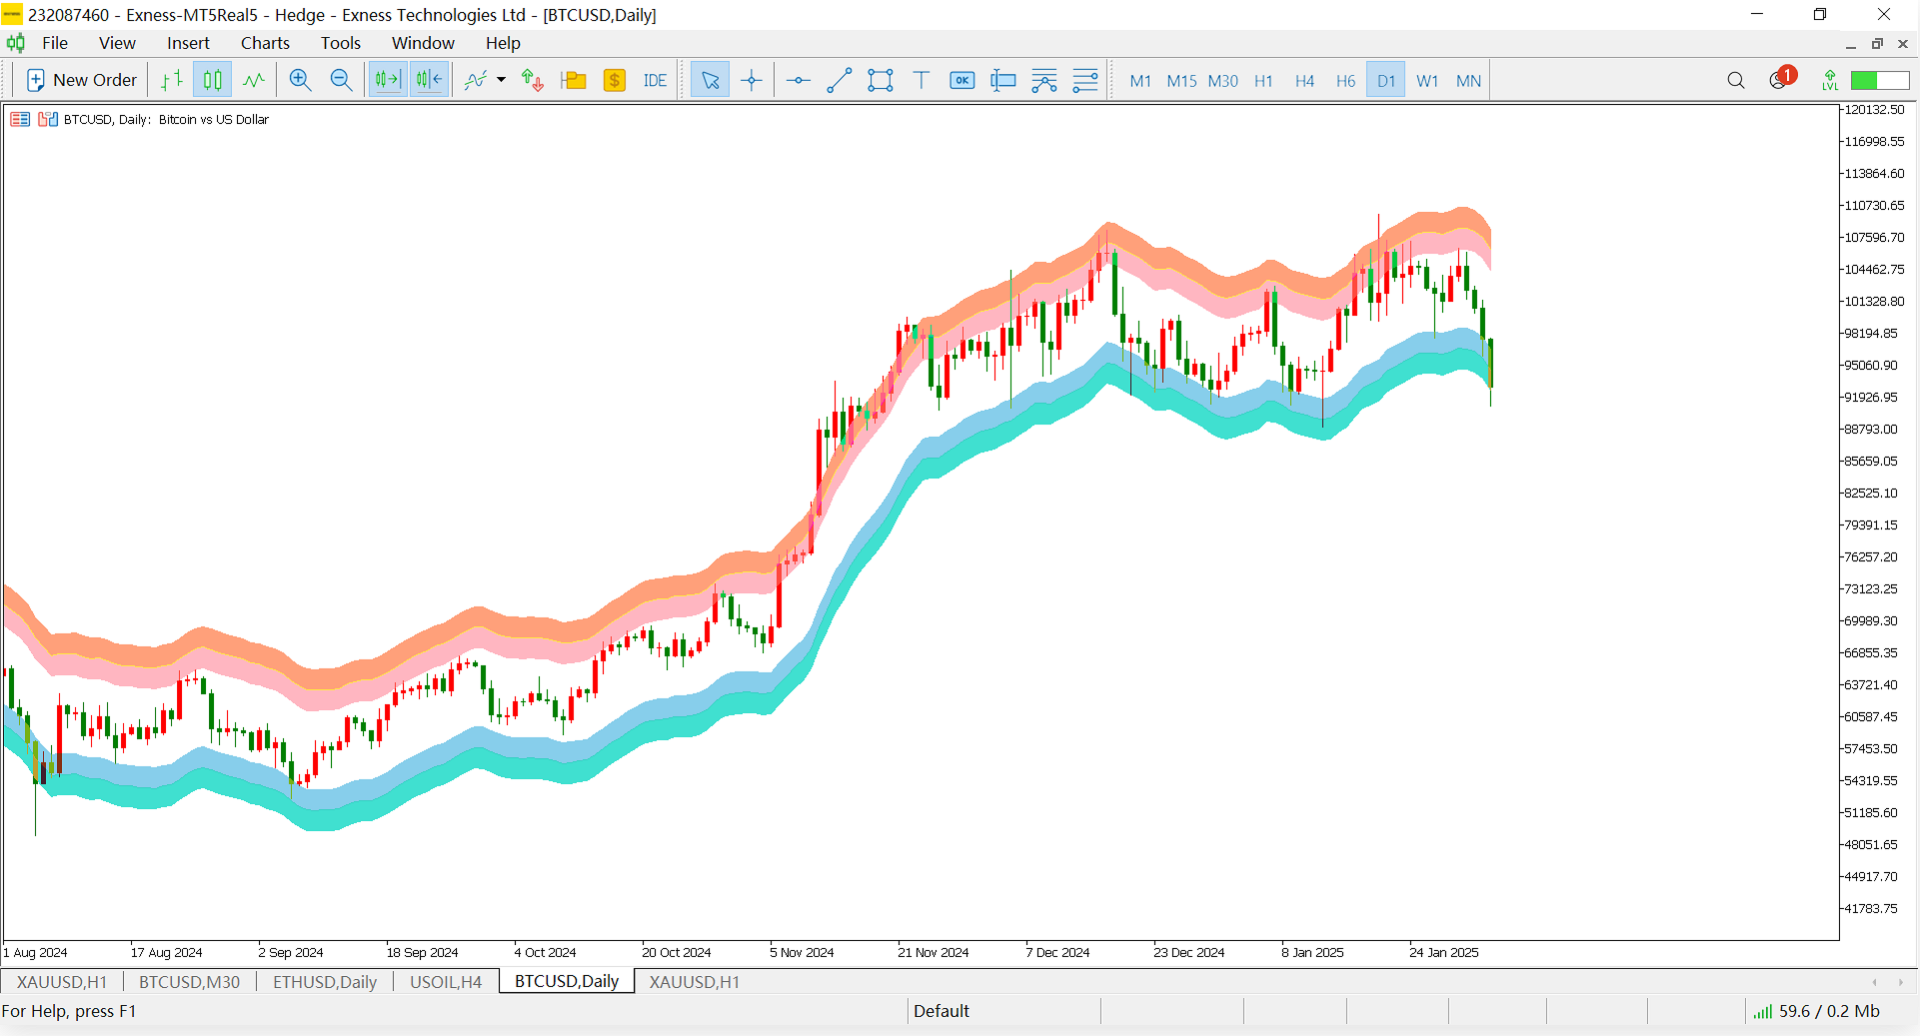
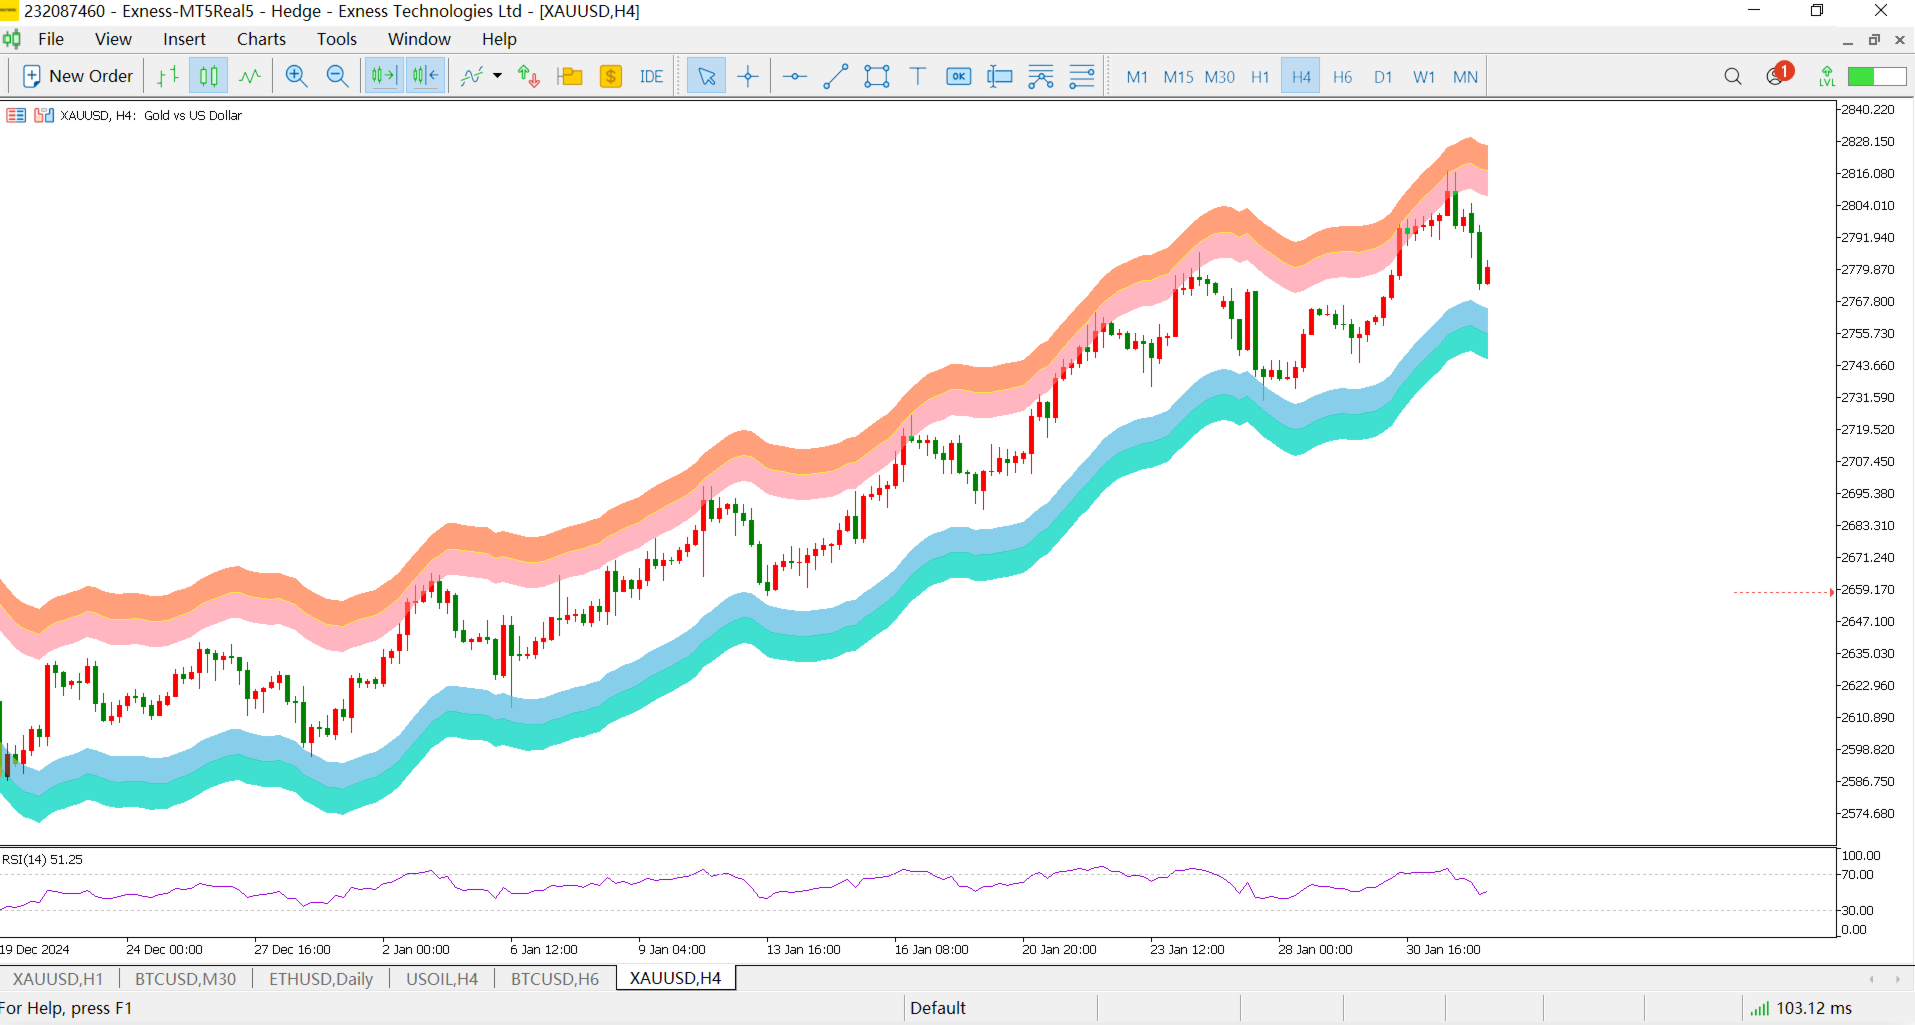
The Volatility Range Indicator aims to help traders identify the current market's volatility range by analyzing historical price data. By calculating the upper and lower bounds of price fluctuations, traders can determine potential support and resistance levels, providing a foundation for subsequent trading decisions. This indicator is particularly suitable for ranging markets and high-volatility environments, as it can effectively assist traders in capturing price breakouts from the range, optimizing entry and exit points.
Application Scenarios:
-
Ranging Markets: In ranging markets, prices typically fluctuate within a specific range. The Volatility Range Indicator helps traders identify the upper and lower bounds of this range. When prices break through these boundaries, it may signal the start of a new trend or reversal, providing clear entry or exit signals for traders.
-
High-Volatility Markets: In high-volatility markets, the Volatility Range Indicator helps traders identify potential breakout points. For instance, when the market experiences a sharp price movement, the volatility range may be quickly breached, indicating the formation of a new trend. Traders can capitalize on this breakout by entering trades accordingly.
-
Trend Identification: In trending markets, a breakout from the volatility range can signal the acceleration or continuation of the current trend. A price breakout above the upper bound may confirm an uptrend, while a breakout below the lower bound may confirm a downtrend.
Contact Information: https://www.mql5.com/en/users/zhihui_dianjin