Trend Strength Visualizer
- Indicadores
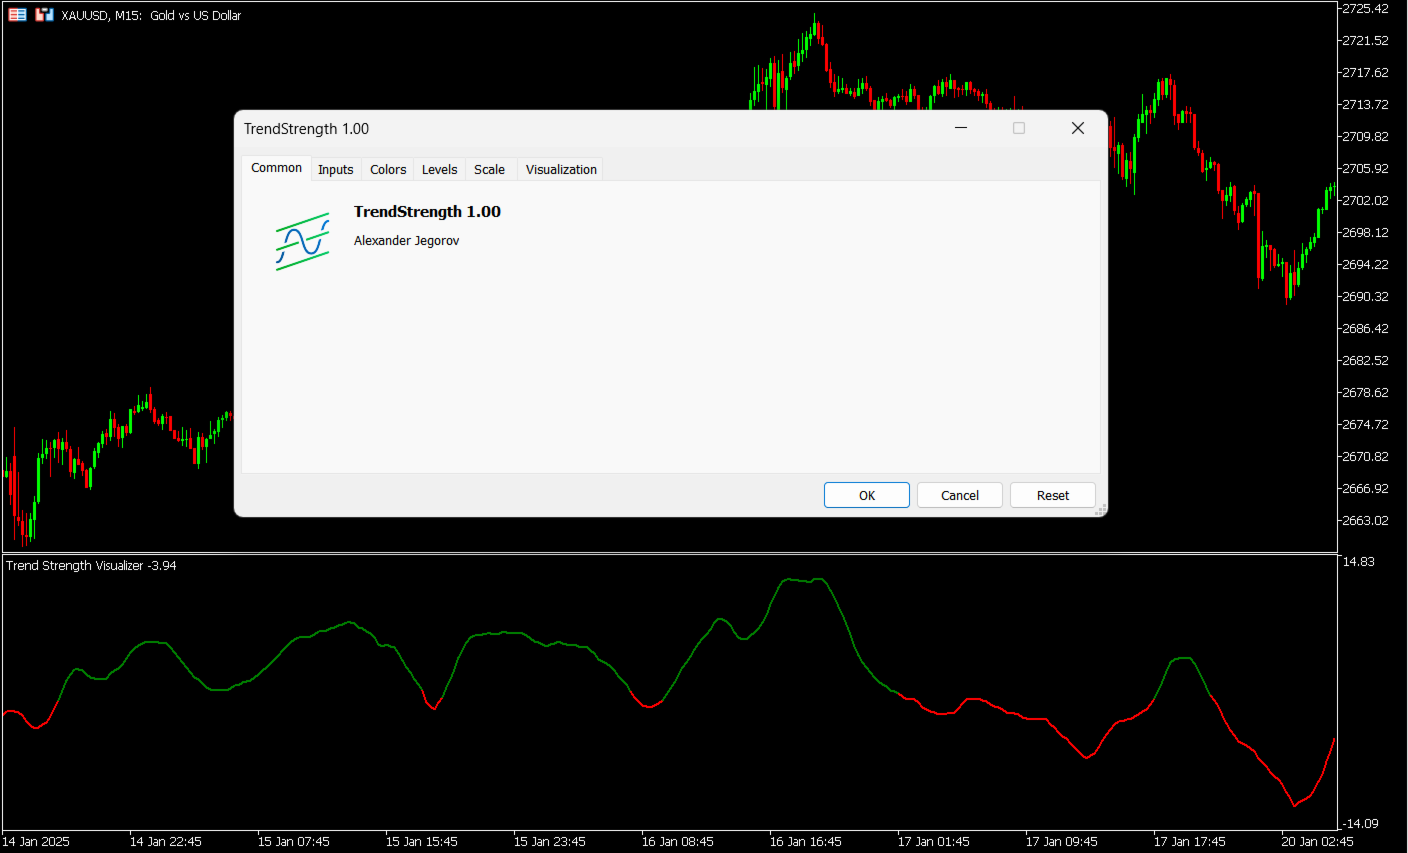
- Alexander Denisovich Jegorov
- Versão: 1.0
- Ativações: 10
Trend Strength Visualizer
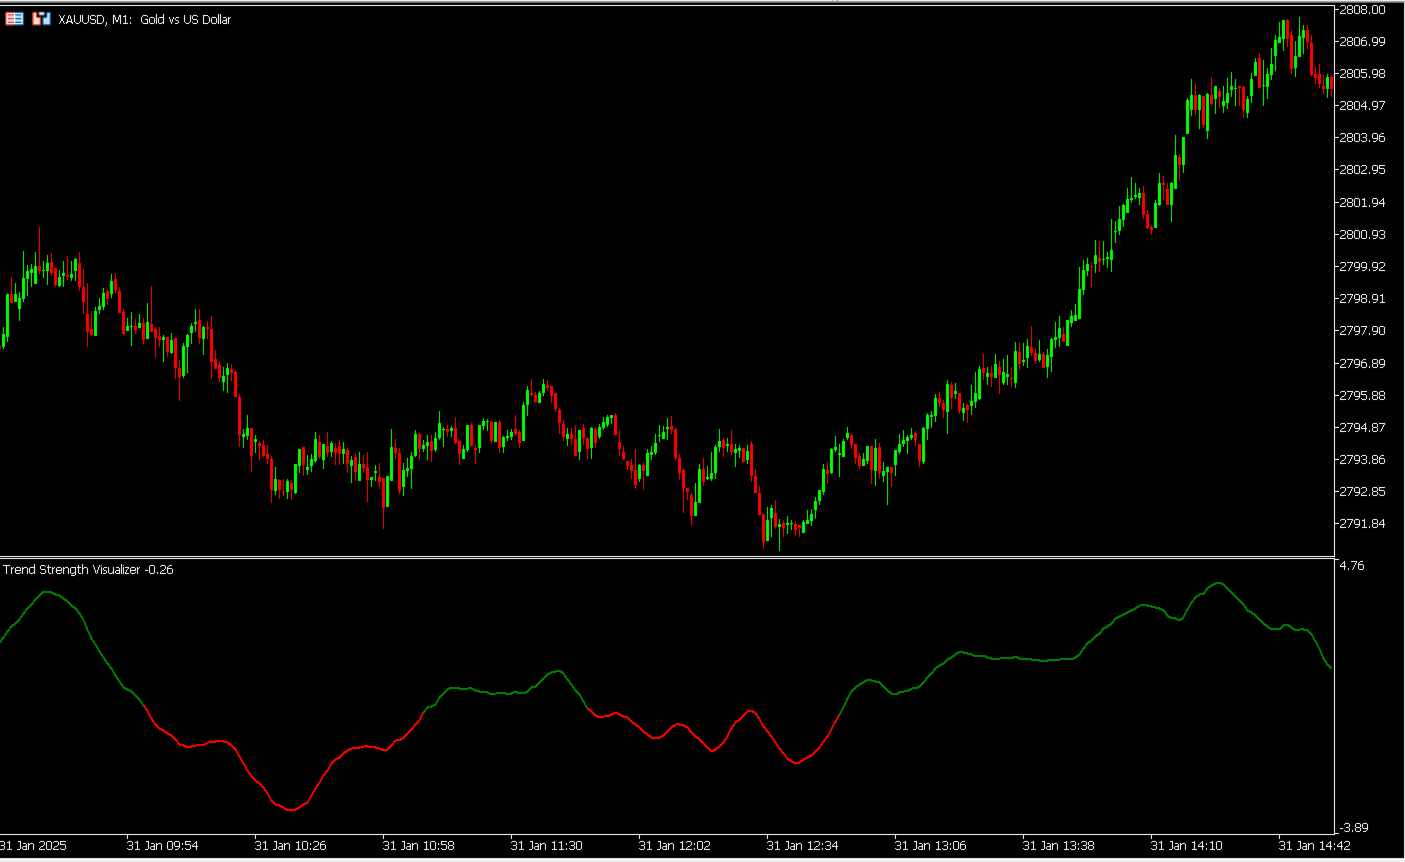
A Simple Tool for Trend Analysis
This indicator helps you quickly assess the strength of market trends using fast and slow moving averages. It’s designed to give you a clear visual representation of the trend, so you can make better trading decisions.
~Displays:
-
Green Line: Strong uptrend (potential buying opportunities).
-
Red Line: Strong downtrend (potential selling opportunities).
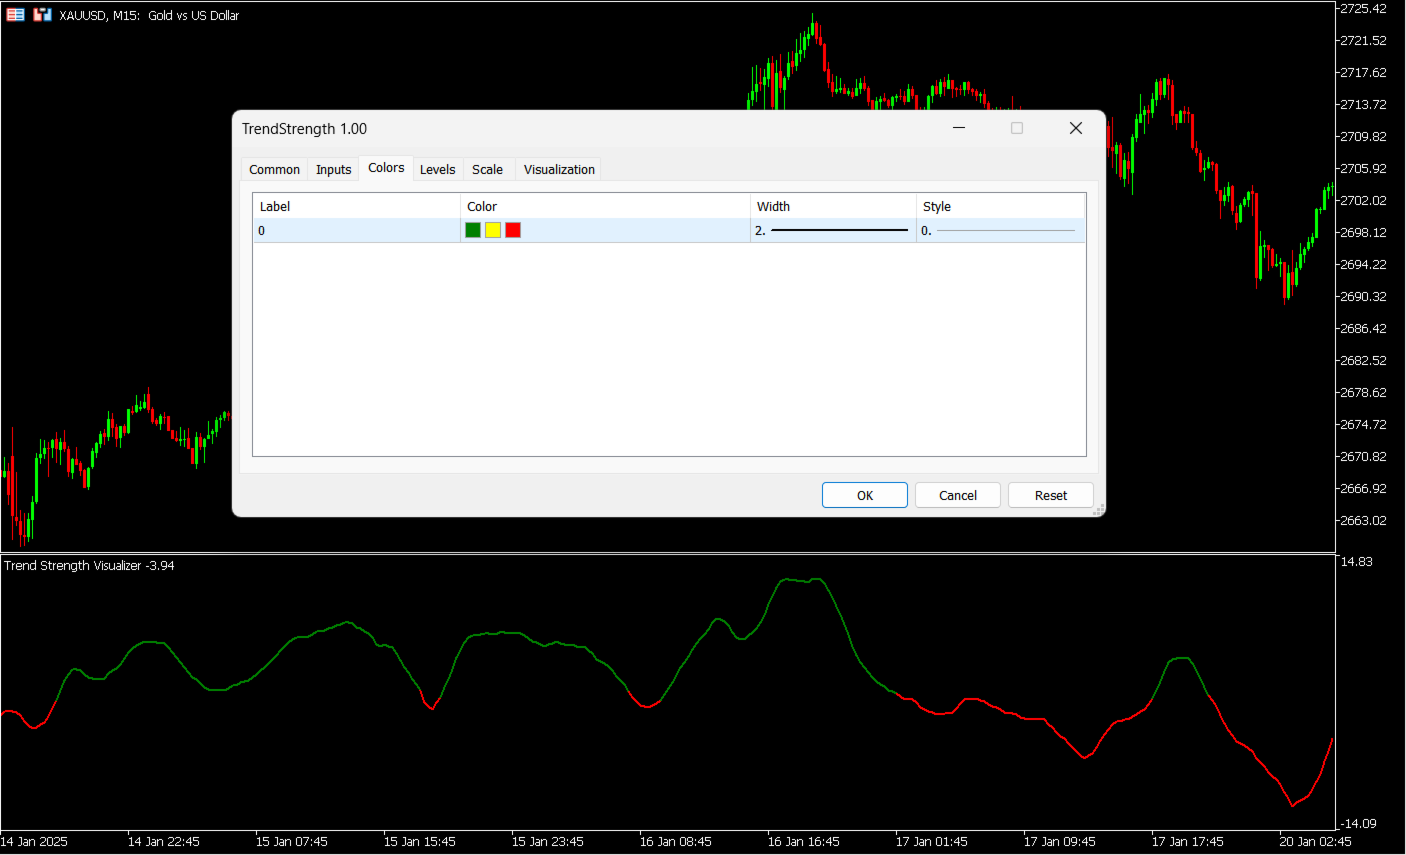
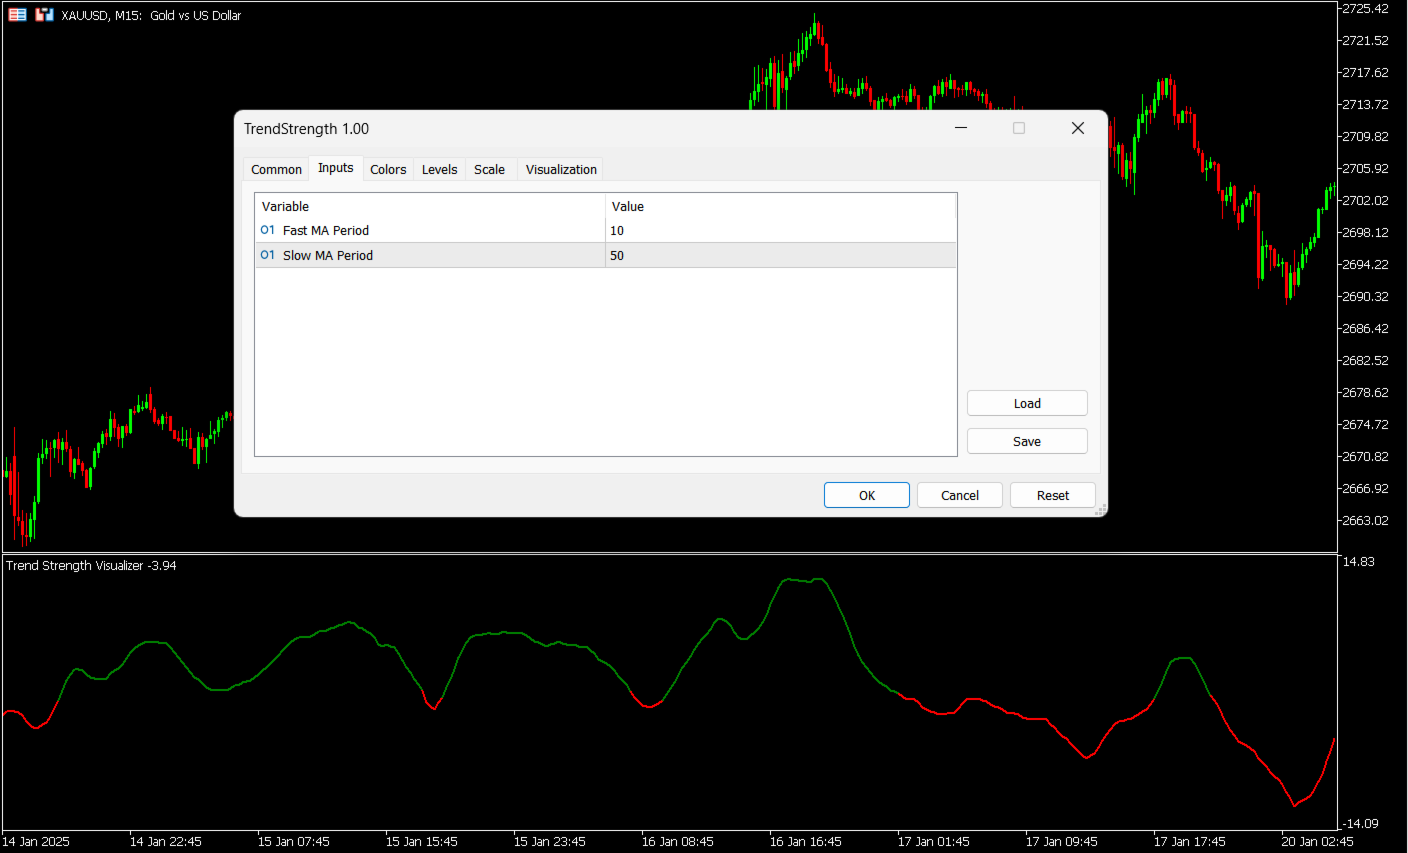
~Values That Can Be Changed:
-
Fast MA period.
-
Slow MA period.
-
Line color for uptrend and downtrend.
-
Line width and style.
Why I Use It:
It’s straightforward, customizable, and helps me stay on top of market trends without overcomplicating things. If you’re looking for a no-nonsense tool to improve your trend analysis, this is it.
Why It’s Worth Trying:
-
Saves Time: Instantly see trend strength without manual calculations.
-
Customizable: Adjust settings to fit your trading style.
-
Clear Visuals: No clutter—just the information you need.