Optimum Points MT5
- Indicadores
- Yuriy Lyachshenko
- Versão: 1.0
- Ativações: 10
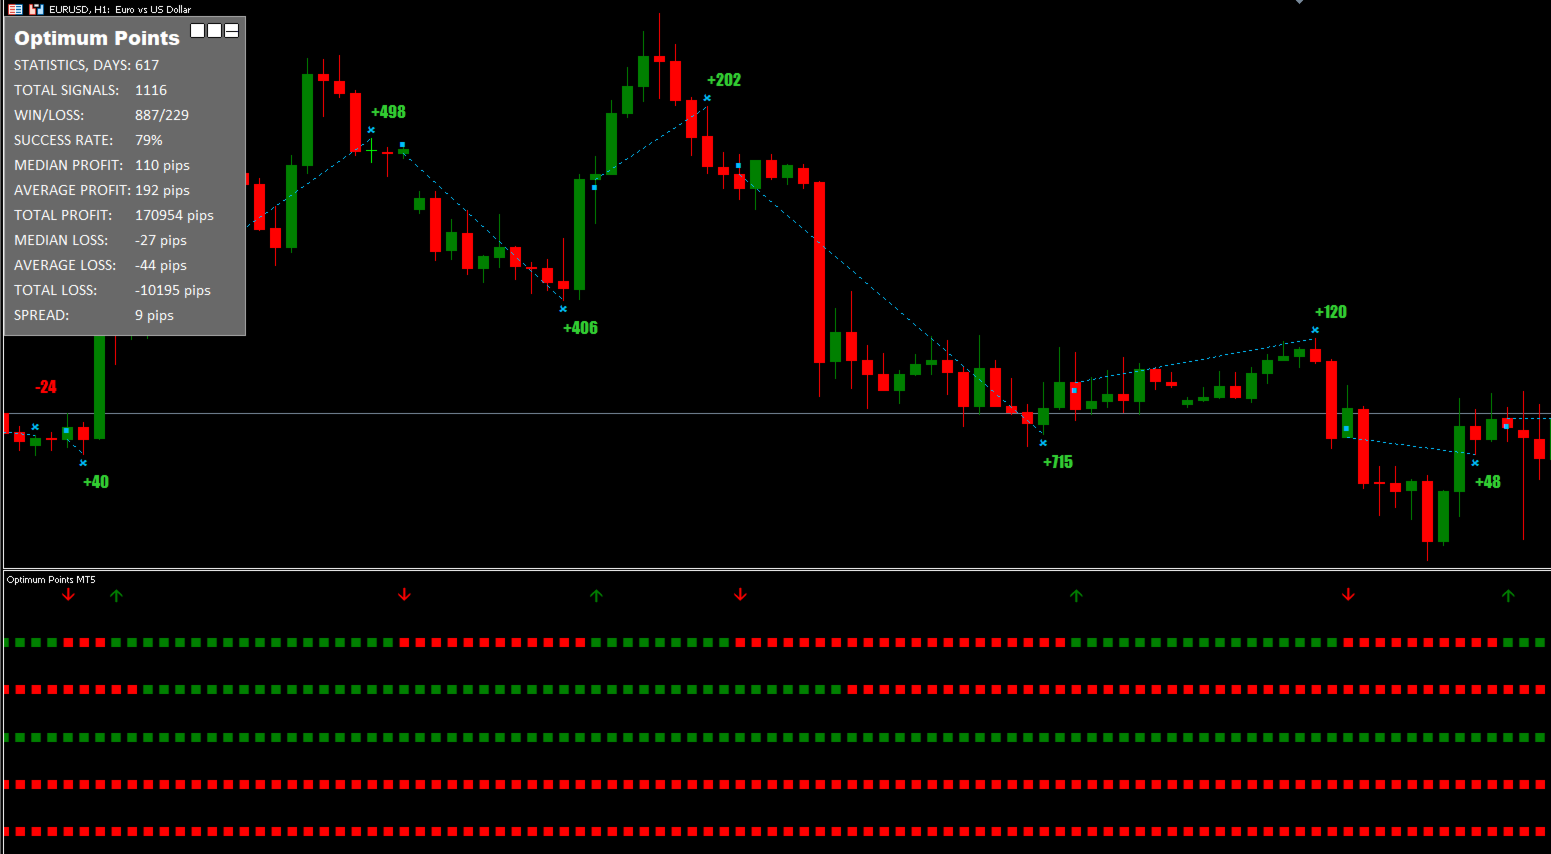
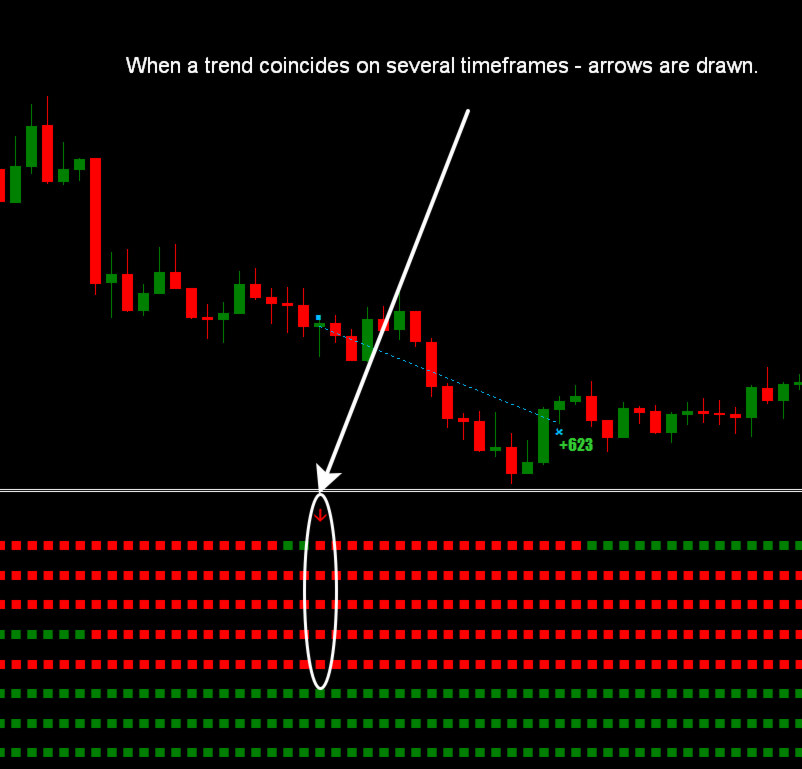
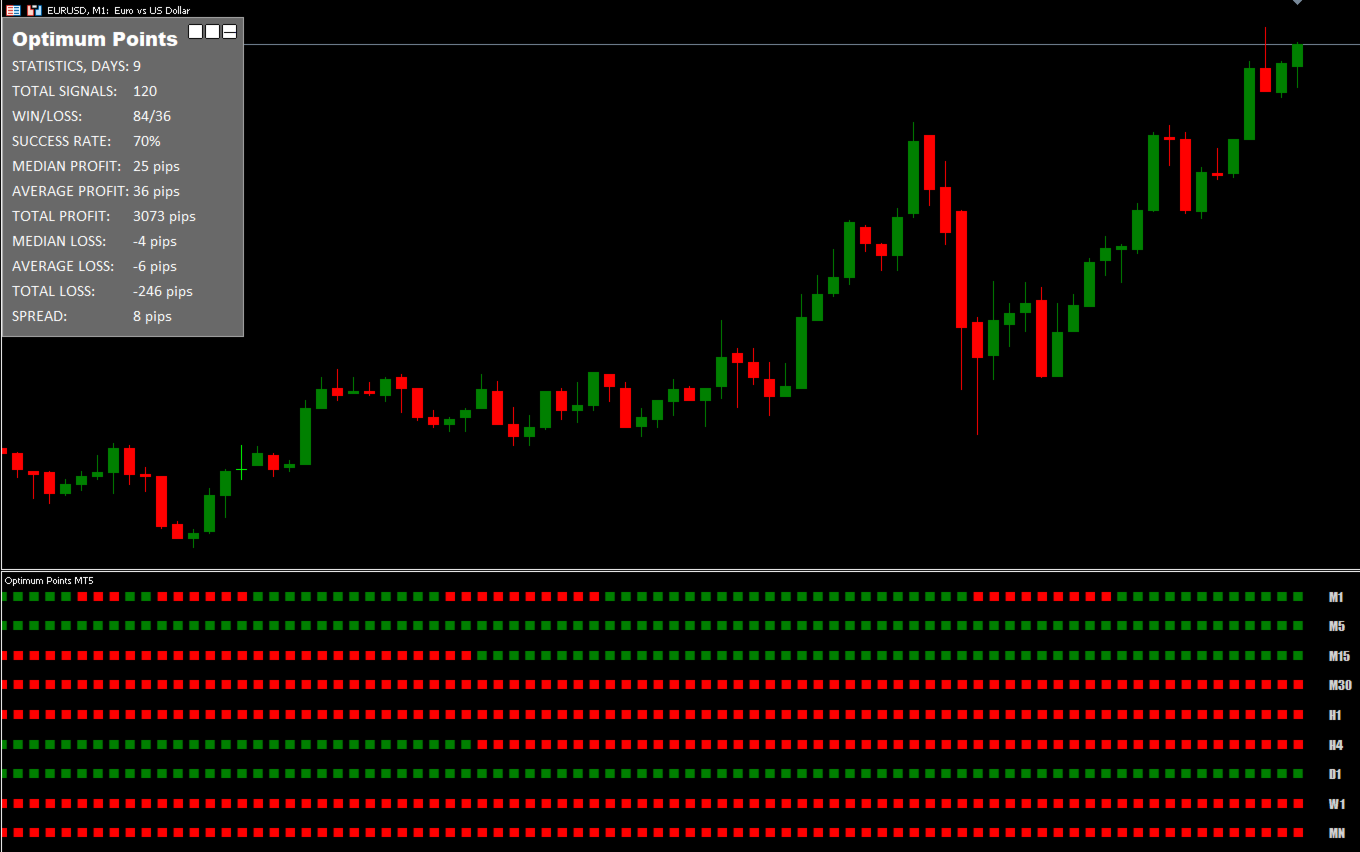
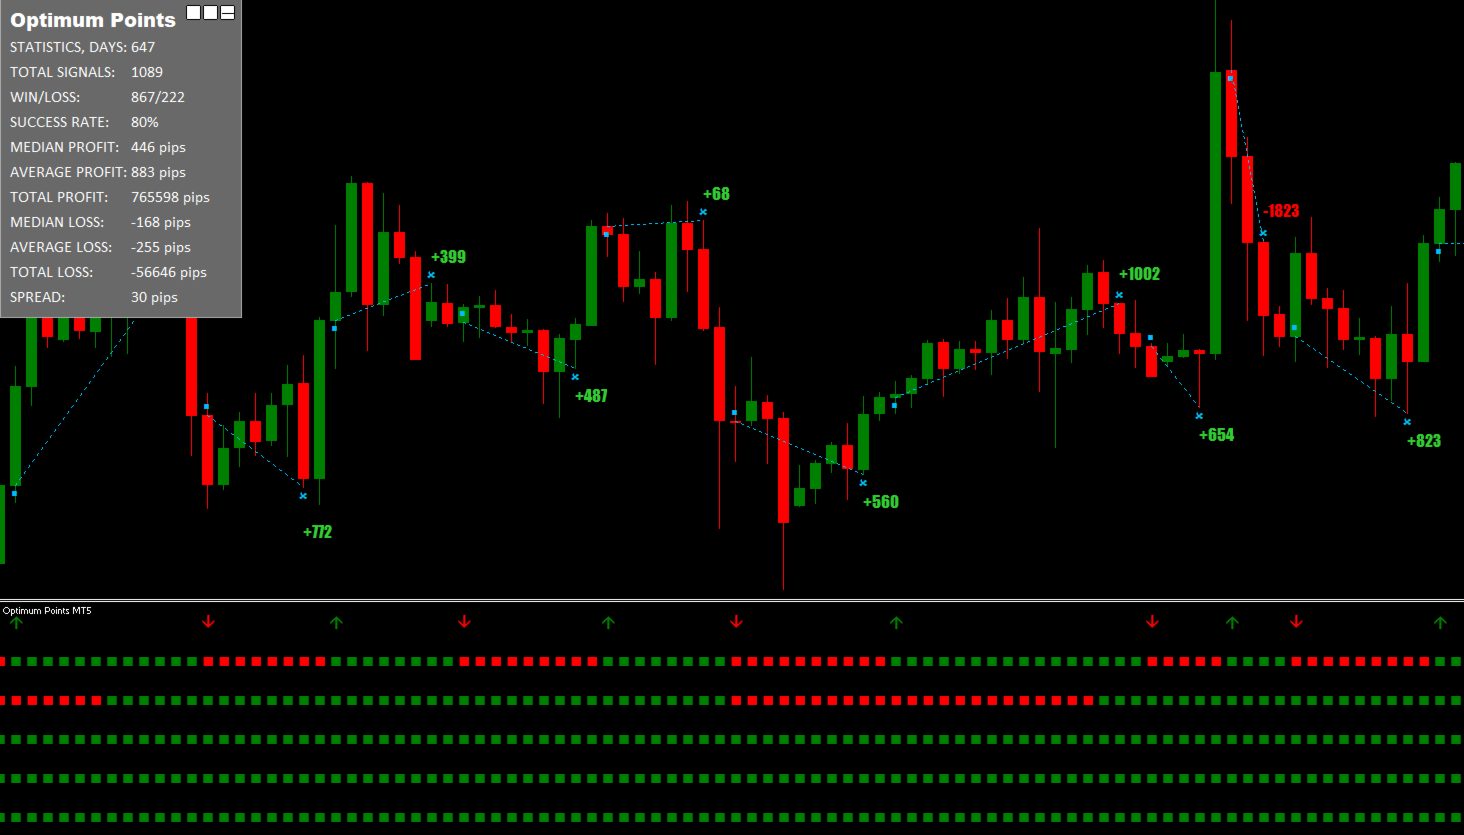
O indicador mostra a direção da tendência de vários períodos de tempo numa janela. Se a tendência de vários períodos de tempo coincidir, são desenhadas setas. Também pode mudar para o histograma, indicando a tendência no período de tempo atual.
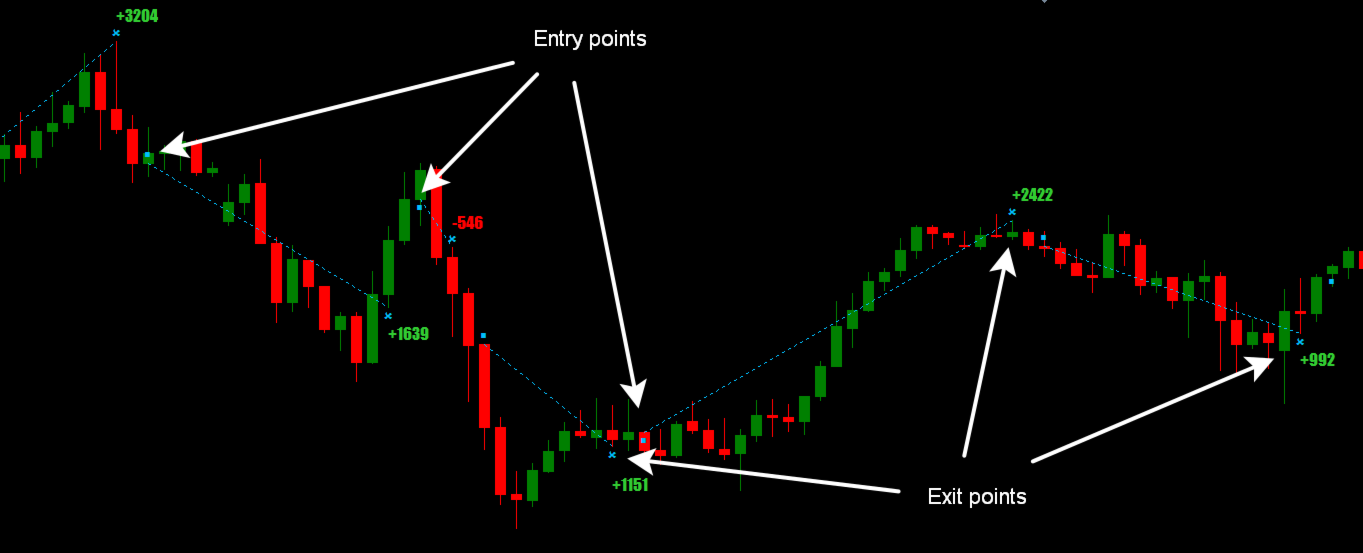
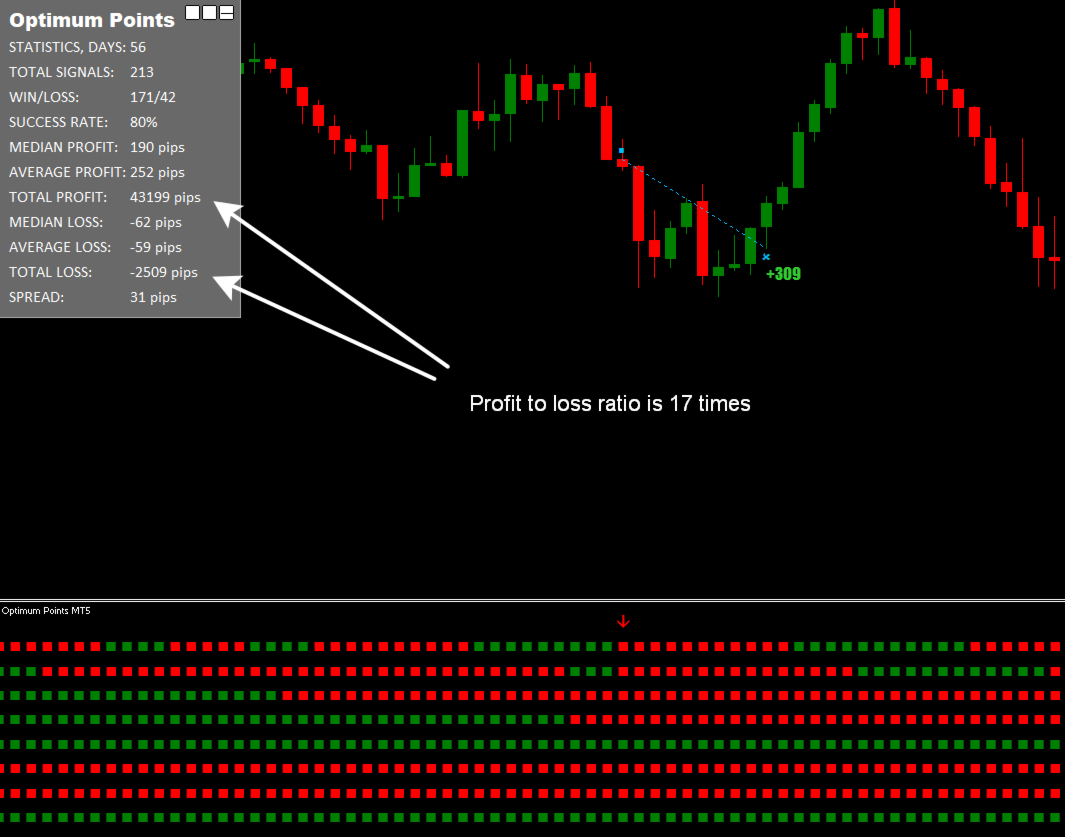
O indicador desenha pontos de entrada e pontos de saída aproximados no gráfico.
Aviso: uma vez que o indicador é multi-timeframe, quando utilizado no testador de estratégias, as cotações para todos os timeframes necessários devem ser descarregadas antecipadamente. Para não esperar por uma longa descarga de cotações no testador, pode colocar a data de início 2025.01.01 e o modelo “Apenas preço de abertura” ou “Pontos de controlo”.
Caraterísticas
- Este indicador não é redesenhado. O que é apresentado no gráfico histórico será apresentado em tempo real.
- Pode ser usado para negociar qualquer ativo: criptomoeda, ações, metais, índices, commodities e moedas.
- Funciona com todos os períodos de tempo.
- Os sinais de entrada aparecem na abertura de uma nova vela e não são redesenhados.
- Os sinais para sair de uma transação são dados provisoriamente, porque muitas vezes é possível fechar uma transação com mais lucro.
- No canto superior esquerdo há um painel detalhado de estatísticas de transação, que pode ser minimizado.
- Utiliza uma fórmula especial para calcular a média móvel, que determina a direção da tendência.
- Para não perder o aparecimento de um sinal para entrar numa transação, pode receber uma notificação na janela Alerta e por Push.
- Para utilizadores de todos os níveis, desde principiantes a especialistas.
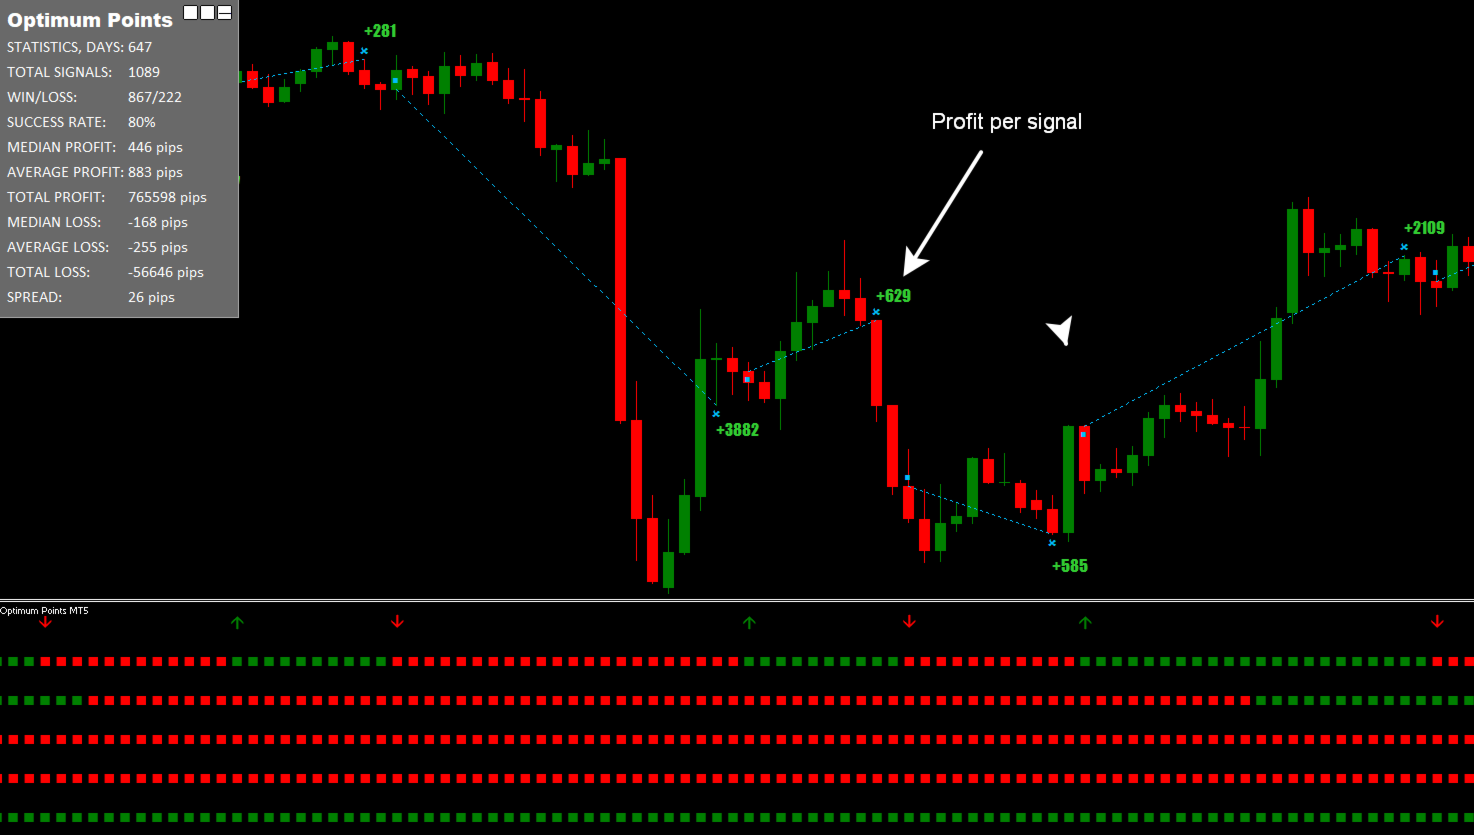
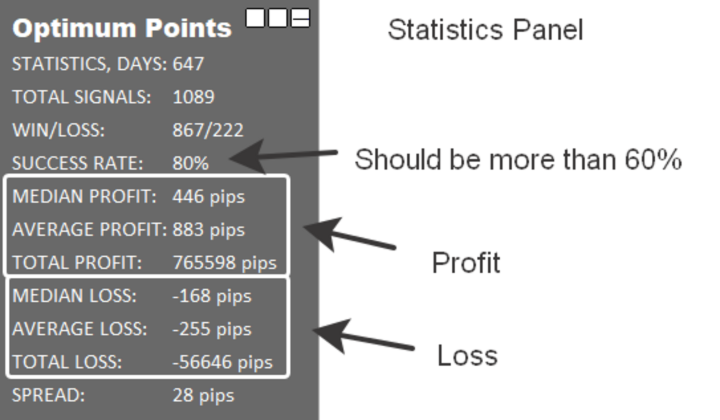
Painel de estatísticas
- O número de dias a partir dos quais o histórico de sinais é obtido.
- Número total de sinais para os quais são fornecidas estatísticas.
- Relação entre o número de sinais rentáveis e não rentáveis.
- Percentagem de sinais lucrativos do número total de sinais.
- Lucro mediano por sinal.
- Lucro médio por sinal.
- Lucro total para todos os sinais.
- Perda mediana por sinal.
- Perda média por sinal.
- Perda total em todos os sinais.
- Spread atual.
Parâmetros de configuração
| Period | sensibilidade do indicador, quanto mais sensível, mais sinais |
| M1-MN1 coincidences | seleção de períodos de tempo, nos quais as setas são desenhadas quando a tendência coincide |
| Font size | tamanho do texto no painel de estatísticas |
| Show entry/exit points | ativar/desativar a apresentação dos pontos de entrada e saída |
| Use alert notification | ativar/desativar a janela pop-up de notificação e a notificação sonora |
| Use push notification | ativar/desativar a notificação push |
Não hesite em enviar-me uma mensagem privada com quaisquer questões ou dificuldades.