Chronolines
- Indicadores
- Carlos Marcelo Cesar Novaes Soleo
- Versão: 1.0
- Ativações: 17
Chronolines – Temporal Support and Resistance Levels for MetaTrader 5
Introduction to Chronolines
Chronolines is a graphical indicator designed to identify and visualize temporal support and resistance levels using the Highs and Lows of four predefined periods. It is compatible with all assets available on MetaTrader 5, including stocks, currencies, commodities, indices, and cryptocurrencies, offering a logical and structured approach to tracking market behavior.
Lines and Periods
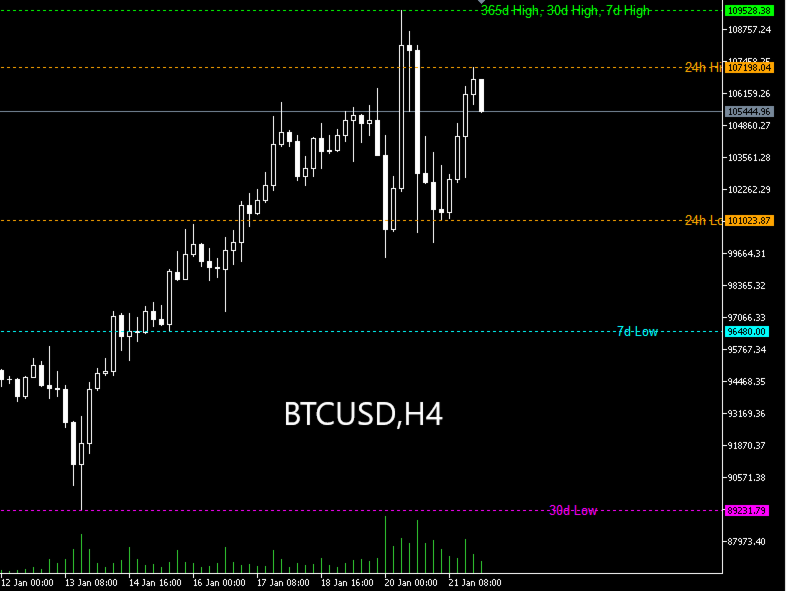
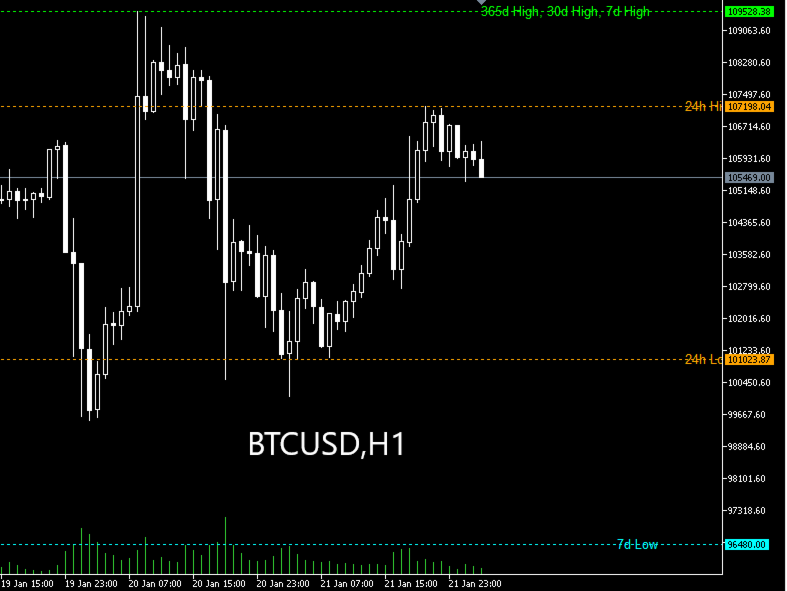
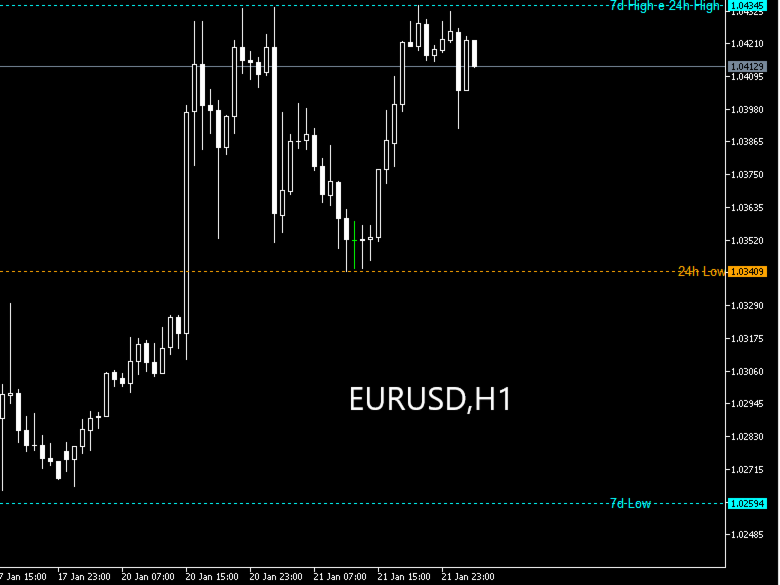
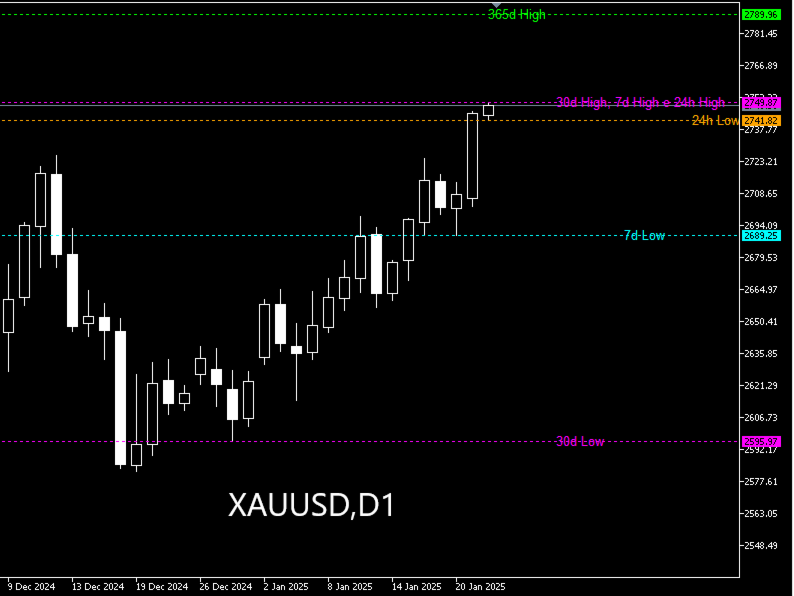
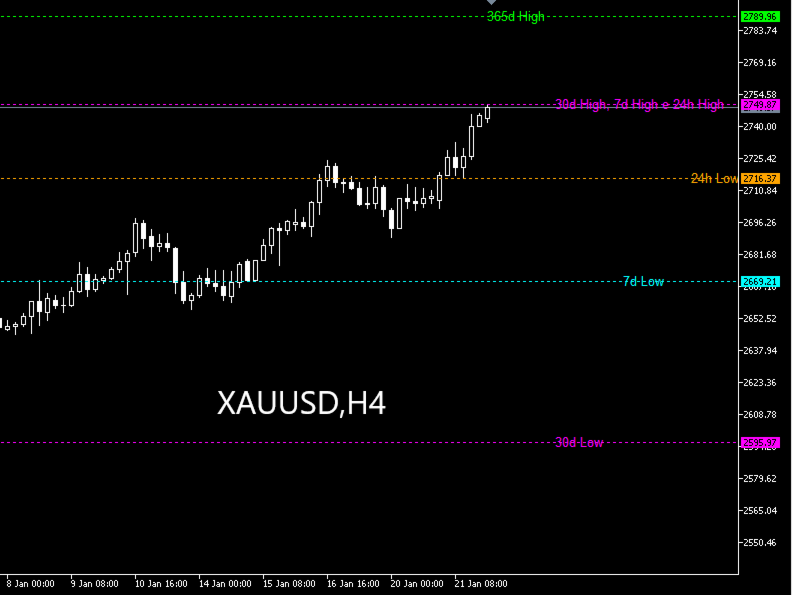
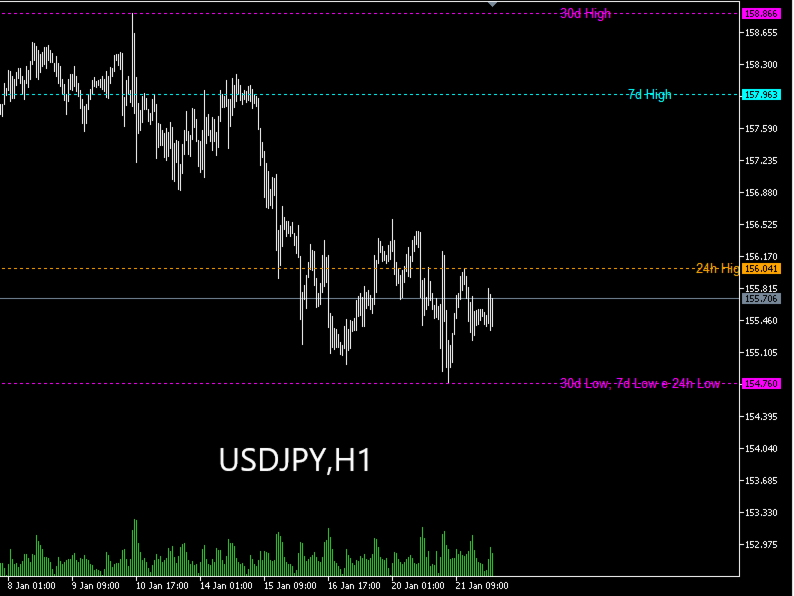
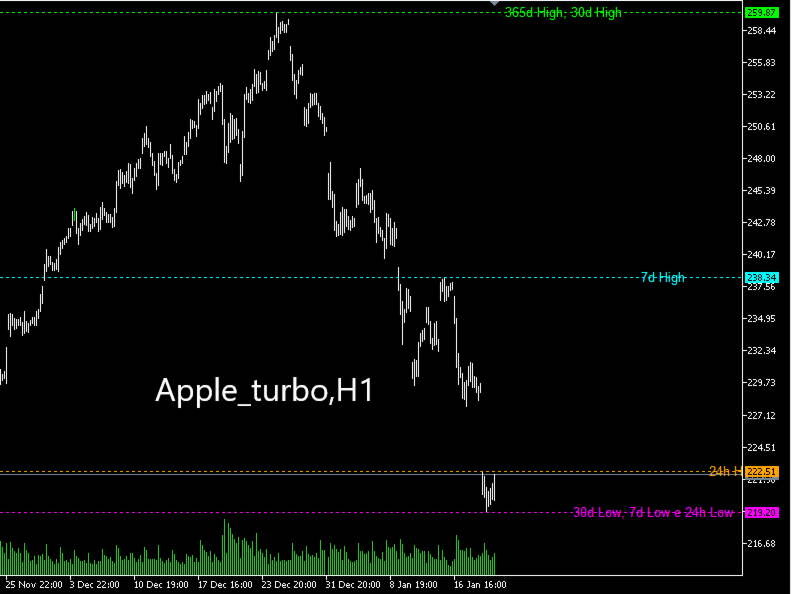
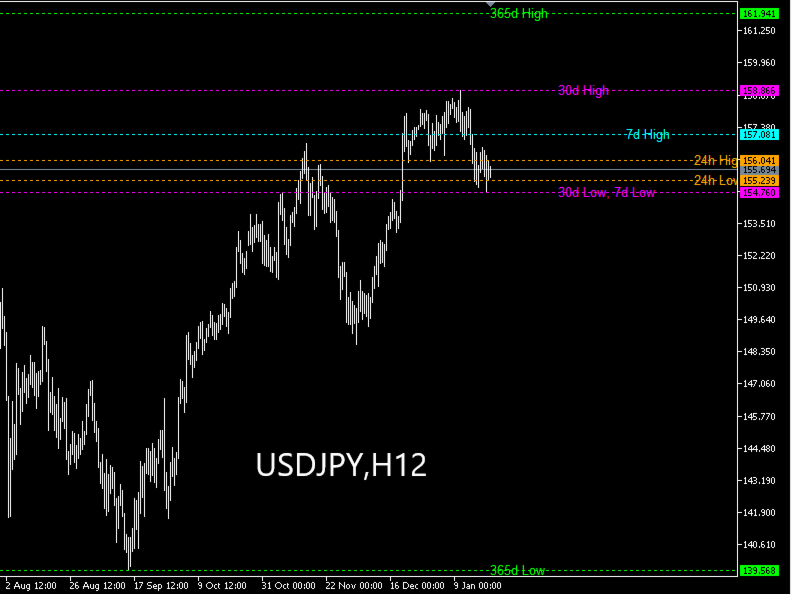
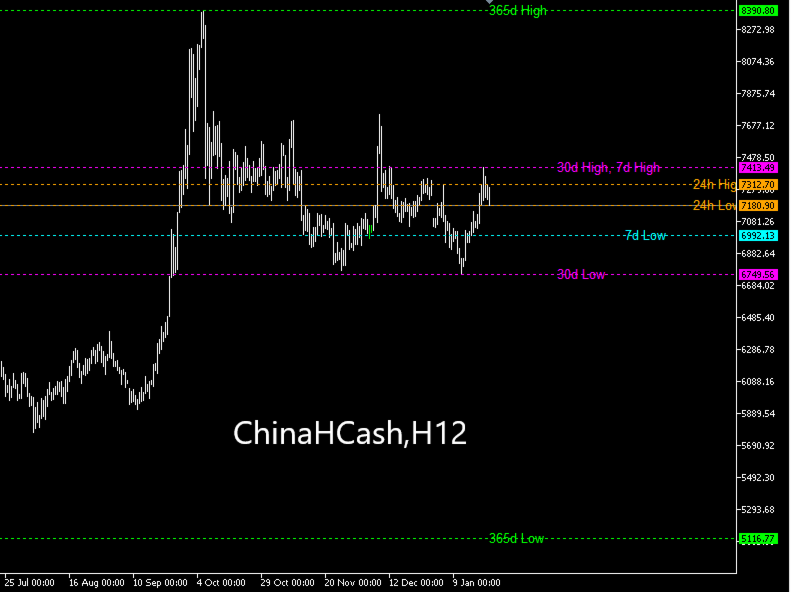
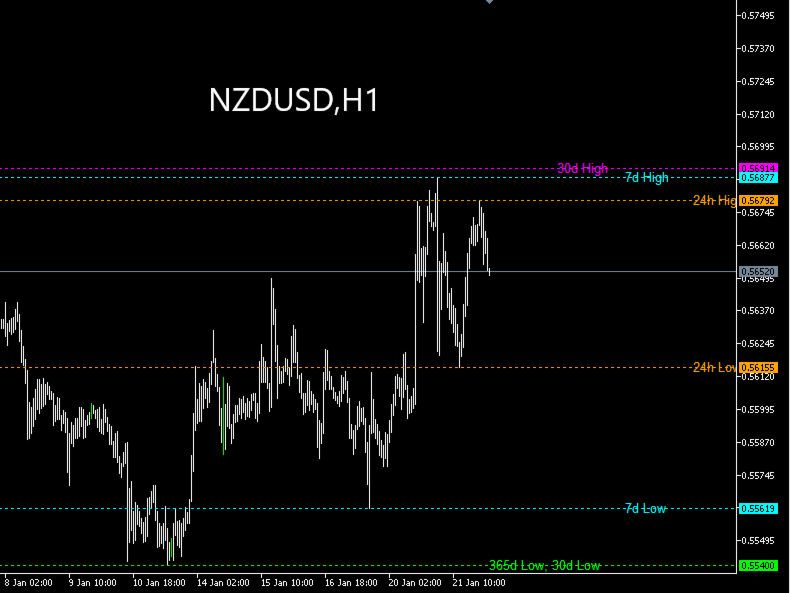
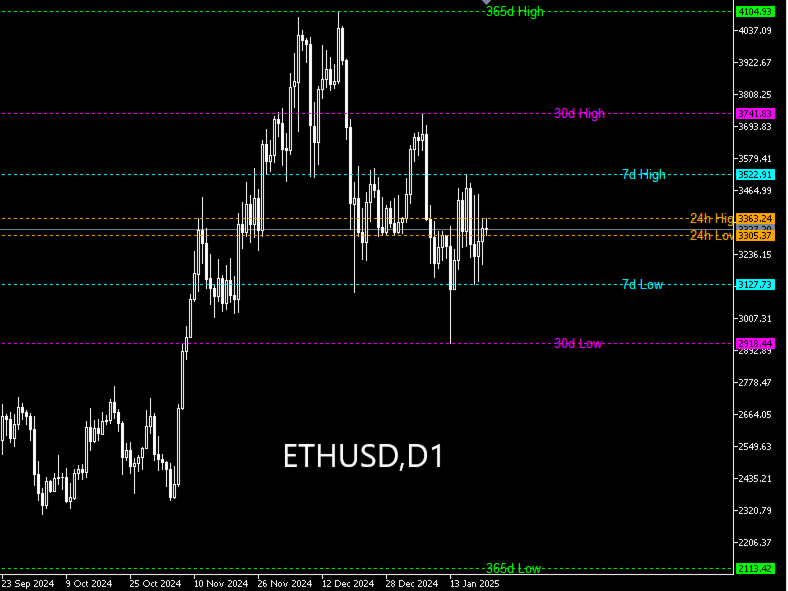
Chronolines plots eight lines on the chart, based on the Highs and Lows of different periods. Each line is represented by a distinct color for clear and easy identification:
- 365 days (High and Low): Green – Long term.
- 30 days (High and Low): Fuchsia – Medium term.
- 7 days (High and Low): Cyan – Short term.
- 24 hours (High and Low): Orange – Ultra-short term.
Dynamic Updates
These levels are automatically updated in elapsed time, reflecting the latest market changes. This ensures that the chart always aligns with current market conditions, providing visual support for decisions based on the most up-to-date information.
Merging Identical Levels
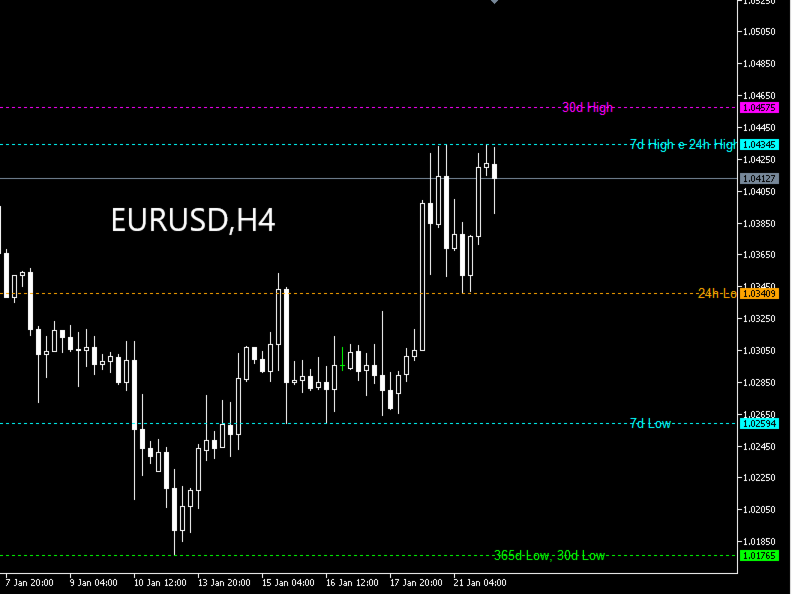
When levels from different periods have the same value (e.g., the 365-day Low matches the 30-day Low), Chronolines combines them into a single label, using the color and emphasis of the longer period. The label will display something like: "365d Low, 30d Low", prioritizing the strategic importance of the longer period while communicating the overlap of data.
Interaction Between Periods
Chronolines highlights the relationships between support and resistance levels across different periods, continuously adjusting to elapsed time. Close proximity between levels can indicate key zones for price rejection or breakout, while significant gaps between periods suggest the emergence of new trends or structural changes in the market.
Interpretation and Practical Use
As you continue to use Chronolines, it becomes a practical tool for achieving a clear overview of the asset's price behavior. It organizes complex data into an accessible visual format, helping you identify patterns and trends that can be used to refine strategies and better understand market movements objectively.
Example of Line Interactions
- If the 24-hour High is close to the 7-day High, it may indicate immediate resistance, suggesting a critical short-term zone.
- A significant gap between the 30-day Low and the 365-day Low may suggest broader price movement, indicating that the market still has room to reach more significant levels.
Simplicity and Versatility
The distinct colors and clear organization make Chronolines accessible to traders of all experience levels. It can be applied to various strategies, from short-term trades to long-term analyses, providing visual support to refine decisions regarding entry and exit points.
Conclusion
Chronolines is a tool designed to simplify the analysis of temporal support and resistance levels, transforming complex data into clear and actionable insights. It helps traders understand market behavior, enabling them to adjust their strategies based on reliable and dynamic information. Get Chronolines now on MQL5 and elevate your technical analysis.
