Market Trend Confluence Detector
- Indicadores
- Conor Mcnamara
- Versão: 1.1
- Atualizado: 16 janeiro 2025
- Ativações: 5
Switching between charts to analyse market trends across multiple timeframes can quickly become a tiresome task.
Finding confluence (alignment across timeframes) is essential to making informed trading decisions. This innovative indicator simplifies the process, allowing you to see trends on multiple lower timeframes directly from a higher timeframe chart. With this indicator, you can monitor four Heiken Ashi setups running simultaneously, each on a different timeframe. The result is a clear, layered view of market trends, helping you identify bullish and bearish confluence without the constant need to switch charts.
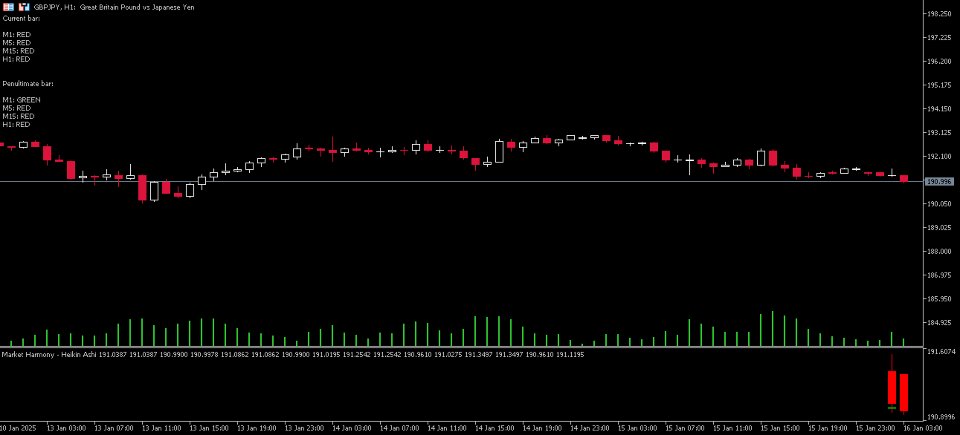
The indicator displays real-time information about the current and penultimate Heiken Ashi bars on all selected timeframes. If all bars show "GREEN" in the information panel, it indicates bullish confluence across those timeframes. Similarly, if all bars show "RED," it signifies bearish confluence. This provides understanding of market alignment at a glance, enabling quicker and more confident decision-making.
Not only does this indicator provide valuable trend information directly on the chart and update it in real time, it also includes alerts for moments of market confluence.
Instead of constantly switching between timeframes in search of the ideal confluence - a process that can quickly become a headache - this indicator keeps you informed with timely alerts, making the process far more efficient.
By eliminating the need for multiple monitors or constant chart-hopping, this tool saves you time and simplifies your trading workflow, making it more efficient and less stressful.
Whether you're refining your analysis or simply looking for a way to streamline your workflow, this multi-timeframe trend confluence detection system is designed to bring clarity and convenience to your trading.
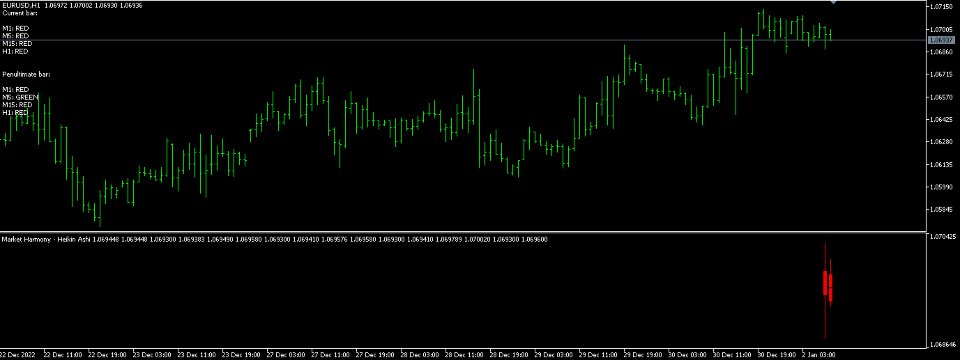
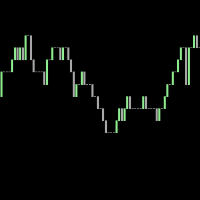
Visually, the indicator displays layered candles in a separate window.
The final candle stack represents the current Heiken Ashi bars for each of the four selected timeframes.
The preceding candle stack corresponds to the Heiken Ashi bars from the penultimate bar (bar directly before the last bar) on each of the timeframes.
Testing Instructions:
This indicator is compatible with the strategy tester.
However, to ensure accurate testing, you must select the highest timeframe in the strategy tester that matches the highest timeframe set in the indicator's inputs.
For example, if the highest timeframe specified in the inputs is H1, you need to select H1 as the testing timeframe in the strategy tester.

