Percentile Twins
- Indicadores
- Manuel Lilienberg
- Versão: 1.0
- Ativações: 7
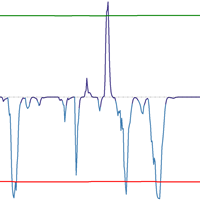
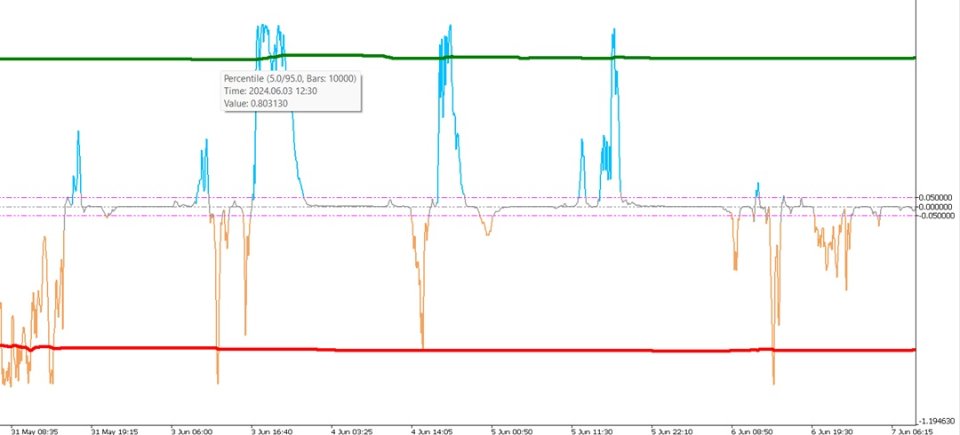
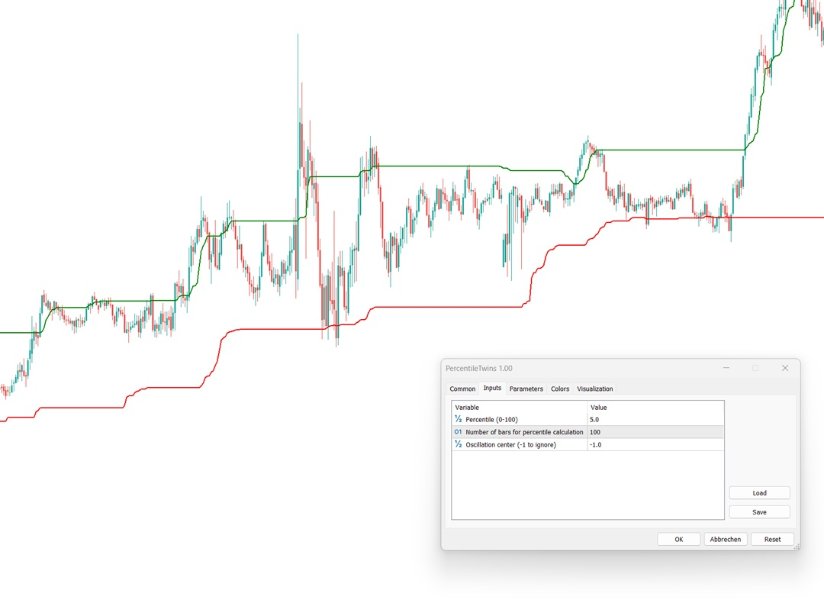
The Percentile Twins Indicator provides a dynamic and adaptive approach to analyzing oscillators and histograms. By calculating and displaying upper and lower percentiles, this tool eliminates the need for fixed thresholds and enables traders to adjust to varying market conditions seamlessly. It’s an essential tool for those looking to build robust strategies across multiple timeframes, symbols, and market environments.
Overview
A common challenge in trading is the reliance on fixed levels for indicators like RSI to define overbought and oversold conditions (e.g., 80/20). These fixed thresholds often work in specific timeframes or market conditions but fail in others, leading to the risk of overfitting. The Percentile Twins Indicator solves this by dynamically adjusting the limits based on the distribution of data.
This approach avoids overfitting and allows strategies to perform consistently across varying conditions, eliminating the need to tweak thresholds for every new timeframe, symbol, or year. Instead, the indicator calculates and adapts the percentiles, providing reliable zones of interest without manual adjustments.
Additionally, users can define the center value of an oscillator, such as 50 for RSI or 0 for indicators like MACD, ensuring the percentiles are calculated relative to the specific oscillator’s structure.
Technical Features
-
Dynamic Percentile Calculation: Automatically calculates upper and lower percentiles based on the underlying data, ensuring accurate and context-aware thresholds.
-
Optimized Algorithm:
- Employs a highly efficient algorithm that avoids sorting for each calculation that is common for percentile or median calculations.
- Handles large datasets with minimal resource usage.
- Ensures real-time performance, even in high-frequency scenarios.
-
Multi-Context Application:
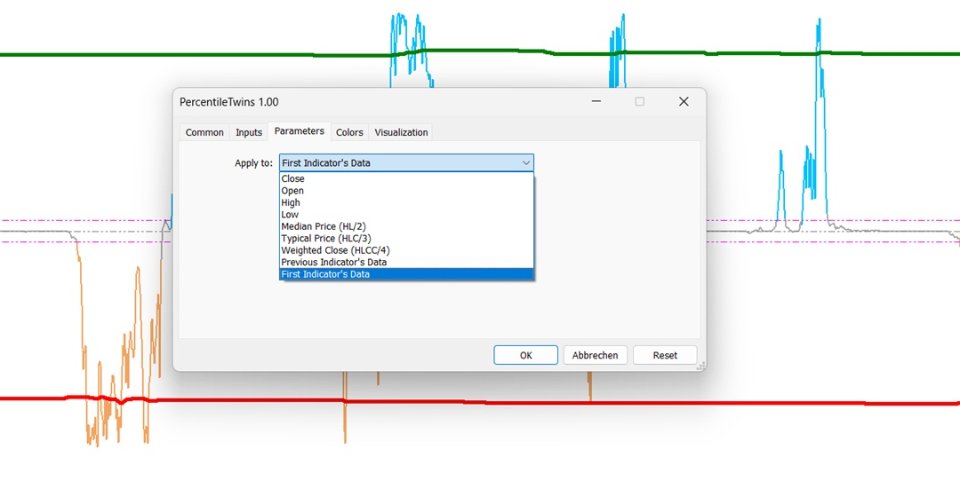
- Oscillators: Enhance indicators like RSI or stochastic by defining adaptive overbought and oversold zones.
- Histograms: Highlight significant shifts and patterns in data distributions.
- Price Charts: Visualize percentile-based channels that dynamically adjust to market conditions.
-
Configurable Parameters:
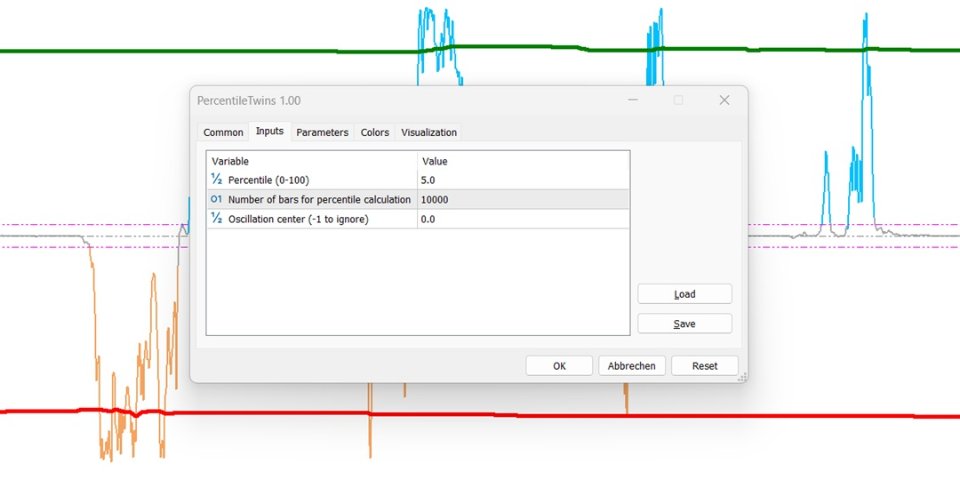
- Allows traders to set upper and lower percentiles (e.g., 95/5, 80/20, or custom values) to suit their specific strategies.
- Enables defining the oscillator center value, such as 50 for RSI or 0 for MACD, for accurate percentile alignment.
Use Cases
1. Adaptive Oscillator Analysis
- Replace fixed thresholds with dynamic percentiles for oscillators like RSI, MACD, or stochastic.
- Identify overbought and oversold conditions more reliably across different timeframes and market conditions.
2. Histogram Insights
- Apply to histograms to visualize areas of extreme deviation and concentration.
- Highlight significant zones in the data distribution for enhanced signal clarity.
3. Channel Visualization on Charts
- Use percentile pairs to create dynamic upper and lower boundaries on price charts.
- Combine with moving averages or other indicators for comprehensive market analysis.
Disclaimer
This indicator is a tool for market analysis and should be used in conjunction with other methods. Trading involves risks, and no single indicator can guarantee success in all market conditions.
