• Visão global
  • Comentários
  • Discussão (4)

Assembler

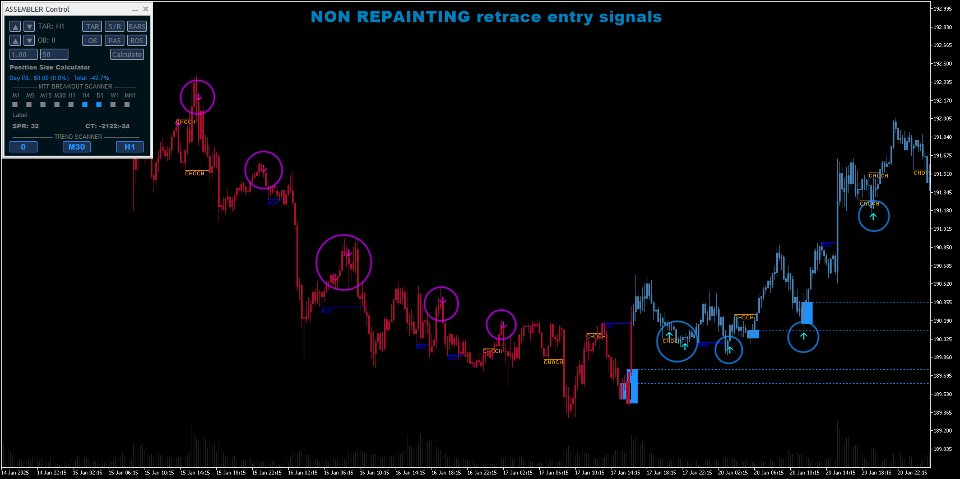
Introducing Assembler:

 The best value for money, Designed for advanced traders and professionals, yet accessible for ambitious beginners ready to elevate their trading game.

. Combining advanced analytics, a sleek graphical interface, and highly customizable features, Assembler empowers you to trade with precision, clarity, and confidence.

Key Features of Assembler

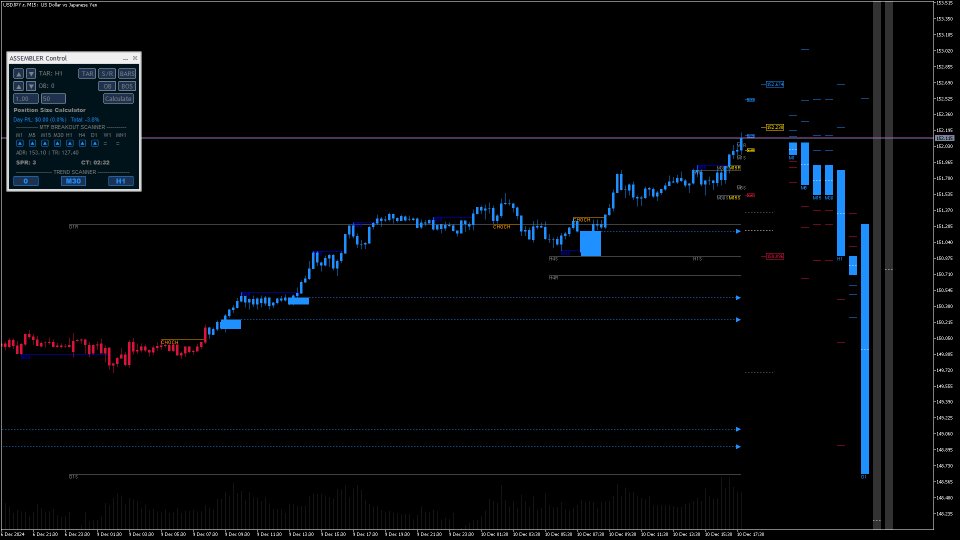
1. Dynamic Graphical User Interface (GUI):

  • A fully draggable, customizable interface that fits seamlessly into your workflow.
  • Toggle key elements such as Order Blocks, Targets, Support & Resistance, Range Bars, and Break of Structure (BOS) with intuitive controls.

2. Advanced Alerts System:

  • Real-time Multi-Timeframe Breakout Alerts for immediate notification of price action across different timeframes.
  • Trend Change Alerts ensure you stay ahead of market reversals, giving you the edge in timing entries and exits.

3. Enhanced Risk Management:

  • Built-in Position Size Calculator to help you manage risk effortlessly.
  • Track daily and total profit/loss directly on the GUI, keeping you aligned with your trading objectives.

4. Multi-Timeframe Breakout Scanner:

  • A scanner with clear, color-coded arrows indicating breakout direction across multiple timeframes.
  • Quickly identify opportunities and detect whether the price is consolidating or breaking out.

5. Average Daily Range (ADR) Insights:

  • Monitor the current range against the ADR to assess market volatility.
  • Stay informed of spread conditions with dynamic coloring that highlights unusual spread widening.

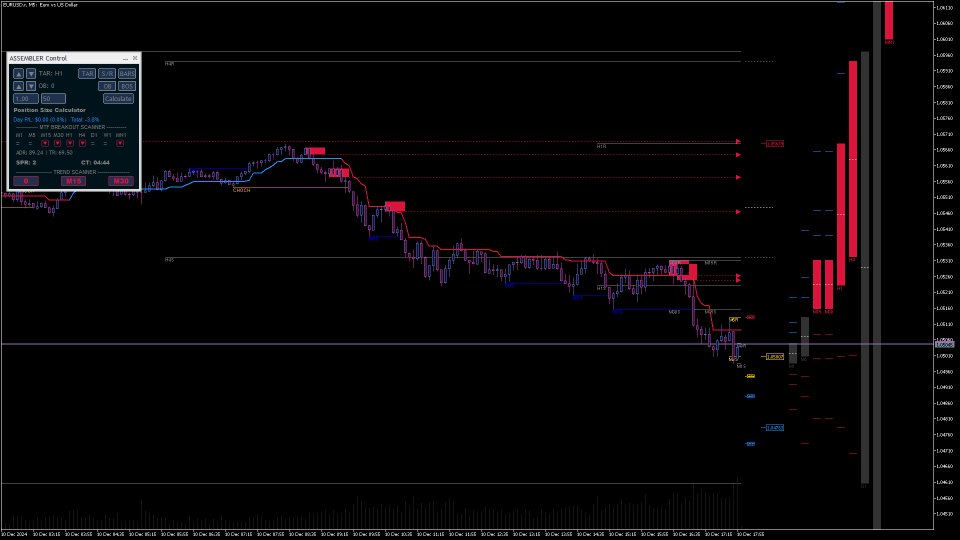
6. Powerful Trend Scanner:

  • Displays trends for three selected timeframes with easy-to-read buttons.
  • Color-coded buttons and backgrounds distinguish between the current trend (text and border in current trend color) and newly confirmed trend changes (button color in new trend)
  • Visualize trends in three modes: Candlestick Coloring, Trend Line, or Bar Coloring for ultimate flexibility.
  • Clicking on a trend scanner buttons cycles through timeframes

7. Smart Chart Elements:

  • Automatically plots Support & Resistance levels, Order Blocks, and Market Structure (BOS and CHOCH) for streamlined analysis.
  • Dynamically adjustable targets plotted near the current candle to guide your trading decisions.

8. Range Bars with Alerts:

  • Innovative Multi-timeframe Range Bars adapt dynamically, turning gray during consolidation and changing colors with breakout direction.
  • Integrated breakout alerts and clearly marked targets help you spot MTF alignment high-probability setups with ease.

9. Additional Market Tools:

  • Key level markers for Yesterday’s High/Low and Today’s Open provide immediate insight into market context.
  • A real-time Candle Timer ensures perfect timing for entries and exits.

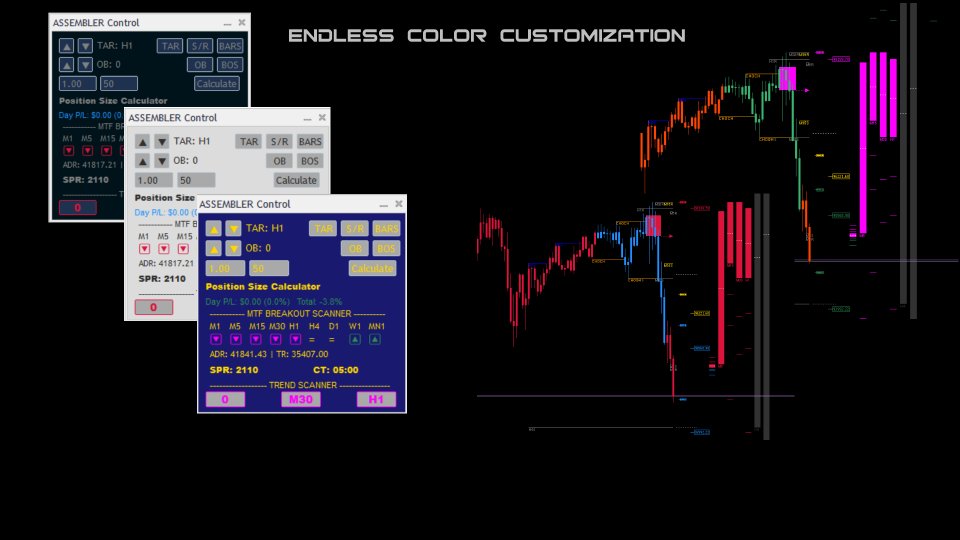
10. Fully Customizable:

  • Tailor the appearance to suit your preferences with adjustable colors, styles, and settings for all chart elements.

Why Choose Assembler?

Assembler isn’t just an indicator—it’s your complete trading assistant. It is designed to:

  • Simplify Complexity: Consolidate all critical tools into one intuitive package
  • Spot Multi-Timeframe Alignments: Effortlessly identify alignments and confluences across timeframes for high-confidence trades.
  • Enhance Decision-Making: Alerts for breakouts and trend changes keep you in tune with market dynamics.
  • Boost Customization: Fully adjustable settings ensure Assembler adapts to your trading style, not the other way around.

Take Your Trading to the Next Level

Assembler’s cutting-edge design and powerful features make it the ultimate tool for spotting high-probability setups and improving your trading accuracy.

With real-time insights, customizable alerts, and intuitive controls, you’ll trade smarter, faster, and more confidently.


----------------------------------------------------------------------------------------------------------------------------------------------------------------------------------------------------

Assembler Indicator User Guide


Welcome to the Assembler Indicator user guide. This manual will help you understand and configure the settings effectively, ensuring you make the most out of this advanced tool.


1. Color Settings


Assembler allows you to customize the colors of various elements such as trend lines, support/resistance, and targets. While not critical to functionality, setting colors to match your personal preferences or charting style can enhance readability and usability.

2. Multi Breakout Alerts

-  Alerts are triggered when breakouts occur across multiple timeframes.

- Settings:

  - Enable/Disable Alerts: Toggle alerts on or off.

  - Minimum Timeframes for Alert: Set how many timeframes must align for an alert.
- Tip: In case of higher timeframe breakouts (e.g., weekly/monthly), increase the number of timeframes monitored to avoid frequent alerts when trading lower timeframes (e.g., 15 or 30 minutes).

---


3. Risk Management Settings


- Default Stop Loss: The initial stop loss in pips, adjustable to suit your strategy.

- Risk Percent: The percentage of your account balance to risk per trade.

- Initial Balance: Used to calculate your daily and total profit/loss. Set this to match your trading account.


4. Trend Settings


- Trend Period: Defines the calculation period for trend plotting.

  - Default (50): Captures intermediate trends.

  - Higher Values (e.g., 100): Smooth out market noise and focus on major trends.

- ATR Period: Determines the Average True Range used in trend calculations. This value affects sensitivity.

- Display Style: Choose between:

  - Automatic: Adapts plotting style to your chart type (bars, candlestick, line).

  - Manual: Set your preferred plotting style.

The first button in trend scanner will plot arrow on chart and trigger alert on confirmed trend change.


---


5. Order Blocks


- Block Extension: Number of candles the order block rectangle extends.

- Extend to Current Bar: Enable to extend blocks to the current candle, creating wider like  support/resistance zones.

- Draw Lines to Current Time: Toggle to draw lines from order blocks to the current time.

- Candles to Use for Calculation: Defines the historical scope for calculating impact on order blocks and market structure . Lower values reduce resource usage.


---


 6. Market Structure (BOS/CHOCH)


- Break of Structure (BOS) and Change of Character (CHOCH) lines can be customized:

  - Colors: Set the color for each line type.

  - Line Style: Choose between solid, dashed, or dotted lines.


 7. Reference Lines

  Yesterday High/Low and Today Open Lines:

  - Customize their colors position and styles for better visibility.


8. Fractal Calculations


- Fractal Sensitivity: Adjust the number of candles used on each side of the fractal.

- Auto Fractal Candles: Automatically sets fractal sensitivity based on the current timeframe.

- Candle Close Outside Range: Choose whether market structure is determined by candle close or high/low extremes.


9. Lower Timeframe Display


- Show Lower Timeframes: Toggle the visibility of ranges from timeframes lower than the current one.

- Impact: Affects range bar display on the right side of chart;


10. Spread Sensitivity


- Spread Sensitivity: Adjusts the threshold for identifying unusual spread widening.

- Visual Feedback: When spreads exceed the sensitivity level, they are highlighted in red, alerting you to potential volatility or illiquidity.


Tips for Optimal Use


1. Customization: Take advantage of the highly customizable settings to align the indicator with your trading style.

2. Alerts: Configure breakout and trend alerts to avoid unnecessary distractions while staying informed about critical market events.

3. Performance: Balance functionality and resource efficiency by adjusting settings such as candles for order block calculation and fractal sensitivity.


Assembler is a versatile, professional-grade tool that can empower traders at all levels. Use this guide to fine-tune its settings and elevate your market analysis to new heights!


How to Interpret On-Chart Elements

  1. Trend Representation:
    The trend is displayed in three ways depending on initial settings:

    • Candle Colors: Candlesticks are colored based on the trend direction.
    • Bar Colors: Bars are shaded to reflect the trend.
    • ATR Line: A plotted ATR-based trend line in the trend color.
  2. Support and Resistance:
    Horizontal gray lines represent fractal-based support and resistance levels for each timeframe, labeled accordingly.

  3. Targets:

    • Price Labels: Targets are shown as price labels . Smaller price labels represent the current timeframe, while larger price labels are for higher timeframes. The red labels next to support/resistance lines indicate targets that can also be used to set stop-loss levels.
    • Dynamic Adjustments: Targets adjust direction if the price crosses the midpoint of the range, preparing for a potential breakout.
    • Target Probabilities:
      • Target 1 (T1): 50% of the range, with the highest probability of being hit.
      • Target 2 (T2): 100% of the range Also likely but may involve a retracement to the original range before being reached.
      • Target 3 (T3): Useful for news events or sudden breakouts after a narrow range.
    • Timeframe Adjustment: Use the arrow buttons next to the TAR label on the UI to change the timeframe for displayed larger targets.
  4. Maximizing Probability:
    Look for confluence between targets from different timeframes or alignment with other key elements, such as order blocks, today’s open, moving averages, or pivots. This is easily identified using the range bar targets on the right side of the chart.

This concise guide will help users interpret and utilize the on-chart elements effectively.

Tips:

  1. If the button does not register a mouse click, try moving the GUI to a location where there are no objects (e.g., trendlines, rectangles, etc.) behind it. This helps ensure that the button receives the click event properly.

  2. Market Entry Timing: Market entries on new trends have a greater potential for higher profit compared to entries near the end of trends. Identifying and entering the market at the beginning of a new trend can maximize profit opportunities.

  3. For Intraday trading use H1 and h4 targets in confluence with lower timeframes. 


Produtos recomendados
Get ALERTS for break of your TRENDLINES, SUPPORT LINES, RESISTANCE LINE, ANY LINE!! 1. Draw a line on the chart (Trend, support, resistance, whatever you like) and give it a name (e.g. MY EURUSD line) 2. Load the Indicator and input the Line Name the same name in Indicator INPUT so system knows the name of your line (= MY EURUSD line) 3. Get Alerts when Price breaks the line and closes Works on All Time frames and charts LEAVE A COMMENT AND IF THERE IS ENOUGH INTEREST I WILL WRITE AN EA WHICH
FREE
Pivot Point Supertrend (corresponds to Pivot Point Super Trend indicator from Trading View) Pivot Point Period:    Pivot point defined as highest high and highest low... input 2 = defining highest high and highest low with 2 bars on each side which are lower (for highest high) and are higher (for lowest low calculation) ATR Length  : the  ATR  calculation is based on 10 periods ATR Factor: ATR multiplied by 3
FREE
Narrow Range Timeframe
Ricardo Rodrigues Lucca
4.5 (2)
Esse indicador utiliza o conceito NR7. Esse conceito diz que se a setima vela for a de menor range, isto é, menor diferença entre máxima e mínima de todas as 7 velas. O indicador marca essa vela com dois marcadores e fica aguardando o rompimento do range composto das 7 velas, isto é, a maior máxima entre as 7 velas anteriores e menor mínima entre as 7 velas anteriores. O indicador é chamado "Timeframe" porque digamos que tenhamos uma sessão de negociação que dura 9 horas, e temos a terceira vela
FREE
Volatility Doctor
Gamuchirai Zororo Ndawana
4.5 (2)
Doctor Volatility - Seu Consultor Especialista para Dominar os Ritmos do Mercado! Você está pronto para desbloquear o poder da negociação de precisão? Conheça o Doctor Volatility, seu companheiro confiável no mundo dinâmico dos mercados de câmbio. Este consultor especialista em várias moedas não é apenas uma ferramenta de negociação; é um maestro de sinfonia, guiando seus investimentos com uma precisão incomparável. Descubra as principais características: 1. Especialização em busca de ten
FREE
3 candel indicator in 1 !!! The 3 most important candel indicator in 1 packadge. Help trader in chart visualisation, prevent reversal !!! Doji : Gravestone Doji, Long Legged Doji, Dragonfly Doji. Engulfing : Bullish, Bearish. Hammer : red hammer, green hammer. Fully parametrable indicator icon color config and alarm. Free life time update !!! Just try our demo for free.
A useful dashboard that shows the RSI values for multiple symbols and Time-frames. It can be easily hidden/displayed with a simple click on the X top left of the dashboard. You can input upper and lower RSI values and the colours can be set to show when above/below these values. The default values are 70 and 30. You can choose whether the dashboard is displayed on the right or left of the chart. If you want to have 2 dashboards on the same chart you must input a different name for each. The sca
FREE
SMC Structure Markup
Seyed Mohammad Hosseini Hejazi
5 (1)
Overview The Smart Money Structure Markup Indicator for MetaTrader 5 is a powerful tool designed to help traders identify key market structures based on popular Smart Money Concepts (SMC) strategies. This indicator detects micro-market structures, providing insights into price movements and potential trend changes. It highlights important elements such as valid Break of Structure (BOS), Change of Character (CHoCH), and Inducement (IDM), helping traders to make informed decisions. Key Features Ma
FREE
FX Market Correlation indicator calculates the weakness/strength from all 28 currency pairs in the market. This is unique and powerful way of watching the market. It works on all timeframes. You can use it for scalping, or you can use it for long term trading. FX Market Correlation indicator is NOT repainting. Features: --------- -easy determine which currency is strengthening and which is weakening -choose best currency pairs to trade and times to trade them -find correlation between pairs -N
The indicator scans for TD Sequential signals in multiple timeframes for the all markets filtered and shows the results on Dashboard. Key Features Dashboard can be used for all markets It can scan for signals on MN1, W1, D1, H4, H1, M30, M15 ,M5, M1 timeframes Parameters UseMarketWatch: Set true to copy all symbols available in market watch MarketWatchCount : Set the number of symbols that you want to copy from the market watch list. CustomSymbols: Enter the custom symbols that you want to be a
Novato
Juan Manuel Rojas Perez
5 (1)
Descubre el poderoso aliado que te guiará en el laberinto de los mercados financieros. Este indicador revolucionario te llevará de la incertidumbre a la claridad, permitiéndote identificar con precisión los puntos de inflexión del mercado. Mejora tus decisiones de entrada y salida, optimiza tus operaciones y ¡multiplica tus ganancias con confianza. ¡Para más información, te invitamos a unirte a nuestro canal de Telegram en https://t.me/Profit_Evolution  ¡Allí encontrarás contenido exclusivo, a
FREE
Novato alertas
Juan Manuel Rojas Perez
4.75 (4)
Descubre el poderoso aliado que te guiará en el laberinto de los mercados financieros. Este indicador revolucionario te llevará de la incertidumbre a la claridad, permitiéndote identificar con precisión los puntos de inflexión del mercado. Mejora tus decisiones de entrada y salida, optimiza tus operaciones y ¡multiplica tus ganancias con confianza. Ahora con alertas en tu pc o móvil ¡Para más información, te invitamos a unirte a nuestro canal de Telegram en   https://t.me/Profit_Evolution  ¡
FREE
QuantumAlert Stoch Navigator is a free indicator available for MT4/MT5 platforms, its work is to provide "alerts" when the market is inside "overbought and oversold" regions in the form of "buy or sell" signals. This indicator comes with many customization options mentioned in the parameter section below, user can customise these parameters as needful. Join our   MQL5 group , where we share important news and updates. You are also welcome to join our private channel as well, contact me for the p
FREE
QuantumAlert RSI Navigator is a free indicator available for MT4/MT5 platforms, its work is to provide "alerts" when the market is inside "overbought and oversold" regions in the form of "buy or sell" signals. This indicator comes with many customization options mentioned in the parameter section below, user can customise these parameters as needful. Join our MQL5 group , where we share important news and updates. You are also welcome to join our private channel as well, contact me for the priva
FREE
Trade like a pro and never miss Break or Bounce of a Support or Resistence Line Get alert  and suggested Trading points (entry, TP1, TP2 and SL) whenever there is a break of - Break or Bounce from Pivot Point Support or Resistence - Break or Bounce from a Trendline (upper and lower Trendline) - High and Low of a previous period Any suggestion on other types of Support / Resistence to add are more than welcome
The selective pin bar is designed to identify reversals. To use the selective pin bar effectively, traders typically look for Strong Rejection: The tail of the pin bar should extend significantly beyond the surrounding price action. It indicates that there was a sharp rejection of higher or lower prices during the trading period. A strong rejection suggests that the market sentiment may be changing.
FREE
In the context of trading, Malaysia SNR (Support and Resistance) refers to the technical analysis of support and resistance levels in financial markets, particularly for stocks, indices, or other assets traded. This is single timeframe version. Multiple timeframe version is avaiable here . There are three type of Malaysia SNR level Classic , GAP and Flipped 1. Classic Support is the price level at which an asset tends to stop falling and may start to rebound. It acts as a "floor" where demand is
Mayari MT5
Jose Lagayan
Introducing the MAYARI MT5: The Trend Indicator Expert Advisor *Set Files for EURUSD available on the Comments Section *RESULTS SHOWN HERE ARE NOT OVER OPTIMIZED UNLIKE OTHER BOTS THE IS FOR SALE! ONLY REALISTIC RESULTS! *The default settings of MAYARI MT5 are optimized for EURUSD, based on rigorous back-testing over a 4-year period. For safe and effective operation, it's recommended to use the default settings with an account balance of at least $1,000 USD. Embark on a journey where technology
CAP Gold Albatross EA MT5
MEETALGO LLC
2.62 (13)
MeetAlgo Gold Albatross EA MT4  is a pure mathematical scalper that trades tick data aggressively. It implements a simple and universal trading strategy which can be applied to any instrument. Key Advantages Fully automated trading 24/5. No need in a large initial deposit. Always uses Stop Loss to protect capital. Position trailing stop is used. Both a fixed lot and a free margin percentage are used. Ability to set time limitations for the EA operation. Trading Requirements Caution is advis
FREE
My Candle Patterns
Francisco Gomes Da Silva
5 (1)
Este indicador é uma versão demo do My candle completo que pode ser baixado aqui: Candle Patterns Creator com a versão completa você pode criar suas próprias regras de candle além de pode modificar um padrão de candle tradicional para ficar mais assertivo de acordo com sua estratégia No indicador tem varias regras de candles de exemplo, mas aqui vou demostrar apenas algumas: Pattern Rule Candle Green C > O Candle Red C < O Doji C = O Hammer (C > O and (C-O) *2 < O-L and (C-O) *0.5 > H-C) o
FREE
Free for now, price is going to be 30 USD at Jan 1. 2025. Features: Pin Bar Detection : The indicator is designed to identify bullish and bearish pin bars based on specific criteria, including the relative size of the candle’s body and shadow, as well as the position of the candle's body in relation to the 38.2% Fibonacci level. Customizable Labels : Custom text is displayed above each identified bullish or bearish pin bar, such as "[38.2]" for bullish and "[-38.2]" for bearish, helping trader
FREE
SparkLight EA MT5
Radek Reznicek
3 (2)
SparkLight EA  is a fully automated expert advisor that uses advanced algorithms for the price analysis of the latest trends. Every order has StopLoss and every order is placed based on the primary or the secondary trend analysis algorithm. This EA does  NOT use  Martingale or Arbitrage strategy. It can trade more orders at the same time but every order has the same Lot size if using FixedLotSize. SparkLight EA is  NOT  a minute scalper or tick scalper that produces high number of trades per da
FREE
Determining the current market trend is a key task for successful trading. It is for this purpose that the Book Scheme indicator was developed, which is an advanced algorithm for visually displaying a trend on a chart. Many traders dreamed of having reliable moving averages that kept up with the market. It was this dream that I turned into reality with the help of my indicator. Book Scheme allows you to predict future values ​​and create accurate signals for entering and exiting the market.
RSI Scanner Sheet Pro
Arkadii Zagorulko
1 (1)
The RSI (Relative Strength Index) scanner is a powerful technical analysis tool designed to help traders and investors identify potential trading opportunities in the forex, stocks, and cryptocurrency markets. RSI is a popular momentum oscillator that measures the speed and change of price movements and helps determine overbought or oversold conditions in an asset. The scanner takes advantage of this indicator to streamline the process of finding trading signals and opportunities. The RSI value
FREE
Projected Volume
Fernando Lahude Ritter
O Indicador de Projeção de Volume é uma ferramenta especializada projetada para traders que se concentram na relação entre o volume e a ação do preço. Este indicador intuitivo projeta o volume esperado para a vela em andamento, auxiliando na tomada de decisão durante as condições de mercado ao vivo. O indicador apresenta os dados de volume em formato de histograma diretamente no gráfico para uma análise rápida. Características: Representação de Volume Altista : Cada barra verde no histograma rep
FREE
Note from Developer: This is the lite version of the Double TMA with Bands Indicator. I will be uploading a paid version that comes with alerts and on screen signal arrows built in. I will also be selling an EA based on this trading system once all backtesting and optimization have been completed. Unlock your trading potential with the Double TMA Indicator with Reversal Detection! Designed for swing and reversal trading, this versatile tool integrates two Triangular Moving Averages
FREE
The indicator is designed to close positions on the market in time. For example: to take profits ahead of schedule if the price has not reached TakeProfit, and the market is turning around. The indicator analyzes the momentum, not the trend. He does not give any information about the trend. The indicator is well suited for finding divergence. The Ershov 38 Parrots indicator dynamically adjusts to the market and detects price movement impulses of medium and high amplitude. It almost does not rea
JPY Vision MT5
Daniel Barbosa De Lima
5 (1)
Atention:  This expert is free! You can run for a while, check the quality of my work and comeback for my other EAs. I have posted some and there are several being developed. Stay tuned! JPY Vision MT5   is the result of many hours of testing and validation wich works with several indicators such as Awesome Oscillator, Bears Power and Bulls Power. It is an expert advisor that demonstrates consistency and long-lasting results over the long term. Check the backtest in the images. Advantages of the
FREE
Survivor
Pavel Nikiforov
Название советника : Survivor  (есть расширенная версия: https://www.mql5.com/ru/market/product/36530 ) Валютные пары : USDJPY, EURUSD, GBPUSD, AUDUSD, GBPJPY, XAUUSD, EURCHF Рекомендованная валютная пара : USDJPY Таймфрейм : М5 Время торговли : круглосуточно Описание : Трендовый  советник с возможностью мартингейла и построением сетки ордеров. В советнике используются три группы аналогичных сигналов для открытия, закрытия и дополнительных сделок. При наличии тренда(определяется МА) ловится отс
FREE
Fair Value Gap Scanner
Usiola Oluwadamilol Olagundoye
The Fair Value Gap Detector is a MetaTrader 5 indicator designed to identify and draw rectangles on the chart wherever fair value gaps (FVGs) are detected. Fair value gaps occur when there is a significant disparity between the current price and the fair value of an asset. These gaps can provide valuable insights into potential trading opportunities, as they often indicate overbought or oversold conditions in the market. Key Features: FVG Detection: The indicator utilizes a proprietary algorith
FREE
YOU CAN NOW DOWNLOAD FREE VERSIONS OF OUR PAID INDICATORS . IT'S OUR WAY OF GIVING BACK TO THE COMMUNITY ! >>>    GO HERE TO DOWNLOAD This system is an Heiken Ashi system based on RSI calculations . The system is a free open source script originally published on TradingView by JayRogers . We have taken the liberty of converting the pine script to Mq4 indicator . We have also added a new feature which enables to filter signals and reduces noise on the arrow signals. Background HEIKEN ASHI
FREE
Os compradores deste produto também adquirem
TPSproTREND PrO MT5
Roman Podpora
4.54 (13)
TPSpro TREND PRO  - is a trend indicator that automatically analyzes the market and provides information about the trend and each of its changes, as well as giving signals for entering trades without redrawing! The indicator uses each candle, analyzing them separately. referring to different impulses - up or down impulse. Exact entry points into transactions for currencies, crypto, metals, stocks, indices!  INSTRUCTIONS     RUS   -    ENG              R ecommended to use with an indicator   - 
TPSpro RFI Levels MT5
Roman Podpora
4.67 (15)
INSTRUÇÕES         Russo   -        ENG       R   ecomendado para uso com um indicador       -       TPSpro   TREND PRO -   Versão MT4         Um elemento-chave na negociação são as zonas ou níveis a partir dos quais as decisões de comprar ou vender um instrumento de negociação são tomadas. Apesar das tentativas dos principais participantes de esconder sua presença no mercado, eles inevitavelmente deixam rastros. Nossa tarefa era aprender como identificar esses rastros e interpretá-los corretame
Agora US $ 147 (aumentando para US $ 499 após algumas atualizações) - Contas ilimitadas (PCs ou Macs) Manual do usuário do RelicusRoad + vídeos de treinamento + acesso ao grupo de discórdia privado + status VIP UMA NOVA FORMA DE OLHAR PARA O MERCADO O RelicusRoad é o indicador de negociação mais poderoso do mundo para forex, futuros, criptomoedas, ações e índices, oferecendo aos traders todas as informações e ferramentas necessárias para se manterem rentáveis. Fornecemos análises técnica
Este painel mostra os últimos   padrões harmónicos   disponíveis para os símbolos seleccionados, pelo que poupará tempo e será mais eficiente /   versão MT4 . Indicador gratuito:   Basic Harmonic Pattern Colunas do indicador Symbol :   aparecem os símbolos seleccionados Trend :   de alta ou de baixa Pattern :   tipo de padrão (gartley, borboleta, morcego, caranguejo, tubarão, cifra ou ABCD) Entry :   preço de entrada SL:   preço de paragem de perda TP1:   preço do 1º take profit TP2:   preç
Golden Trend Indicator MT5
Noha Mohamed Fathy Younes Badr
4.8 (10)
Golden Trend indicator  is The best indicator for predicting trend movement this indicator never lags and never repaints and never back paints    and give  arrow buy and sell    before the candle appear  and it will help you and  will make your trading decisions clearer its work on all currencies and  gold and crypto and all time frame This unique  indicator uses very secret algorithms to catch the  trends, so you can trade using this indicator and see the trend clear on charts  manual guide and
FX Power MT5 NG
Daniel Stein
5 (7)
Desbloquear todo o poder do FX Power NG: o derradeiro medidor de força da moeda Durante mais de oito anos, o FX Power capacitou os operadores de todo o mundo com uma análise fiável e precisa da força da moeda. Agora, o FX Power NG leva esta ferramenta de confiança para o próximo nível, oferecendo funcionalidades avançadas que proporcionam uma precisão, personalização e conhecimentos inigualáveis à sua negociação. O que faz do FX Power NG uma ferramenta indispensável para os operadores sérios
Atomic Analyst MT5
Issam Kassas
4.32 (19)
Primeiramente, vale ressaltar que este Indicador de Negociação não repinta, não redesenha e não apresenta atrasos, tornando-o ideal tanto para negociação manual quanto automatizada. Manual do utilizador: configurações, entradas e estratégia. O Analista Atômico é um Indicador de Ação de Preço PA que utiliza a força e o momentum do preço para encontrar uma vantagem melhor no mercado. Equipado com filtros avançados que ajudam a remover ruídos e sinais falsos, e aumentam o potencial de negociação.
FX Volume MT5
Daniel Stein
4.93 (14)
Ganhe uma verdadeira vantagem no Forex com o Volume FX: O melhor indicador de volume O FX Volume é o primeiro e único indicador de volume a revelar o sentimento genuíno do mercado a partir de uma perspetiva interna. Ao fornecer informações exclusivas sobre como os participantes do mercado institucional e os corretores estão posicionados, o FX Volume permite que você negocie com a previsão geralmente reservada para os principais participantes. Diga adeus aos atrasos dos relatórios COT - o FX Vo
Quantum TrendPulse
Bogdan Ion Puscasu
5 (4)
Apresentando   Quantum TrendPulse   , a ferramenta de negociação definitiva que combina o poder do   SuperTrend   ,   RSI   e   Stochastic   em um indicador abrangente para maximizar seu potencial de negociação. Projetado para traders que buscam precisão e eficiência, este indicador ajuda você a identificar tendências de mercado, mudanças de momentum e pontos de entrada e saída ideais com confiança. Principais características: Integração SuperTrend:   siga facilmente a tendência predominante do
Primeiramente, vale ressaltar que este Sistema de Trading é um Indicador Não Repintado, Não Redesenho e Não Atrasado, o que o torna ideal tanto para o trading manual quanto para o automatizado. Curso online, manual e download de predefinições. O "Sistema de Trading Inteligente MT5" é uma solução completa de trading projetada para traders novos e experientes. Ele combina mais de 10 indicadores premium e apresenta mais de 7 estratégias de trading robustas, tornando-o uma escolha versátil para dive
TPA True Price Action indicator reveals the true price action of the market makers through 100% non-repainting signals strictly at the close of a candle! TPA shows entries and re-entries, every time the bulls are definitely stronger than the bears and vice versa. Not to confuse with red/green candles. The shift of power gets confirmed at the earliest stage and is ONE exit strategy of several. There are available now two free parts of the TPA User Guide for our customers. The first "The Basics"
Descubra os níveis de FX: O seu melhor indicador de suporte e resistência para o sucesso da negociação O FX Levels é mais do que apenas um indicador de suporte e resistência; é um divisor de águas para traders sérios que desejam precisão, confiabilidade e funcionalidade contínua em todos os símbolos de negociação - sejam pares de moedas, índices, ações ou commodities. Construído com base no comprovado método Lighthouse e aprimorado com adaptabilidade dinâmica e em tempo real, o FX Levels traz
Trend Forecaster
Alexey Minkov
5 (6)
!!!CHRISTMAS SALE!!! The Trend Forecaster indicator utilizes a unique proprietary algorithm to determine entry points for a breakout trading strategy. The indicator identifies price clusters, analyzes price movement near levels, and provides a signal when the price breaks through a level. The Trend Forecaster indicator is suitable for all financial assets, including currencies (Forex), metals, stocks, indices, and cryptocurrencies. You can also adjust the indicator to work on any time frames, al
FX Dynamic - O único indicador ATR de que você sempre precisará Pronto para turbinar suas estratégias de negociação com precisão e perceção incomparáveis? Conheça o FX Dynamic , o primeiro e único indicador ATR projetado para análise baseada em moeda e o ajuste automático para mudanças de GMT dos corretores . Diga adeus às ferramentas ultrapassadas e abrace a solução definitiva para dominar a volatilidade do mercado. Por que o FX Dynamic é um divisor de águas Análise ATR baseada em moeda -
Apresentando       Quantum Breakout PRO   , o inovador Indicador MQL5 que está transformando a maneira como você negocia Breakout Zones! Desenvolvido por uma equipe de traders experientes com experiência comercial de mais de 13 anos,       Quantum Breakout PRO       foi projetado para impulsionar sua jornada comercial a novos patamares com sua estratégia de zona de fuga inovadora e dinâmica. O Quantum Breakout Indicator lhe dará setas de sinal em zonas de breakout com 5 zonas-alvo de lucro e
IX Power MT5
Daniel Stein
4.17 (6)
Apresentamos o IX Power - a ferramenta definitiva para aumentar a sua precisão de negociação! Concebido com a mesma precisão imbatível do FX Power, o IX Power permite-lhe dominar qualquer símbolo de negociação, desde índices e acções a mercadorias, ETFs e até criptomoedas. Prepare-se para elevar a sua negociação com informações precisas sobre tendências de curto, médio e longo prazo em todos os seus activos favoritos. Porquê escolher a IX Power? Com o IX Power, seu tempo se torna nítido, ajud
Este é um indicador para MT5 que fornece sinais precisos para entrar em uma negociação sem redesenhar. Ele pode ser aplicado a qualquer ativo financeiro: forex, criptomoedas, metais, ações, índices. Ele fornecerá estimativas bastante precisas e informará quando é melhor abrir e fechar um negócio. Assista o vídeo (6:22) com um exemplo de processamento de apenas um sinal que compensou o indicador! A maioria dos traders melhora seus resultados de negociação durante a primeira semana de negociação c
Matrix Arrow Indicator MT5
Juvenille Emperor Limited
5 (13)
O   Matrix Arrow Indicator MT5   é uma tendência única 10 em 1 seguindo um indicador multi-timeframe   100% sem repintura   que pode ser usado em todos os símbolos/instrumentos:   forex ,   commodities ,   criptomoedas ,   índices ,   ações .  O  Matrix Arrow Indicator MT5  determinará a tendência atual em seus estágios iniciais, reunindo informações e dados de até 10 indicadores padrão, que são: Índice de movimento direcional médio (ADX) Índice de canal de commodities (CCI) Velas clássicas de
Este painel descobre e apresenta as zonas de   oferta   e   procura   no gráfico, tanto no modo de escalpelamento como de longo prazo, dependendo da sua estratégia de negociação para os símbolos seleccionados. Além disso, o modo de scanner do painel de controlo ajuda-o a verificar todos os símbolos desejados num relance e a não perder nenhuma posição adequada /   Versão MT4 Indicador gratuito:   Basic Supply Demand Características Permite-lhe ver oportunidades de negociação em   vários pares
MetaForecast M5
Vahidreza Heidar Gholami
5 (2)
MetaForecast prevê e visualiza o futuro de qualquer mercado com base nas harmonias nos dados de preços. Embora o mercado nem sempre seja previsível, se houver um padrão nos preços, o MetaForecast pode prever o futuro com a maior precisão possível. Em comparação com outros produtos similares, o MetaForecast pode gerar resultados mais precisos ao analisar as tendências do mercado. Parâmetros de entrada Past size (Tamanho do passado) Especifica o número de barras que o MetaForecast usa para criar
CBT Quantum Maverick Sistema de Negociação de Opções Binárias de Alta Eficiência O CBT Quantum Maverick é um sistema de opções binárias de alto desempenho, projetado para traders que buscam precisão, simplicidade e um enfoque disciplinado. Não exige personalização: o sistema está otimizado para resultados eficazes desde o início. Basta seguir os sinais, que podem ser dominados com um pouco de prática. Principais características: Precisão nos sinais: Sinais baseados na próxima vela, utilizand
AT Forex Indicator MT5
Marzena Maria Szmit
5 (5)
The AT Forex Indicator MT5 is a sophisticated trading tool designed to provide traders with a comprehensive analysis of multiple currency pairs. This powerful indicator simplifies the complex nature of the forex market, making it accessible for both novice and experienced traders. AT Forex Indicator uses advanced algorithms to detect trends, patterns and is an essential tool for traders aiming to enhance their forex trading performance. With its robust features, ease of use, and reliable signal
Place price Alerts   on  extended  Rectangles   and   Trendlines -  Risk reward indicator mt5 Extend Rectangles & Trendlines to the right edge Mark your supply demand zones with extended rectangle and draw support resistance lines with extended trendline. Find detailed manuals   here .  Find contacts on my   profile . MT4 Rectangle extender indicator will simplify and make it easier for you to analyze markets and stay notified about important events. When you extend rectangle or trendline the a
Was: $249  Now: $99   Market Profile defines a number of day types that can help the trader to determine market behaviour. A key feature is the Value Area, representing the range of price action where 70% of trading took place. Understanding the Value Area can give traders valuable insight into market direction and establish the higher odds trade. It is an excellent addition to any system you may be using. Inspired by Jim Dalton’s book “Mind Over Markets”, this indicator is designed to suit the
MT4:  https://www.mql5.com/en/market/product/52715 Este indicador é baseado na teoria do perfil de mercado. O que exatamente é uma área para solteiros? Teoria: Perfil de Mercado Singles: Impressões simples ou únicas ou lacunas do perfil são colocadas no interior de uma estrutura de perfil, não na borda superior ou inferior. Eles são representados com TPOs únicos impressos no perfil do Market. Os solteiros chamam a atenção para locais onde o preço mudou muito rápido (movimentos por im
TrendMaestro5
Stefano Frisetti
note: this indicator is for METATRADER4, if you want the version for METATRADER5 this is the link:  https://www.mql5.com/it/market/product/108106 TRENDMAESTRO ver 2.4 TRENDMAESTRO recognizes a new TREND in the bud, he never makes mistakes. The certainty of identifying a new TREND is priceless. DESCRIPTION TRENDMAESTRO identifies a new TREND in the bud, this indicator examines the volatility, volumes and momentum to identify the moment in which there is an explosion of one or more of these data a
Berma Bands
Muhammad Elbermawi
The Berma Bands (BBs) indicator is a valuable tool for traders seeking to identify and capitalize on market trends. By analyzing the relationship between the price and the BBs, traders can discern whether a market is in a trending or ranging phase. Berma Bands are composed of three distinct lines: the Upper Berma Band, the Middle Berma Band, and the Lower Berma Band. These lines are plotted around the price, creating a visual representation of the price movement relative to the overall trend.
PipFinite Volume Critical MT5
Karlo Wilson Vendiola
5 (3)
Volume Gives Depth To Price Action! Volume Critical can accurately locate the cheapest areas to place trades. Enter reversals as early as possible to get the best Risk Reward setups! Features Aggressive algorithm that anticipates reversals Volume Classifications Gray Histograms - Normal Volume, average market activity Orange Histogram - Trending Volume, increased market activity Pink Histograms - Overbought Volume, we can wait for further confirmation to sell Blue Histograms - Oversold Condit
Bill Williams Advanced
Siarhei Vashchylka
5 (9)
Bill Williams Advanced is designed for automatic chart analysis using Bill Williams' "Profitunity" system. The indicator analyzes four timeframes at once. Manual (Be sure to read before purchasing) Advantages 1. Automatically analyzes the chart using the "Profitunity" system of Bill Williams. The found signals are placed in a table in the corner of the screen. 2. Equipped with a trend filter based on the Alligator indicator. Most of the system signals are recommended to be used only accordi
Quantum Trend Sniper
Bogdan Ion Puscasu
4.72 (50)
Apresentando       Quantum Trend Sniper Indicator   , o inovador Indicador MQL5 que está transformando a maneira como você identifica e negocia as reversões de tendência! Desenvolvido por uma equipe de traders experientes com experiência comercial de mais de 13 anos,       Indicador de Atirador de Tendência Quântica       foi projetado para impulsionar sua jornada de negociação a novos patamares com sua forma inovadora de identificar reversões de tendência com precisão extremamente alta. ***C
Mais do autor
As traders, we know that identifying price contractions and consolidations is crucial for profitable trading. Fortunately, we have a powerful tool at our disposal. The indicator to trade price consolidation is designed to identify price contraction and alerts us on formation. It does this by analyzing historical price data and identifying price action patterns. The algorithm then uses this information to mark the zone , potential targets and liquidity lines, giving us valuable insights into mark
Dynamic Range and Target Indicator: Your Reliable Trading Partner Introducing an innovative indicator that revolutionizes how you analyze markets and make trading decisions. Whether you're a beginner seeking clear guidance or an experienced trader looking to enhance your strategy, this tool is designed to meet your needs.   Key Features: 1. Dynamic Range Determination: The indicator continuously analyzes the market, identifying the most recent significant price ranges. 2. Clear Suppor
PA Analyzer
Darko Licardo
5 (2)
With PA analyzer you will see a different perspective of price action , once you have unlocked the full potential of it, this tool will be essential  part of your trading system. PA Analyzer enables market price analysis and automatically marks support and resistance in all time frames. This indicator makes it easy to see whether the price is in range or trend, and generates dynamic profit take targets for the current time frame and the next higher time frame. This allows you to find target co
TrendXplorer indicator is designed to provide valuable insights into market trends, helping you navigate the dynamic world of trading with confidence. Key Features: Accurate Trend Analysis: TrendXplorer utilizes a special algorithm to analyze trends combined with price action. This enables easier trend detection and is less prone to change during price manipulation. Built-in Risk Calculator: Take control of your risk management with TrendXplorer's built-in risk calculator. This feature assesses
Filtro:
Sem comentários
Responder ao comentário