MA and SMMA with Bollinger Bands
- Indicadores
- Kostiantyn Ihnatov
- Versão: 5.0
- Ativações: 20
Sliding Average with Bollinger Bands
General Information: The indicator combines two popular technical analysis tools:
- Moving Averages (Simple Moving Average and Smoothed Moving Average) to assess the trend.
- Bollinger Bands to analyze market volatility.
Main Components:
- SMA (Simple Moving Average): The simple moving average is calculated as the arithmetic mean of prices over a specified period.
Formula:
𝑆𝑀𝐴 = (𝑃1 + 𝑃2 + ⋯ + 𝑃𝑛) / 𝑛
Where:
- 𝑃1, 𝑃2, …, 𝑃𝑛 are the closing prices for 𝑛 periods,
- 𝑛 is the number of periods.
Features:
- Quickly reacts to price changes.
- Used for short-term trend analysis.
- SMMA (Smoothed Moving Average): The smoothed moving average takes into account the entire previous price history, minimizing fluctuations and market noise.
Formula:
First value: 𝑆𝑀𝑀𝐴1 = 𝑆𝑀𝐴
Subsequent values: 𝑆𝑀𝑀𝐴𝑡 = (𝑆𝑀𝑀𝐴𝑡₋₁ * (𝑛 - 1) + 𝑃𝑡) / 𝑛
Where:
- 𝑆𝑀𝑀𝐴𝑡₋₁ is the previous smoothed average value,
- 𝑃𝑡 is the current price,
- 𝑛 is the number of periods.
Features:
- Responds more slowly to price changes.
- Suitable for long-term trend analysis.
- Bollinger Bands: Bollinger Bands are calculated based on the moving average and standard deviation, indicating the range of price fluctuations.
Formulas:
Upper band: Upper BB = MA + (StdDev * K)
Lower band: Lower BB = MA - (StdDev * K)
Where:
- MA is the moving average (SMA or SMMA),
- StdDev is the standard deviation over 𝑛 periods,
- K is the standard deviation multiplier (default is 2.0).
Features:
- Bands widen when volatility increases.
- Narrow bands indicate low volatility.
Indicator Parameters:
-
len (SMA Length): Determines the number of periods for calculating the simple moving average. Example: If len = 9, the indicator will consider the last 9 bars for calculating SMA.
-
maLengthInput (Smoothing Length): Determines the period for calculating the smoothed moving average (SMMA). Example: If maLengthInput = 14, the indicator smooths values based on the last 14 bars.
-
bbMultInput (Bollinger Bands Multiplier): Indicates how many standard deviations the upper and lower bands are away from the mean. Example: If bbMultInput = 2.0, the bands will be at a distance of two standard deviations.
-
maTypeInput (Moving Average Type): A dropdown list for selecting the type of average:
- SMA: Simple Moving Average.
- SMMA: Smoothed Moving Average.
Advantages of the Indicator:
-
Flexibility:
- Ability to choose between SMA and SMMA depending on market conditions.
- Bollinger Bands automatically adjust to volatility.
-
Trend and Volatility Analysis:
- Moving averages help determine the trend direction.
- Bollinger Bands identify overbought/oversold zones and changes in volatility.
-
Ease of Adjustment:
- All parameters are intuitive and easy to adjust.
How to Use the Indicator:
-
Trend Analysis:
- The SMA/SMMA line shows the overall direction of the price:
- Uptrend: Price is above the average, and the line is directed upward.
- Downtrend: Price is below the average, and the line is directed downward.
- The SMA/SMMA line shows the overall direction of the price:
-
Working with Bollinger Bands:
- Price close to the upper band: Possible overbought zone, signal to sell.
- Price close to the lower band: Possible oversold zone, signal to buy.
- Bands narrowing: Indicates low volatility, potential impulsive breakout.
-
Smoothing (SMMA):
- Use SMMA for long-term trends to avoid noise.
Example Usage:
-
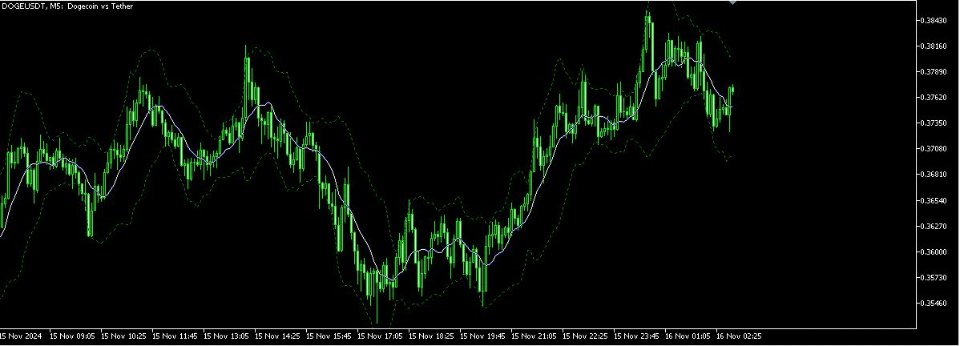
SMA (9) and Bollinger Bands (K = 2.0):
- Suitable for short-term strategies.
- Quickly reacts to trend changes.
-
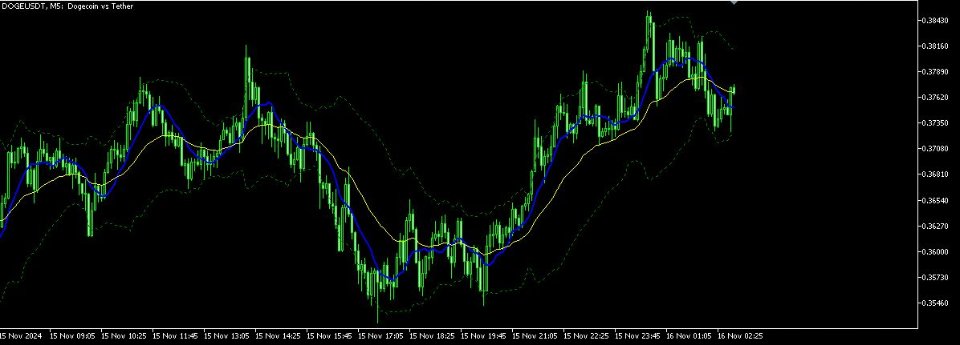
SMMA (14) and Bollinger Bands (K = 2.0):
- Suitable for long-term analysis.
- Smooths out short-term fluctuations.
Conclusion: The "Sliding Average with Bollinger Bands" indicator is a versatile tool that combines trend and volatility analysis, making it suitable for a wide range of strategies. With flexible settings, the user can adapt the indicator to their needs, whether for short-term trading or long-term analysis.


