• Visão global
  • Comentários
  • Discussão

Automatic Fibonacci Pivots

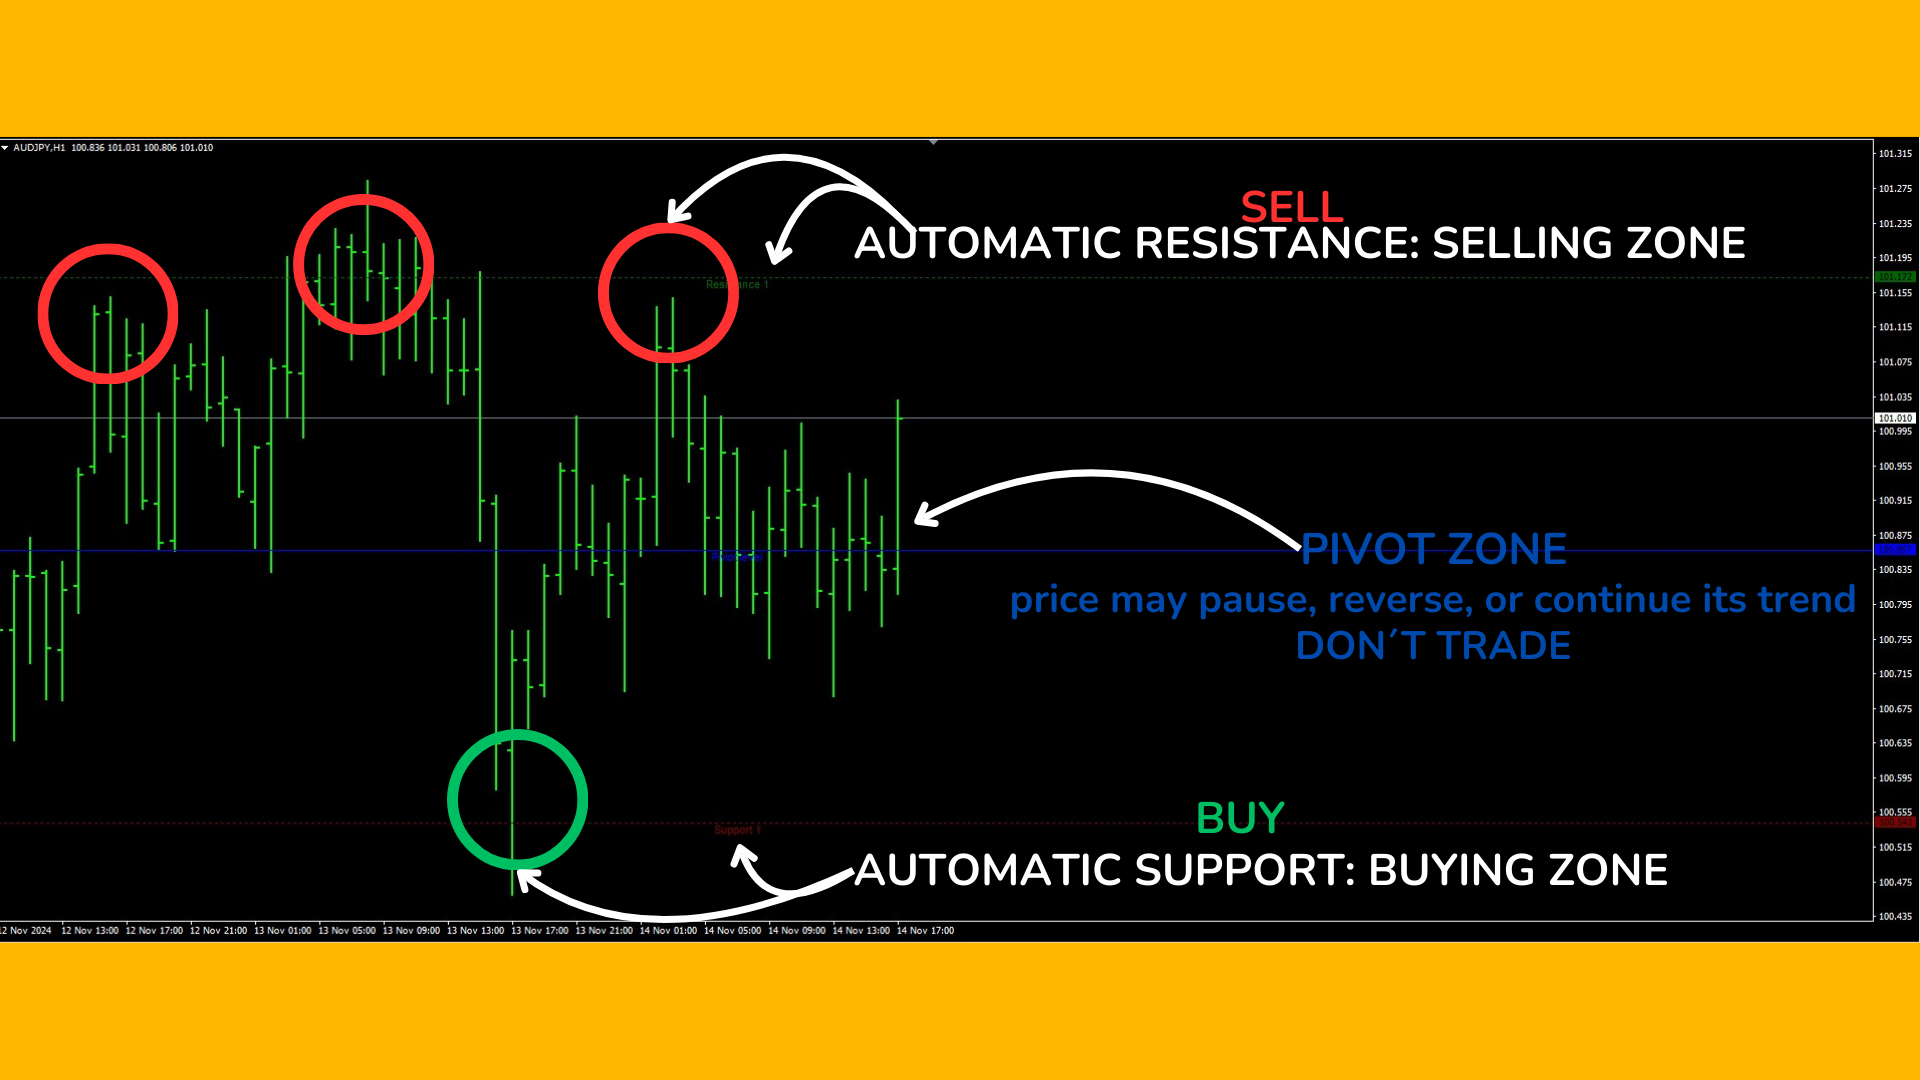
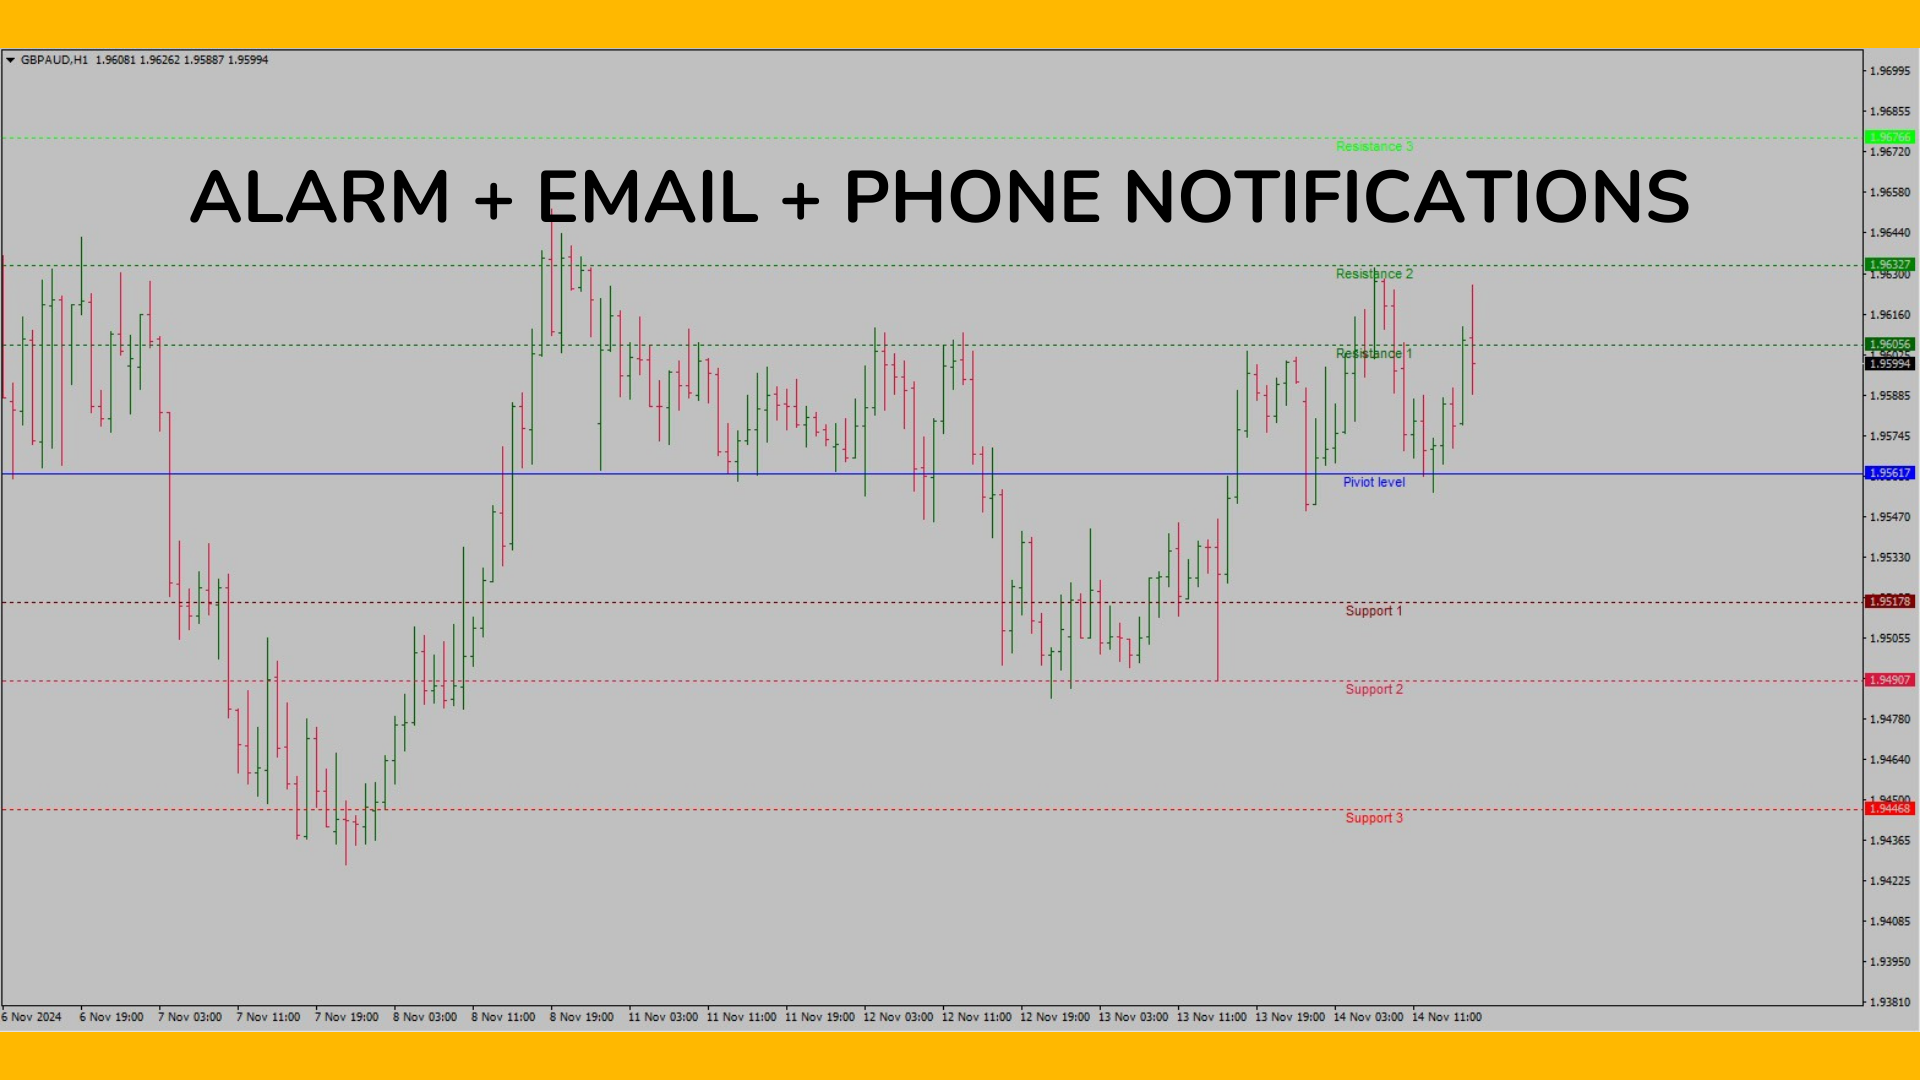
Automatic Fibonacci Pivots automatically calculates pivot levels and support/resistance based on Fibonacci, clearly showing key reference points that indicate potential reversal or trend continuation zones, as well as buy and sell areas. Designed for traders seeking clarity on charts without having to recalculate and manually place Fibonacci levels each time. Once set up on your computer, it will send an alert to your phone when a potential buy/sell signal is issued, allowing you to trade directly from your phone (remember to enable phone alerts in your terminal).


Key Features:

  • Daily Pivot Levels Based on Fibonacci: Accurately identifies the most relevant support and resistance levels (S1, S2, S3, R1, R2, R3) each trading day.
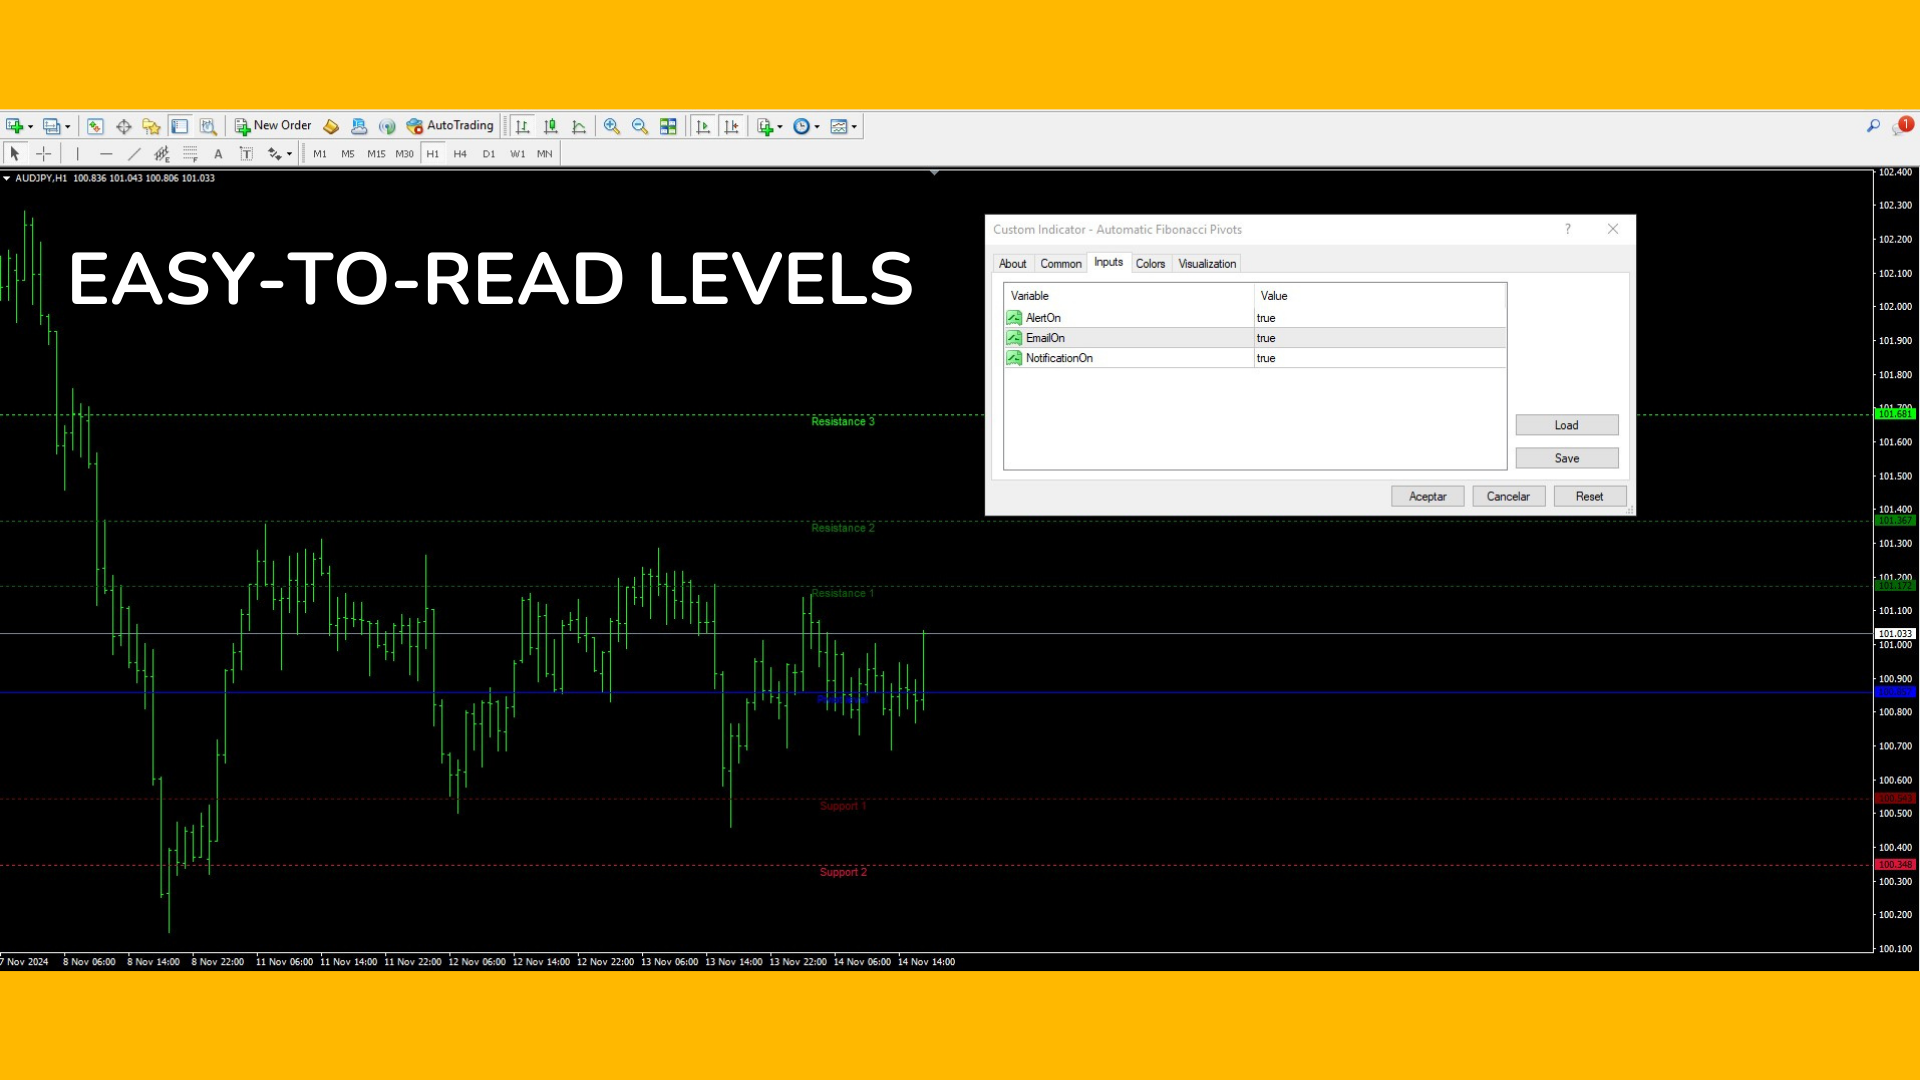
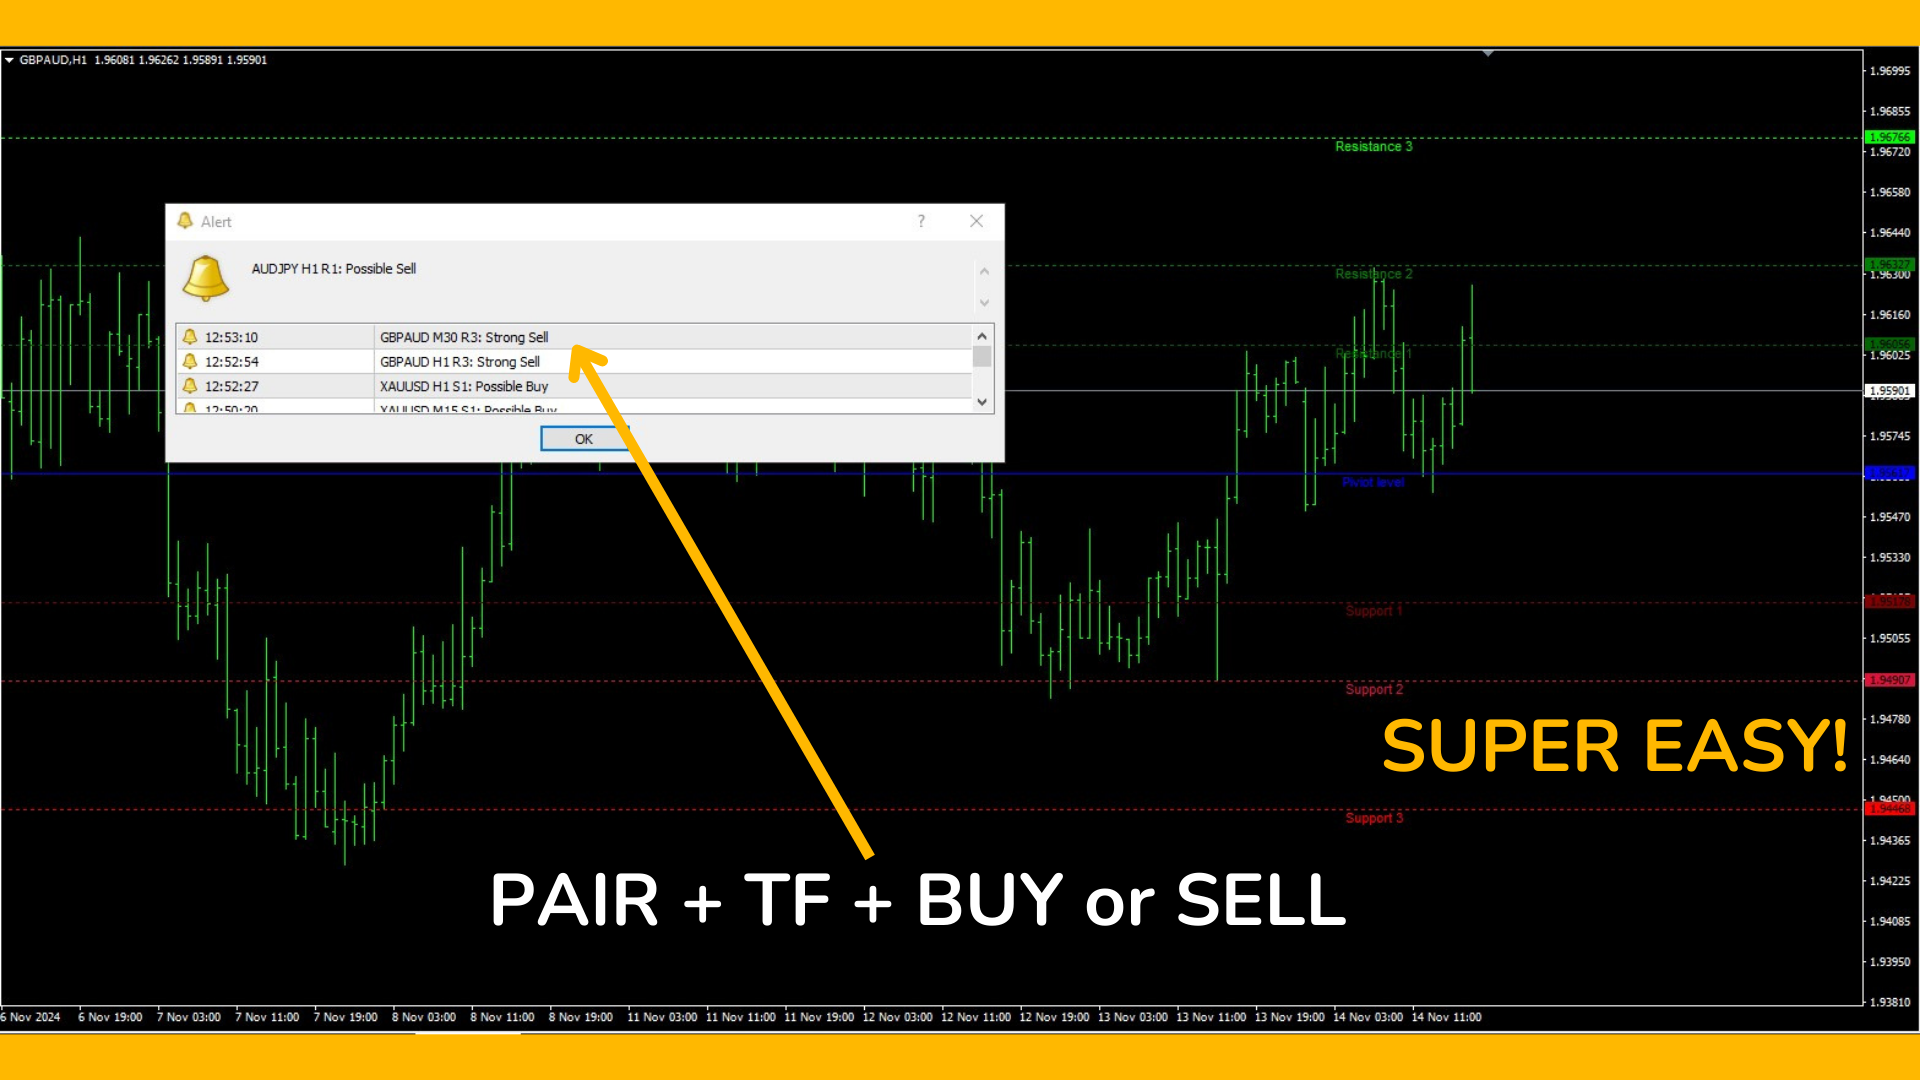
  • Smart and Customizable Alerts: Receive sound, visual, and push notifications on your phone when the price reaches critical levels.
  • Easy Interpretation Across All Timeframes: Levels calculated using daily period data remain consistent across all timeframes, providing you with a steady guide without noise—ideal for analyzing trends and entry/exit points.


How Does It Work?

"Automatic Fibonacci Pivots" automatically identifies key levels each day and alerts you when the price is near potential buy or sell zones. Each alert includes details of the pair, timeframe, and level reached, with a recommendation to buy or sell, allowing you to quickly react to opportunities.

Ideal for traders of all levels looking for a reliable tool to trade accurately in the markets. Compatible with any currency pair!


If you have any questions, feel free to reach out to me!


Produtos recomendados
The indicator draws trend lines based on Thomas Demark algorithm. It draws lines from different timeframes on one chart. The timeframes can be higher than or equal to the timeframe of the chart, on which the indicator is used. The indicator considers breakthrough qualifiers (if the conditions are met, an additional symbol appears in the place of the breakthrough) and draws approximate targets (target line above/below the current prices) according to Demark algorithm. Recommended timeframes for t
The indicator is the advanced form of the MetaTrader 4 standard Fibonacci tool. It is unique and very reasonable for serious Fibonacci traders. Key Features Drawing of Fibonacci retracement and expansion levels in a few seconds by using hotkeys. Auto adjusting of retracement levels once the market makes new highs/lows. Ability to edit/remove any retracement & expansion levels on chart. Auto snap to exact high and low of bars while plotting on chart. Getting very clear charts even though many ret
O indicador procura e exibe grandes sombras no gráfico automaticamente com base na volatilidade. As sombras são filtradas ainda mais pelo tamanho da onda. O algoritmo analisa a quebra do fractal pela sombra no intervalo especificado e exibe o nível. Nas configurações, você pode ativar o painel de várias moedas. O alerta é selecionado entre o gráfico atual ou a folha inteira do painel. Sinais em grandes sombras e aqueles que quebraram o nível fractal podem ser ativados separadamente. Blog-Link -
The indicator is designed for determining Fibonacci levels. Does not repaint/redraw The blue level shows the zero Fibonacci value (it is also the Pivot level) Red levels show calculated Fibonacci levels (used as a rollback or reversal point) Automatic period detection (periods can be entered manually) Adjustable display calculation method. Settings BarsHistory - the number of bars to be used to display the indicator. Method - method of calculation. AutoPeriod - automated period calculation (true
Signal Eskiya
Vitalii Zakharuk
Signal Eskiya, in addition to channel lines, reflects entry signals in the form of arrows. Trading strategies using the channel indicator belong to the classic methods of technical analysis, are easy to execute, and therefore available even to beginners. Price ranges work equally well on any trading assets and timeframes, they can be used both independently and with additional confirmation from oscillators and market volumes. American traders say: “Trend is your friend”, which means “Trend is
Introduction In the fast-paced world of financial market trading, success often hinges on the ability to spot and leverage trends. Among the various strategies available, momentum trading stands out as a powerful tool for traders seeking to capitalize on market movements. In this article, we will delve into the concept of momentum, its significance in trading, and the numerous benefits it offers to traders. What is Momentum? Momentum in trading refers to the tendency of assets to continue moving
The Auto Super Pivot indicator is an indicator designed to calculate support points and resistance points for pivot points. this indicator has the ability to calculate standard pivot, fibonacci, camarilla, woodie and demark pivot points. It also allows you to use all time zones with the time frame feature. Another feature of the indicator is the auto time slice feature. This feature allows automatic calculations without having to set any time zone. Features 6 different pivot calculation modes A
This is a simple and efficient indicator based on market logic. The indicator creates a range chosen by a trader. Trader selects only two parameters. The first one is the number of candles that define the frame. The second one is the number of candles needed for confirmation frame. The indicator shows all situations in history and works with the actual movement of the market. The indicator works on all timeframes . You are not limited by use of different timeframes, the indicator is able to adap
Introduction to X3 Chart Pattern Scanner X3 Cherart Pattern Scanner is the non-repainting and non-lagging indicator detecting X3 chart patterns including Harmonic pattern, Elliott Wave pattern, X3 patterns, and Japanese Candlestick patterns. Historical patterns match with signal patterns. Hence, you can readily develop the solid trading strategy in your chart. More importantly, this superb pattern scanner can detect the optimal pattern of its kind. In addition, you can switch on and off individu
Swing High Low Fibonacci
Frank Wesley Iii Mccallister
This indicator identifies the major and minor swing high and low points on a chart. It then takes the most recent swing and draws a fibonacci pattern of retracement and extension levels to give you an idea of where price may move next. It allow allows you to set a pair of moving averages to help identify the direction of the overall trend. There are configuration parameters for the major and minor swing and the moving averages.
The indicator detects important peaks and troughs (extremes) on the chart. These points can be used to plot support/resistance levels and trend lines, as well as any other graphical analysis. These points can serve as reference points for setting trading orders. The indicator does not redraw . Settings: Size_History  - the size of the calculated history. Num_Candles_Right  - number of candles to the right of the peak or trough. Num_Candles_Left  - number of candles to the left of the peak or
Colored indicator of the linear channel based on the Fibonacci sequence. It is used for making trading decisions and analyzing market sentiment. The channel boundaries represent strong support/resistance levels, as they are the Fibonacci proportion levels. Users can select the number of displayed lines of channel boundaries on the chart by means of the input parameters. Attaching multiple instances of the indicator to the chart with different calculation periods leads to displaying a system of c
Auto Levels
Yaroslav Varankin
Auto Level this tool is able to determine the levels of support and resistance. search and display when the price has broken through the level and when it pushed off from it. the indicator can be useful if you use resistance support levels in your trading. or the highs and lows of the price, then it will greatly simplify your work and help you more quickly and more accurately determine the rebound or breakdown of the current trend or tendencies level. blue line bottom uptrend red line on top dow
Capital Pivot
Mr Nisit Noijeam
Pivot Points และระดับ (Support) และ(Resistance) บนแผนภูมิการเทรดใน MetaTrader 4 สำหรับตลาด Forex : คำนวณ Pivot Points : สคริปต์คำนวณจุด Pivot โดยใช้ข้อมูลราคาประวัติศาสตร์ เช่น ราคาเปิด, ราคาสูงสุด, ราคาต่ำสุด, และราคาปิด จากช่วงเวลาที่กำหนด (เช่น วัน, ชั่วโมง, ฯลฯ) จุด Pivot และระดับต่างๆ เช่น R1, R2, R3 (ระดับการต้านทาน) และ S1, S2, S3 (ระดับการสนับสนุน) ถูกคำนวณออกมา แสดงบนแผนภูมิ : หลังจากคำนวณจุด Pivot และระดับต่างๆ, สคริปต์จะแสดงเส้นเหล่านี้บนแผนภูมิ MT4 เพื่อช่วยให้นักเทรดสามารถเห็นจุดที่
Adamant Levels Logic A
Sattiraju Kottapalli
5 (1)
Este indicador pinta níveis que são muito 'inflexíveis' e fortes na natureza. Esses níveis atuam como fortes níveis de rejeição de preço por um tempo de vida e nunca são repintados. Para incorporar todos os meus níveis lógicos ao seu sistema de negociação, a assinatura de 6 meses de todos os níveis lógicos está disponível por um preço de assinatura de 1 mês. Espero que isso seja útil. Disclaimer: Se você estiver procurando por um indicador Fancy, colorido e atraente, por favor, fique long
The Grid Inside
Luiz Godoy
5 (1)
The Grid Inside works on a counter trend mode, automatically opens a new order when it hits the price target due to the Fibonacci levels at 23.6 and 73.6. If the price goes the wrong way it opens another order with a calculated lot and position. All the positions are closed when it reaches the target profit defined on settings. As TGI does not use stop loss, I don't recommend you put on your account more than you can afford to lose, the higher the timeframe safer it gets. Once an order is trigge
Channel Vertex is a price action pattern formed by price Chanel and a triangle pattern . Price channels basically indicates possible support and resistance zones around a price movement and retracement    or breakout at these levels can indicate possible trend continuation or reversal .  Majority of the times price fluctuations forms triangle patterns defined by 3 vertexes , these triangle patterns most times defines a trend continuation.  A triangle pattern is a trend continuation pattern that
FiboZag
Andriy Sydoruk
Indicator FiboZag - transfer the indicator to the chart and the Fibonacci levels will be built automatically on the last ZigZag turn. The main advantage lies in the correct construction of Fibonacci levels and markup of price levels. Simple, visual and effective use. The indicator is not redrawn and does not lag. Works on all currency pairs and on all timeframes.
Trend Divergence Indicator: Your Essential Tool for Market Analysis The Trend Divergence Indicator is a powerful tool designed to assist traders in identifying market trends and pinpointing entry points with precision. By leveraging price divergence, this indicator enhances your trading strategy, offering reliable insights and filtering unnecessary signals. Key Features and Benefits of the Trend Divergence Indicator Accurate Trend Analysis: The Trend Divergence Indicator uses price divergence t
I just sell my products in mql5.com, any other websites are stolen old versions, So no any new updates or support. - Lifetime update free -   Real price is 80$   - 40% Discount ( It is 49$ now ) Contact me for instruction, any questions! Related Product:  Gold Expert  ,  Professor EA - Non-repaint Introduction Flag patterns are an important tool for technical traders in the stock market. When interpreting a flag pattern, it is important to wait for the pattern to pick a direction before ente
Fibo World
Pavel Verveyko
The indicator builds a graphical analysis based on the Fibonacci theory. Fibo Fan is used for the analysis of the impulses and corrections of the movement. Reversal lines (2 lines at the base of the Fibonacci fan) are used to analyze the direction of movements. The indicator displays the of 4 the target line in each direction. The indicator takes into account market volatility. If the price is above the reversal lines, it makes sense to consider buying, if lower, then selling. You can open posi
Pivots
Paul Geirnaerdt
Pivots is an indicator to show pivots for relevant time frames. Besides the pivots the indicator can also show daly open line, the resistance and support levels, the ADR Fibonacci levels and the order of the pivots. Pivots includes an intelligent algorithm to eliminate Sunday candles, but only if your broker provides those. Pivots are significant price levels that may serve as support, resistance or breakout levels Settings textFont - font to use for the labels. textSize - font size. textColor -
High Low Predict
Thomas Bradley Butler
This indicator is designed to help you forecast the potential high and low prices for the current trading day, based on the high and low of the previous day. It does this by applying a customizable percentage increase or decrease to those levels. How It Works: The idea is simple: It looks at the previous day's high and low prices and then adjusts them by a percentage you choose. Here's what that means: Predicted High : This is calculated by taking the high price of the previous day and adding a
Newlevel
Sergey Nanov
Indicator. Zones of support and resistance levels The most reliable tool in the hands of any technical analyst is support and resistance levels.It is these levels that magically work in the market, because the price then bounces off them, on the contrary, gaining maximum acceleration, punching them and striving for a new price point.However, in practice, many beginners face enormous difficulties in building them.This is due to the fact that the price may react quite differently to them, and ofte
The price is moving between two curve tunnel lines in a trend. The two lines of a tunnel represent support and resistance. In an uptrend, for instance, a trade might be entered at the support of the trend line (shown by the red line in the chart) and exited at resistance of the upper tunnel line (shown by the blue line). Tunnel show trend direction for any timeframe (if you have enough bars on the chart for higher timeframes). Trend, or price tunnel, can be up, down or sideways. If the current p
Alert Up Down MT4
William Oswaldo Mayorga Urduy
ALERTA PARA CIMA - PARA BAIXO PARA METATRADER 5 Este indicador gera um alerta quando o preço sai da zona entre as linhas UP e DOWN. Você pode gerar alertas de vários tipos, como: > Som > Caixa de mensagem > Mensagem na caixa do especialista > Mail (previamente configurado) > Notificações PUSH (previamente configuradas) As linhas devem ser configuradas a partir das propriedades do indicador e não das propriedades das linhas, pois se for feito a partir das propriedades das linhas, o fin
Swing Reader
Francesco Rubeo
5 (1)
Read Elliott wave principle automatically. With the Swing Reader, you can easily read the Elliott Wave Principle through an automatic system. With swing, we mean a ZigZag market that is created by a breakout of its standard deviation. You can set the deviation manually, or you can let the indicator do it automatically (setting the deviation to zero). Advantages you get Never repaints. Points showing a horizontal line, in which statistically a long wave ends. Candles showing a vertical line in
Este indicador do painel de controle de zona de oferta e demanda com vários períodos e vários símbolos envia alertas quando o preço atinge uma zona de oferta / demanda. Também é possível usá-lo para ser alertado sobre topos / fundos duplos regulares em vez de zonas. Ele pode ser usado com todos os intervalos de tempo de M1 a MN. É possível usar RSI, divergência (MACD, OsMA, RSI ou Awesome) e filtros de padrões de velas (barra de pinos, engolfing, pinça e estrela da manhã / noite) para filtrar ap
Optimized for Asia- London- US- Open-Session  the best Features from MOMENTUM-SOLO true Momentum - time-based Indicator it's based on a self-developed candle Pattern, in relation to the ATR Filter Daytime Weekdays Moving Averages Keltner-Channel Advantages Optimized for Asia- London- US- Open-Session choose your personal times to trade - select Daytime and Weekdays Keltner-Channel => to reduce market noise - sideways movement will be hidden 3x Moving Averages => for the Trend Signal
Profile SR
Teresinha Moraes Correia
Descrição do Indicador de Suporte e Resistência Baseado em Volume Profile para MetaTrader 4 Introdução O mercado financeiro é uma arena onde traders e investidores buscam constantemente maneiras de encontrar vantagens competitivas. Um dos conceitos mais amplamente utilizados e respeitados em qualquer mercado é o de suporte e resistência . Esses níveis representam zonas-chave de preço onde a oferta e a demanda se equilibram, e onde grandes decisões são tomadas pelos participantes que movimentam o
Os compradores deste produto também adquirem
Gann Made Easy
Oleg Rodin
4.82 (105)
Gann Made Easy é um sistema de negociação Forex profissional e fácil de usar, baseado nos melhores princípios de negociação usando a teoria do sr. W. D. Gann. O indicador fornece sinais precisos de COMPRA e VENDA, incluindo níveis de Stop Loss e Take Profit. Você pode negociar mesmo em movimento usando notificações PUSH. Entre em contato comigo após a compra! Vou compartilhar minhas dicas de negociação com você e ótimos indicadores de bônus de graça! Provavelmente você já ouviu muitas vezes sobr
FX Power MT4 NG
Daniel Stein
5 (17)
FX Power: Analise a Força das Moedas para Decisões de Negociação Mais Inteligentes Visão Geral FX Power é a sua ferramenta essencial para compreender a força real das principais moedas e do ouro em quaisquer condições de mercado. Identificando moedas fortes para comprar e fracas para vender, FX Power simplifica as decisões de negociação e revela oportunidades de alta probabilidade. Quer você prefira seguir tendências ou antecipar reversões usando valores extremos de Delta, esta ferramenta adap
Dynamic Forex28 Navigator
Bernhard Schweigert
5 (4)
Dynamic Forex28 Navigator - A ferramenta de negociação Forex de última geração. ATUALMENTE 49% DE DESCONTO. Dynamic Forex28 Navigator é a evolução dos nossos indicadores populares de longa data, combinando o poder de três em um: Indicador Advanced Currency Strength28 (695 avaliações) + Advanced Currency IMPULSE com ALERTA (520 avaliações) + Sinais CS28 Combo (Bônus). Detalhes sobre o indicador https://www.mql5.com/en/blogs/post/758844 O que o Next-Generation Strength Indicator oferece?  Tudo
FX Volume
Daniel Stein
4.59 (34)
FX Volume: Vivencie o Verdadeiro Sentimento de Mercado sob a Perspectiva de um Corretor Visão Geral Rápida Quer aprimorar sua abordagem de trading? FX Volume fornece insights em tempo real sobre como traders de varejo e corretores estão posicionados—bem antes de relatórios atrasados como o COT. Seja para buscar ganhos consistentes ou simplesmente ter uma vantagem mais clara no mercado, FX Volume ajuda você a detectar grandes desequilíbrios, confirmar rompimentos e aperfeiçoar sua gestão de ris
ACTUALMENTE COM 26% DE DESCONTO A melhor solução para qualquer novato ou comerciante especializado! Este Indicador é uma ferramenta comercial única, de alta qualidade e acessível, porque incorporámos uma série de características proprietárias e uma nova fórmula. Com apenas UM gráfico, pode ler a força da moeda para 28 pares de Forex! Imagine como a sua negociação irá melhorar porque é capaz de apontar o ponto exacto do gatilho de uma nova tendência ou oportunidade de escalada? Manual do util
Scalper Inside PRO
Alexey Minkov
4.75 (59)
!SPECIAL SALE!  An exclusive indicator that utilizes an innovative algorithm to swiftly and accurately determine the market trend. The indicator automatically calculates opening, closing, and profit levels, providing detailed trading statistics. With these features, you can choose the most appropriate trading instrument for the current market conditions. Additionally, you can easily integrate your own arrow indicators into Scalper Inside Pro to quickly evaluate their statistics and profitability
I just sell my products in mql5.com, any other websites are stolen old versions, So no any new updates or support. - Lifetime update free - Real price is 80$ - 40% Discount ( It is 49$ now ) Contact me for instruction, add group and any questions! Related Products:  Bitcoin Expert , Gold Expert - Non-repaint Introduction The breakout and retest strategy is traded support and resistance levels. it involves price breaking through a previous level.  The break and retest strategy is designed to h
Scalper Vault
Oleg Rodin
5 (27)
Scalper Vault é um sistema profissional de escalpelamento que fornece tudo o que você precisa para um escalpelamento bem-sucedido. Este indicador é um sistema de negociação completo que pode ser usado por comerciantes de forex e opções binárias. O período de tempo recomendado é M5. O sistema fornece sinais de seta precisos na direção da tendência. Ele também fornece sinais superiores e inferiores e níveis de mercado Gann. Os indicadores fornecem todos os tipos de alertas, incluindo notificações
Golden Trend Indicator
Noha Mohamed Fathy Younes Badr
4.9 (10)
Golden Trend indicator  is The best indicator for predicting trend movement this indicator never lags and never repaints and never back paints    and give  arrow buy and sell    before the candle appear  and it will help you and  will make your trading decisions clearer its work on all currencies and  gold and crypto and all time frame This unique  indicator uses very secret algorithms to catch the  trends, so you can trade using this indicator and see the trend clear on charts  manual guide and
FX Levels MT4
Daniel Stein
5 (2)
FX Levels: Suporte e Resistência com Precisão Excepcional para Todos os Mercados Visão Geral Rápida Procurando um meio confiável de identificar níveis de suporte e resistência em qualquer mercado—incluindo pares de moedas, índices, ações ou commodities? FX Levels combina o método “Lighthouse” tradicional com uma abordagem dinâmica de vanguarda, fornecendo uma precisão quase universal. Baseado em nossa experiência real com corretores e em atualizações automáticas diárias mais as de tempo real,
TrendMaestro
Stefano Frisetti
5 (3)
note: this indicator is for METATRADER4, if you want the version for METATRADER5 this is the link:  https://www.mql5.com/it/market/product/108106 TRENDMAESTRO ver 2.4 TRENDMAESTRO recognizes a new TREND in the bud, he never makes mistakes. The certainty of identifying a new TREND is priceless. DESCRIPTION TRENDMAESTRO identifies a new TREND in the bud, this indicator examines the volatility, volumes and momentum to identify the moment in which there is an explosion of one or more of these data a
Trend Screener
STE S.S.COMPANY
4.78 (91)
Indicador de tendência, solução única inovadora para negociação e filtragem de tendências com todos os recursos de tendências importantes construídos dentro de uma ferramenta! É um indicador multi-timeframe e multi-moedas 100% sem repintura que pode ser usado em todos os símbolos/instrumentos: forex, commodities, criptomoedas, índices e ações. OFERTA POR TEMPO LIMITADO: O indicador Support and Resistance Screener está disponível por apenas US$ 50e vitalício. (Preço original US$ 250) (oferta este
TPSproTREND PrO
Roman Podpora
4.81 (21)
TPSpro TREND PRO   é um indicador de tendência que analisa automaticamente o mercado e fornece informações sobre a tendência e cada uma de suas mudanças, além de dar sinais para entrar em negociações sem redesenhar! O indicador utiliza cada vela, analisando-as separadamente. referindo-se a diferentes impulsos - impulso para cima ou para baixo. Pontos de entrada exatos em transações de moedas, criptomoedas, metais, ações, índices! Versão MT5                   DESCRIÇÃO COMPLETA DO INDICADOR      
TPSpro RFI Levels
Roman Podpora
4.84 (25)
INSTRUÇÕES         Russo   -        ENG       R   ecomendado para uso com um indicador       -       TPSpro   TREND PRO -   Versão MT4         Um elemento-chave na negociação são as zonas ou níveis a partir dos quais as decisões de comprar ou vender um instrumento de negociação são tomadas. Apesar das tentativas dos principais participantes de esconder sua presença no mercado, eles inevitavelmente deixam rastros. Nossa tarefa era aprender como identificar esses rastros e interpretá-los corretame
Gold Stuff
Vasiliy Strukov
4.86 (247)
Gold Stuff-um indicador de tendência projetado especificamente para o ouro, também pode ser usado em qualquer instrumento financeiro. O indicador não é redesenhado ou atrasado. O timeframe recomendado é H1. O EA Gold Stuff Expert Advisor está escrito neste indicador, você pode encontrá-lo no meu perfil. Importante! Entre em contato comigo imediatamente após a compra para obter instruções e bônus!  Você pode obter uma cópia gratuita do nosso indicador Strong Support e Trend Scanner, envie uma
Easy Breakout
Mohamed Hassan
5 (9)
After your purchase, feel free to contact me for more details on how to receive a bonus indicator called VFI, which pairs perfectly with Easy Breakout for enhanced confluence!   Easy Breakout is a powerful price action trading system built on one of the most popular and widely trusted strategies among traders: the Breakout strategy ! This indicator delivers crystal-clear Buy and Sell signals based on breakouts from key support and resistance zones. Unlike typical breakout indicators, it levera
Supply and Demand Dashboard PRO
Bernhard Schweigert
4.8 (20)
Actualmente 20% OFF ! Este painel é uma peça de software muito poderosa que trabalha em múltiplos símbolos e até 9 prazos. Baseia-se no nosso principal indicador (Melhores críticas: Advanced Supply Demand ).   O tablier dá uma óptima visão geral. Mostra:   Valores filtrados da Oferta e da Procura, incluindo a classificação da força da zona, Distâncias de/para as zonas e dentro das zonas, Destaca as zonas aninhadas, Dá 4 tipos de alertas para os símbolos escolhidos em todos os (9) períodos de
Bull versus Bear
Mohamed Hassan
4.47 (17)
Enjoy a   50% OFF   Christmas holiday sale!   Send us a message after your purchase to receive more information on how to get your  BONUS  for FREE  that works in great combination with Bull vs Bear ! Bull versus Bear is an easy-to-use Forex indicator that gives traders clear and accurate signals based on clear trend retests . Forget about lagging indicators or staring at charts for hours because  Bull vs Bear provides real-time entries with no lag and no repaint, so you can trade with confide
Reversal Master
Alexey Minkov
4.92 (13)
!SPECIAL SALE! The Reversal Master is an indicator for determining the current direction of price movement and reversal points. The indicator will be useful for those who want to see the current market situation better. The indicator can be used as an add-on for ready-made trading systems, or as an independent tool, or to develop your own trading systems. The Reversal Master indicator, to determine the reversal points,  analyzes a lot of conditions since the combined analysis gives a more accura
Currency Strength Exotics
Bernhard Schweigert
4.87 (31)
ACTUALMENTE 20% DE DESCONTO ! A melhor solução para qualquer novato ou comerciante especializado! Este Indicador é especializado para mostrar a força da moeda para quaisquer símbolos como Pares Exóticos de Commodities, Índices ou Futuros. É o primeiro do seu género, qualquer símbolo pode ser adicionado à 9ª linha para mostrar a verdadeira força da moeda de Ouro, Prata, Petróleo, DAX, US30, MXN, TRY, CNH etc. Esta é uma ferramenta de negociação única, de alta qualidade e acessível, porque inco
CONTACT US  after purchase to get a FREE Trading Manual & an Exclusive Trading Tips PDF! Try Now—Limited 50% Discount for First 100 Buyers! Download the  Metatrader 5 Version William Delbert Gann (W.D. Gann) was an exceptional market analyst, whose trading technique was based on a complex blend of mathematics, geometry, astrology, and ancient mathematics which proved to be extremely accurate. A Note from the Developer to all the Traders: Over 15+ years of my journey with WD Gann (William Delb
Stratos Pali
Michela Russo
5 (1)
Stratos Pali Indicator   is a revolutionary tool designed to enhance your trading strategy by accurately identifying market trends. This sophisticated indicator uses a unique algorithm to generate a complete histogram, which records when the trend is Long or Short. When a trend reversal occurs, an arrow appears, indicating the new direction of the trend. Important Information Revealed Leave a review and contact me via mql5 message to receive My Top 5 set files for Stratos Pali at no cost! Dow
Volume by Price MT4
Brian Collard
4.64 (11)
The Volume by Price Indicator for MetaTrader 4 features Volume Profile and Market Profile TPO (Time Price Opportunity). Volume and TPO histogram bar and line charts. Volume Footprint charts. TPO letter and block marker collapsed and split structure charts. Static, dynamic and flexible range segmentation and compositing methods with relative and absolute visualizations. Session hours filtering and segment concatenation with Market Watch and custom user specifications. Graphical layering, positio
ACTUALMENTE 31% DE DESCONTO!! A melhor solução para qualquer novato ou comerciante especializado! Este indicador é uma ferramenta comercial única, de alta qualidade e acessível, porque incorporámos uma série de características proprietárias e uma fórmula secreta. Com apenas UM gráfico, dá alertas para todos os 28 pares de moedas. Imagine como a sua negociação irá melhorar porque é capaz de identificar o ponto exacto de desencadeamento de uma nova tendência ou oportunidade de escalada! Constr
Grand signal
Alexandr Lapin
5 (2)
The Grand Signal indicator is a unique tool that not only provides an understanding of market behavior but also precisely identifies trend entry points after intraday correction limits, with accuracy down to a five-minute candlestick! It includes individual settings for each currency pair. After purchasing, be sure to message me directly for instructions! Telegram: @Lapinsania or here in the Market! I
Matrix Arrow Indicator MT4
Juvenille Emperor Limited
5 (3)
O Matrix Arrow Indicator MT4 é uma tendência única 10 em 1 seguindo um indicador multi-timeframe 100% sem repintura que pode ser usado em todos os símbolos/instrumentos: forex, commodities, criptomoedas, índices, ações. O Matrix Arrow Indicator MT4 determinará a tendência atual em seus estágios iniciais, reunindo informações e dados de até 10 indicadores padrão, que são: Índice de movimento direcional médio (ADX) Índice de canal de commodities (CCI) Velas clássicas de Heiken Ashi Média Móvel Di
O sistema PRO Renko é um sistema de negociação altamente preciso especialmente concebido para a negociação de gráficos RENKO. Trata-se de um sistema universal que pode ser aplicado a vários instrumentos de negociação. O sistema neutraliza eficazmente o chamado ruído de mercado, dando-lhe acesso a sinais de inversão precisos. O indicador é muito fácil de usar e tem apenas um parâmetro responsável pela geração de sinal. Você pode facilmente adaptar a ferramenta a qualquer instrumento de negocia
O Apollo BuySell Predictor é um sistema de negociação profissional que inclui vários módulos de negociação. Ele fornece ao trader zonas de rompimento exclusivas, níveis de suporte e resistência baseados em fibonacci, linha de tendência de pivô, sinais de volume de recuo e outros recursos úteis que qualquer trader precisa diariamente. O sistema funcionará com qualquer par. Os prazos recomendados são M30, H1, H4. Embora o indicador também possa funcionar com outros prazos, exceto os prazos superio
Smart Liquidity Profile
Suvashish Halder
4.86 (7)
The Smart Liquidity Profile is color-coded based on the importance of the traded activity at specific price levels, allowing traders to identify significant price levels such as support and resistance levels, supply and demand zones, liquidity gaps, consolidation zones, Buy-Side/Sell-Side Liquidity and so on.  Smart Liquidity Profile allows users to choose from a number of different time periods including 'Auto,' 'Fixed Range,' 'Swing High,' 'Swing Low,' 'Session,' 'Day,' 'Week,' 'Month,' 'Quar
Automated Trendlines
Georgios Kalomoiropoulos
5 (16)
As linhas de tendência são a ferramenta mais essencial de análise técnica na negociação forex. Infelizmente, a maioria dos traders não os desenha corretamente. O indicador Automated Trendlines é uma ferramenta profissional para traders sérios que o ajudam a visualizar o movimento de tendências dos mercados. Existem dois tipos de Trendlines Bullish Trendlines e Bearish Trendlines. Na tendência de alta, a linha de tendência Forex é desenhada através dos pontos de oscilação mais baixos do movime
Mais do autor
Aurum Apex Mt4 EA
Martin Alejandro Bamonte
5 (1)
Agora você pode baixar a versão demo do Aurum Apex na guia Comentários para avaliar seu desempenho ao vivo no seu próprio corretor! Aurum Apex EA é uma poderosa ferramenta de negociação automatizada 100%, projetada para a plataforma MT4. Ele realiza análises de mercado em tempo real, detectando várias oportunidades de negociação. Adequado para traders de todos os níveis, o Aurum Apex EA oferece três modos de risco, ajustáveis através do parâmetro de Risco: Risco = 0.1 (Baixo Risco): Ideal para
M1 Easy Scalper
Martin Alejandro Bamonte
M1 EASY SCALPER is a scalping indicator specifically designed for the 1-minute (M1) timeframe, compatible with any currency pair or instrument available on your MT4 terminal. Of course, it can also be used on any other timeframe, but it works exceptionally well on M1 (which is challenging!) for scalping. Note: if you're going to scalp, make sure you have an account suitable for it. Do not use Cent or Standard accounts as they have too much spread! (use ECN, RAW, or Zero Spread accounts) Robustn
Gold Vertex EA
Martin Alejandro Bamonte
Gold Vertex EA is a reliable and stable option for those looking to automate their trading in the gold market. With a robust system based on one of the most effective indicators and a solid trend-following strategy, Gold Vertex EA is a powerful tool for traders who want precise, worry-free trading. Requirements Platform : MetaTrader 4 Supported Instruments : Specifically developed and configured for Gold (XAUUSD) Recommended Account Type : ECN or low spread Minimum Deposit Recommended : $100 Tim
Candle Probability Scalper
Martin Alejandro Bamonte
Guia de Uso do Candle Probability Scalper Este indicador torna o scalping fácil e 100% intuitivo. Candle Probability Scalper mostrará de forma instantânea os dados percentuais de força de compradores e vendedores em TEMPO REAL e na vela atual. Os percentuais são atualizados a cada tick, o que significa que você saberá, segundo a segundo, o que a maioria dos compradores e vendedores está fazendo, sem nenhum atraso. Isso ajudará imensamente a determinar ou confirmar a força de cada lado e, conseq
Scalping Signal NO Repaint NO Lag
Martin Alejandro Bamonte
5 (1)
"Scalping Signal No Repaint No Lag" é o único indicador no mercado que, ao ser arrastado para qualquer gráfico, carrega automaticamente todos os indicadores necessários sem a necessidade de carregar qualquer template ou outros indicadores. Ele configura automaticamente o gráfico para que fique exatamente como na imagem fornecida. Este indicador garante sinais sem repintura ou atraso, tornando-o ideal para estratégias de scalping em todos os pares de moedas e intervalos de tempo (TF). Funcionali
Indicador NextCandlePredictor NextCandlePredictor, um indicador de sinal com alerta que não repinta, não muda de cor, não se move, não desaparece e não tem lag. Ele ajudará a identificar a direção da próxima ou próximas velas em qualquer período de tempo. Altamente recomendado para mercados de alta volatilidade, como Nova York, Londres ou até mesmo a sobreposição de ambos. Principais Características: Versatilidade em Timeframes: Fornece sinais rápidos e precisos em qualquer timeframe, de M1 a H1
Pairs and TF Changer
Martin Alejandro Bamonte
Está cansado de alternar entre vários gráficos para monitorar diferentes pares de moedas e prazos? O indicador Pairs and TF Changer está aqui para revolucionar sua experiência de negociação! Depois de carregar todos os indicadores para sua estratégia, adicione o Pairs and TF Changer ao gráfico. Se necessário, você pode ajustar sua posição, cores ou o número de colunas exibidas! Principais Características: Integração perfeita: Integre este indicador à sua estratégia de negociação sem esforço. Com
Clear Breakout
Martin Alejandro Bamonte
5 (1)
O indicador "Breakout Buy-Sell" foi desenvolvido para identificar e destacar potenciais oportunidades de compra e venda com base em rompimentos de preços durante diferentes sessões de mercado (Tóquio, Londres e Nova York). Este indicador ajuda os traders a visualizar claramente as zonas de compra e venda, bem como os níveis de take-profit (TP) e stop-loss (SL). Estratégia de Uso O indicador pode ser usado da seguinte maneira: Configuração Inicial : Selecione a sessão do mercado e ajuste o offset
BullsEye Signal NoRepaint
Martin Alejandro Bamonte
3 (2)
BullseyeSignal – NoRepaint é um sinal que, como o nome sugere, nunca repinta em nenhuma circunstância. O sinal é emitido na mesma vela observada na imagem. É ideal para mercados altamente voláteis, como forex, criptomoedas, ações, índices e futuros. Você verá apenas uma seta verde para compra e uma seta vermelha para venda, mas há muitos indicadores trabalhando juntos por trás deles para fornecer uma experiência de negociação mais simplificada. Ele é especificamente projetado para fornecer entra
GbpUsd Pip Hunter EA
Martin Alejandro Bamonte
Portugués GBPUSD Pip Hunter EA Características principais: Otimizado para GBPUSD no M15: Projetado e testado especificamente para o par GBPUSD em um gráfico de 15 minutos. Tamanho mínimo de conta recomendado: Requer um saldo mínimo de $1000 para garantir baixas perdas. Compatibilidade de spread: Melhor utilizado com contas de spread baixo ou ECN para maximizar a lucratividade. Gestão de riscos: Inclui uma opção para desativar a função de Lote Exponencial ajustando-a para 1.0, conforme suas neces
O indicador MTFMA (Médias Móveis Multitemporais) utiliza várias médias móveis (MAs) em diferentes prazos para fornecer sinais de compra e venda (que não repintam) em uma janela separada do gráfico principal. É versátil e fácil de interpretar, adequado tanto para scalping em prazos menores quanto para negociação de longo prazo em prazos maiores. Por que é Multiframe? O termo multiframe refere-se à capacidade do indicador de utilizar e combinar dados de múltiplos prazos. O MTFMA calcula e exibe si
O indicador "MultiSymbol & TF Chart Integrated" é projetado para fornecer uma visão abrangente do mercado rapidamente, permitindo que você monitore até 60 pares de moedas em seus intervalos de tempo preferidos em um único gráfico (modo múltiplo) ou veja o par que você está negociando em todos os TFs (modo simples). Principais Vantagens: Monitoramento Completo: Permite monitoramento em tempo real de todos os pares desejados em um único gráfico de relance. Economia de Tempo: Evita a necessidade de
GO Trend MultiTimeFrame
Martin Alejandro Bamonte
Indicador GoTrend Multi-Timeframe O indicador "GoTrend Multi-Timeframe" é uma ferramenta essencial para traders que buscam uma maneira rápida e eficiente de avaliar as tendências gerais e específicas de um par de moedas em diferentes intervalos de tempo. Este indicador permite que os traders obtenham uma visão clara e abrangente da direção do mercado num piscar de olhos, otimizando a tomada de decisões e aprimorando a eficácia de suas estratégias de negociação. Principais Características: Anális
Inferno Signals EA
Martin Alejandro Bamonte
Inferno Signals EA foi projetado para aproveitar os movimentos mais significativos do mercado, operando no sólido timeframe M30. É ideal para aqueles que desejam começar com um investimento inicial pequeno, começando com apenas $100 por par, com uma gestão automática de capital que inclui ajustes dinâmicos de lotes e níveis de segurança como Stop-Loss (SL). Com baixo rebaixamento (drawdown) e uma estratégia focada em capturar as melhores oportunidades, Inferno Signals EA visa maximizar os retorn
MarketPrice Indicator
Martin Alejandro Bamonte
The MarketPrice Indicator is designed to provide a quick, one-glance visualization of the trend direction for a currency pair across all time frames (Time Frames), streamlining decision-making. MarketPrice Indicator is based on daily levels and trading signals derived from moving average crossovers and market strength according to various technical indicators. It comes fully configured, though you can, of course, modify any parameters as desired. Indicator Logic The indicator uses a combination
Hit Rate Top Bottom Signal
Martin Alejandro Bamonte
Hit Rate Top Bottom Signal Hit Rate Top Bottom Signal Hit Rate Top Bottom Signal oferece uma abordagem completamente inovadora. É ideal para aqueles que desejam avaliar previamente como o sinal funciona com um TP-SL específico e em quais PARES/TFs ele apresenta melhor desempenho. A estratégia Hit Rate Top Bottom Signal é uma ferramenta fundamental para qualquer trader e qualquer tipo de trading porque não só emite sinais precisos e sem repaint , indicando claramente quando operar e em qual direç
Last 50 Pips
Martin Alejandro Bamonte
O indicador Last 50 Pips foi projetado para identificar rapidamente oportunidades de compra e venda com base no comportamento recente dos preços. Ele mede a variação de preço nas últimas velas para destacar em amarelo os momentos em que o preço pode estar mudando de direção. Sinal de compra: Deve abrir uma posição de COMPRA quando o indicador muda de VERMELHO para AMARELO , sugerindo uma mudança de uma tendência de baixa para uma de alta. Por favor, veja as imagens para entender como é simples.
FlashPoints Breakout
Martin Alejandro Bamonte
Todos os dias, no início do mercado, o Flashpoints Breakout revisará os níveis de pivô, suporte e resistência usando os dados do dia anterior (alta, baixa e fechamento) para calcular dois níveis de rompimento (de alta e de baixa). Dessa forma, você terá os novos níveis de entrada prontos logo pela manhã, junto com os valores de Take Profit (TP) e Stop Loss (SL), permitindo que você faça pedidos pendentes de Buy Stop ou Sell Stop sem cálculos adicionais. Com o Flashpoints Breakout , você pode faz
Buy Sell Magic Signal
Martin Alejandro Bamonte
BUYSELLMAGIC is a non-repainting signal-type trading indicator designed to precisely detect entry points in the market.  Features Reliable and permanent signals : BUYSELLMAGIC signals are final once the candle closes, ensuring they will not be modified or removed from the chart. This gives you the confidence of working with an indicator that keeps its signals stable and trustworthy. Comprehensive alerts : In addition to signals on the chart, you’ll receive notifications via email, pop-up alerts
Trade Insights Display
Martin Alejandro Bamonte
Trade Insights Display is the ideal companion for traders who want to operate with clarity and precision. This indicator provides real-time access to critical account data, such as: Balance Equity Margin Spread Swap Remaining time for the current candle . These data points are essential, regardless of the strategy or other indicators you use. Having this indicator always visible allows you to quickly assess your account status, the swap for each pair (helping you avoid high-cost trades), and the
Filtro:
Sem comentários
Responder ao comentário