• Visão global
  • Comentários (2)
  • Discussão
  • O que há de novo

Volumatic VIDyA MT4

5
Special offer: ALL TOOLS, just $35 each!

New tools will be $30 for the first week or the first 3 purchases

Trading Tools Channel on MQL5: Join my MQL5 channel to update the latest news from me

Volumatic VIDYA (Variable Index Dynamic Average) é um indicador avançado projetado para rastrear tendências e analisar a pressão de compra e venda em cada fase de uma tendência. Utilizando o Promédio Dinâmico de Índice Variável (Variable Index Dynamic Average) como técnica central de suavização dinâmica, esta ferramenta fornece informações críticas sobre as dinâmicas de preço e volume em níveis estruturais de mercado.

Veja a versão para MT5 em: Volumatic VIDyA MT5

Veja mais produtos em: Todos os Produtos

To use iCustom for EA, please see here: Create EA (iCustom) with VOLUMATIC VIDYA

Conceito Principal

O Volumatic VIDYA se destaca na identificação de tendências enquanto analisa a pressão de volume que as impulsiona. A linha VIDYA se adapta dinamicamente à força dos movimentos de preço, tornando-a mais responsiva e precisa do que médias móveis tradicionais, como SMA ou EMA.

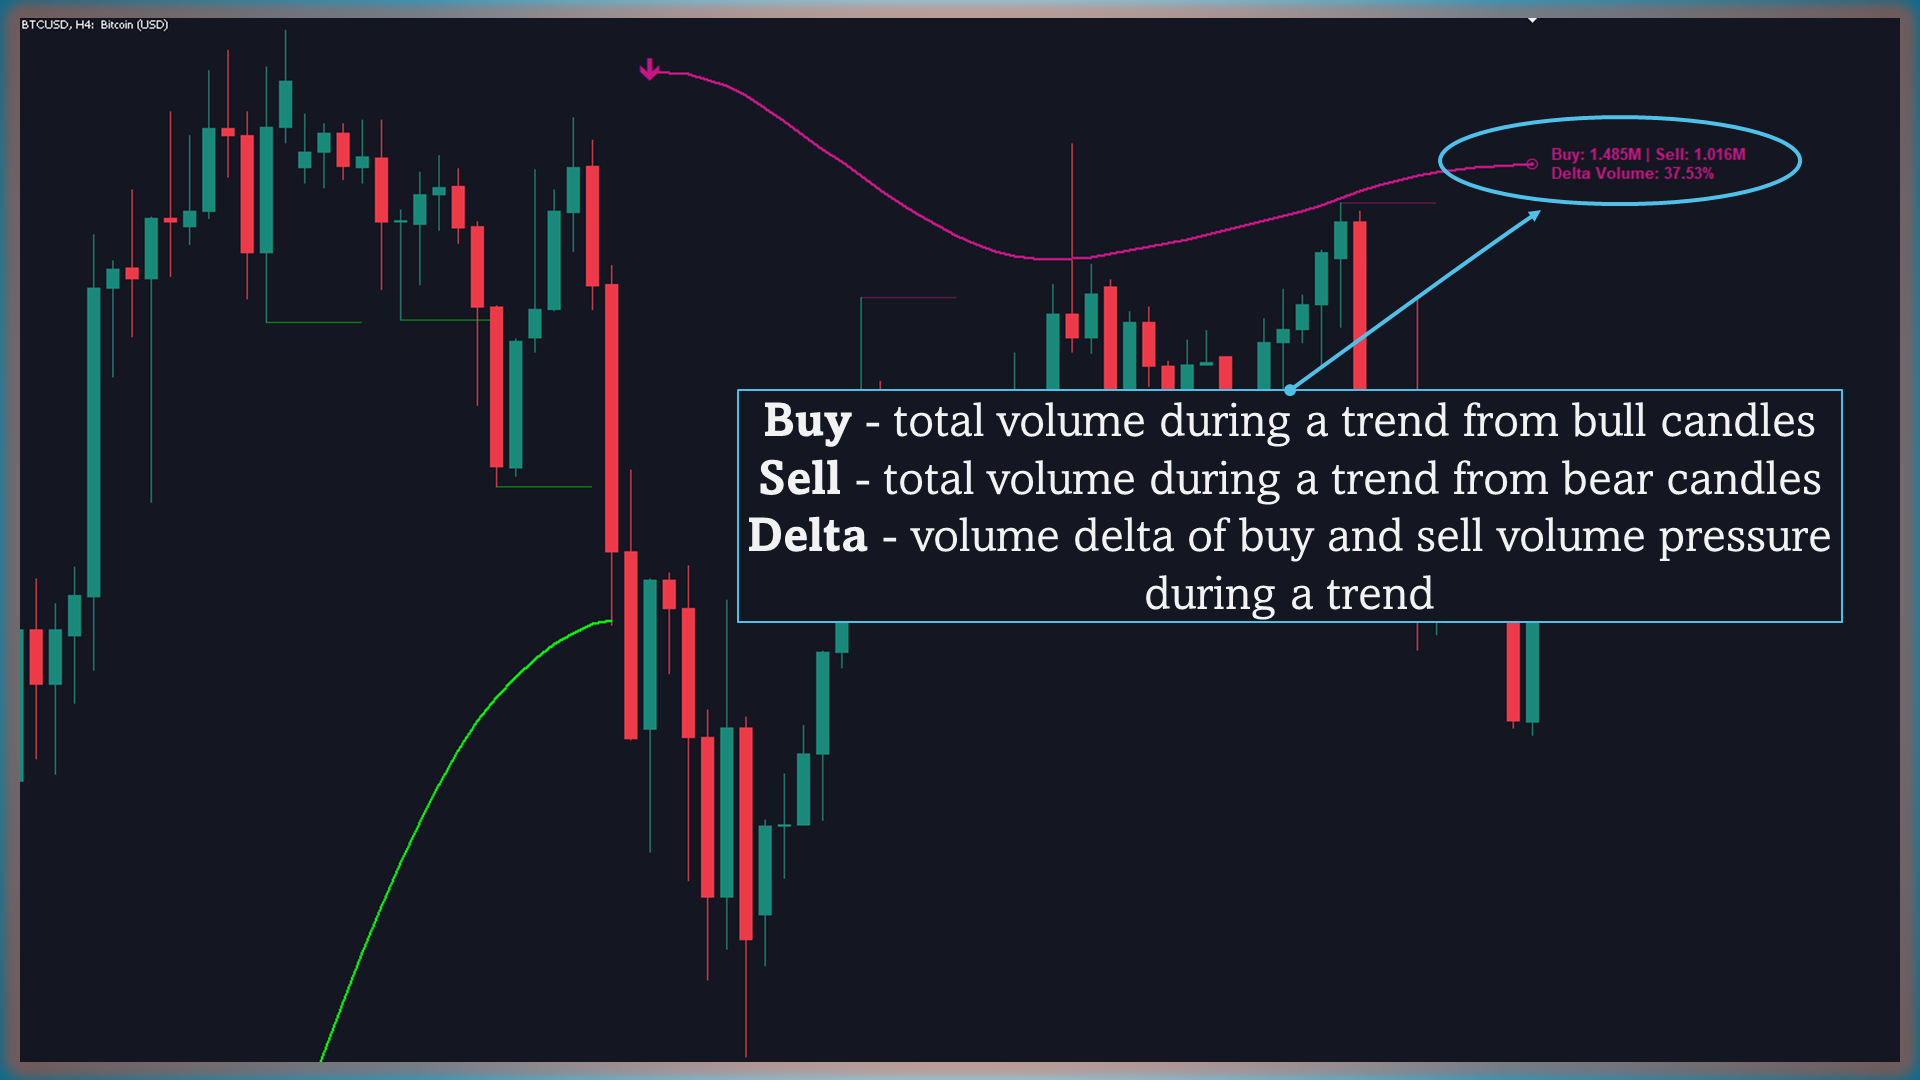
Além de detectar tendências, o Volumatic VIDYA calcula e visualiza a pressão de compra e venda, oferecendo uma perspectiva abrangente sobre a participação no mercado. Linhas horizontais desenhadas a partir de pivôs estruturais do mercado, aprimoradas com dados de volume, destacam níveis-chave de suporte e resistência.

Além disso, a funcionalidade de alertas garante que os traders estejam atualizados sobre os movimentos críticos do mercado, tornando o Volumatic VIDYA uma ferramenta de negociação proativa.

Características Principais

1. Cálculo Dinâmico de VIDYA

O VIDYA ajusta-se dinamicamente ao momento e à volatilidade do mercado utilizando o Oscilador de Momento de Chande (CMO). Isso permite:

  • Reagir rapidamente: Capturar mudanças rápidas no mercado com atraso mínimo.
  • Filtrar ruídos: Fornecer sinais claros mesmo em períodos de baixa volatilidade.
2. Sinais de Mudança de Tendência com Setas

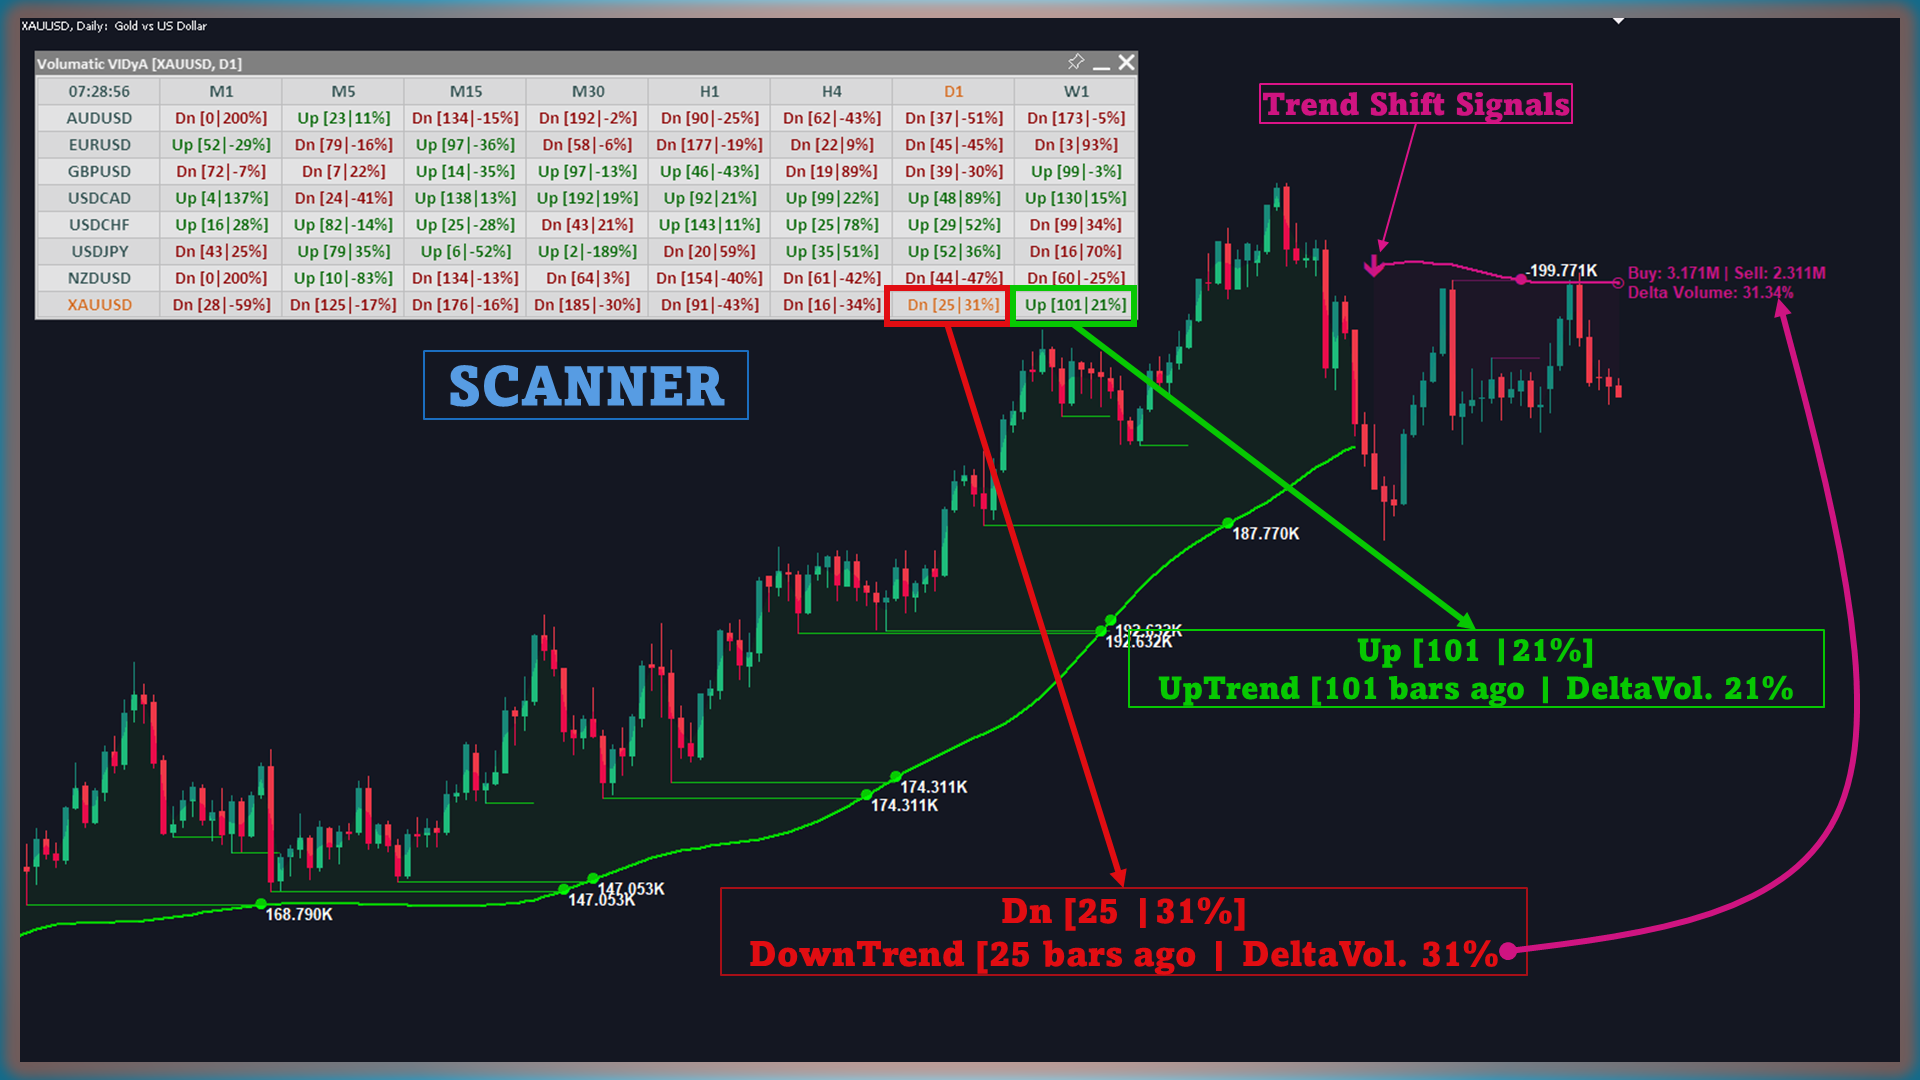
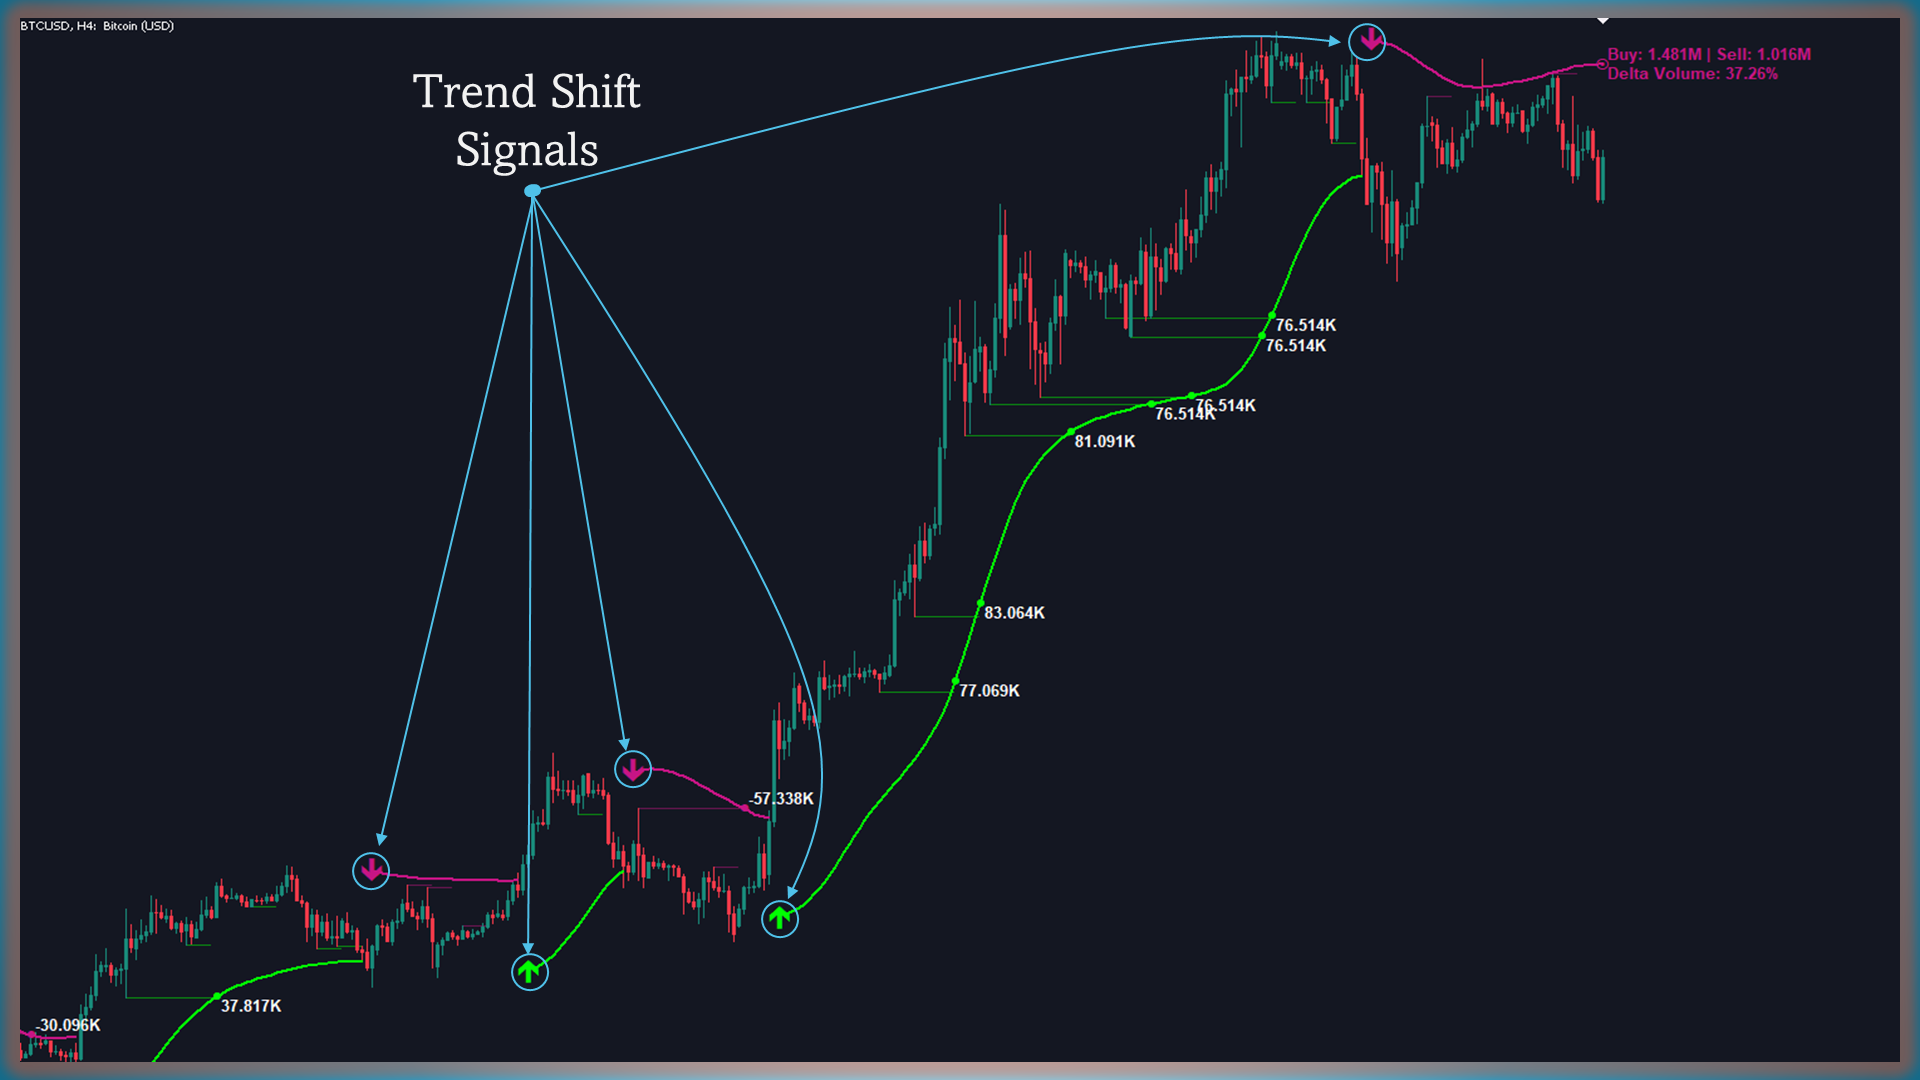
Para indicar reversões de tendência, o Volumatic VIDYA utiliza setas intuitivas:

  • Setas para cima: Indicam possíveis reversões de alta quando o preço cruza acima da linha VIDYA.
  • Setas para baixo: Sinalizam possíveis mudanças de baixa quando o preço cai abaixo da linha VIDYA.

Esses sinais são complementados por Alertas de Mudança de Tendência, notificando os traders em tempo real quando tais eventos ocorrem. Os alertas permitem ações oportunas, mesmo quando longe da tela, ajudando os traders a aproveitar oportunidades ou mitigar riscos.

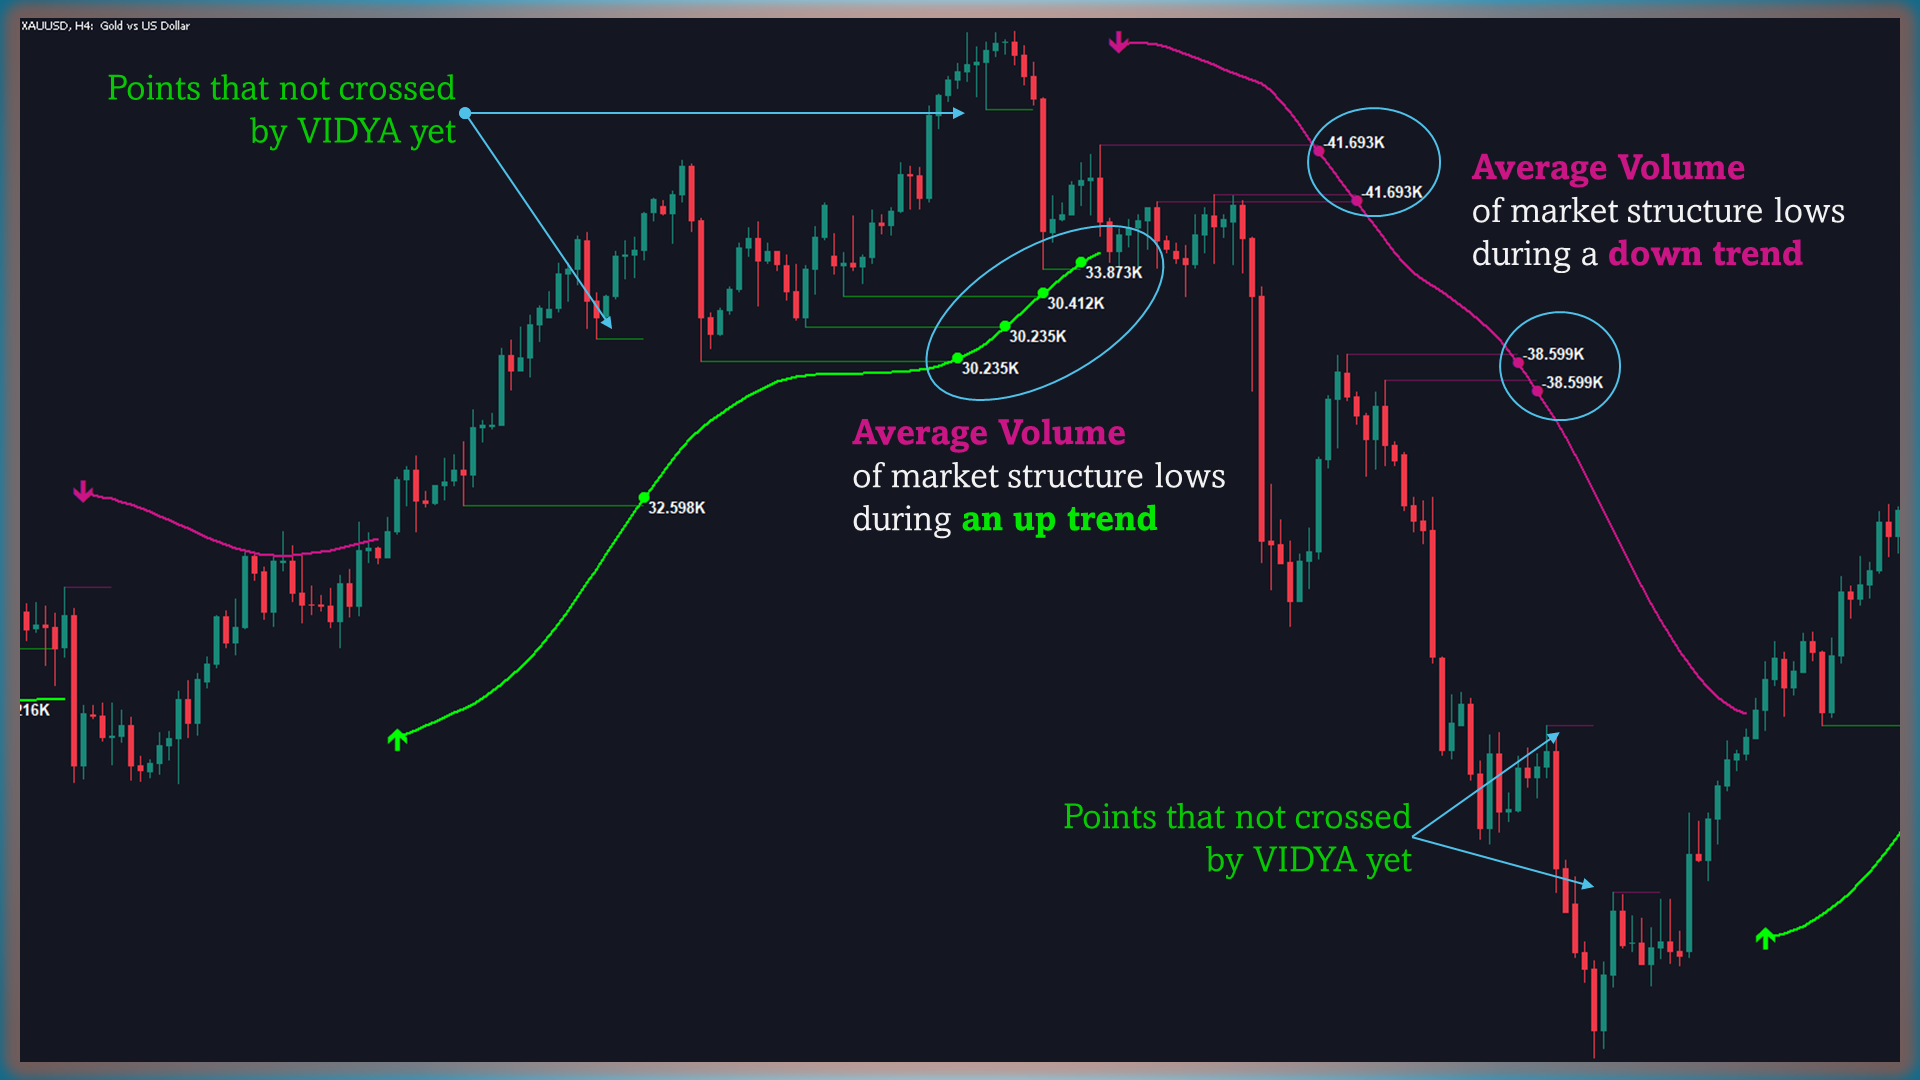
3. Linhas de Pivô Estrutural do Mercado com Rótulos de Volume

Os níveis de suporte e resistência são definidos por linhas horizontais desenhadas a partir de pivôs estruturais do mercado:

  • Linhas de liquidez horizontal: Desenhadas a partir de máximas e mínimas de preço, estendendo-se até serem rompidas.
  • Rótulos de volume: Mostram o volume médio dos últimos seis candles nesses níveis para maior clareza sobre a força do mercado.

Os Alertas de Linha de Liquidez Estendida notificam os traders quando esses níveis críticos são rompidos. Esse recurso é especialmente útil para:

  • Identificar possíveis rompimentos ou reversões.
  • Antecipar movimentos de preços próximos a níveis significativos de interesse.
  • Ajustar dinamicamente os níveis de stop-loss ou take-profit.
4. Alertas para Eventos Importantes de Mercado

O Volumatic VIDYA integra um sistema robusto de alertas para aumentar a eficiência na negociação:

  • Alertas de Mudança de Tendência: Acionados quando o preço cruza a linha VIDYA, marcando possíveis reversões de alta ou baixa.
  • Alertas de Linha de Liquidez Estendida: Notificam os traders quando o preço rompe acima ou abaixo de níveis pivô, sinalizando possíveis cenários de rompimento ou reversão.

Esses alertas são personalizáveis, permitindo notificações por e-mail, push ou som, garantindo que você esteja informado sem precisar monitorar os gráficos constantemente.
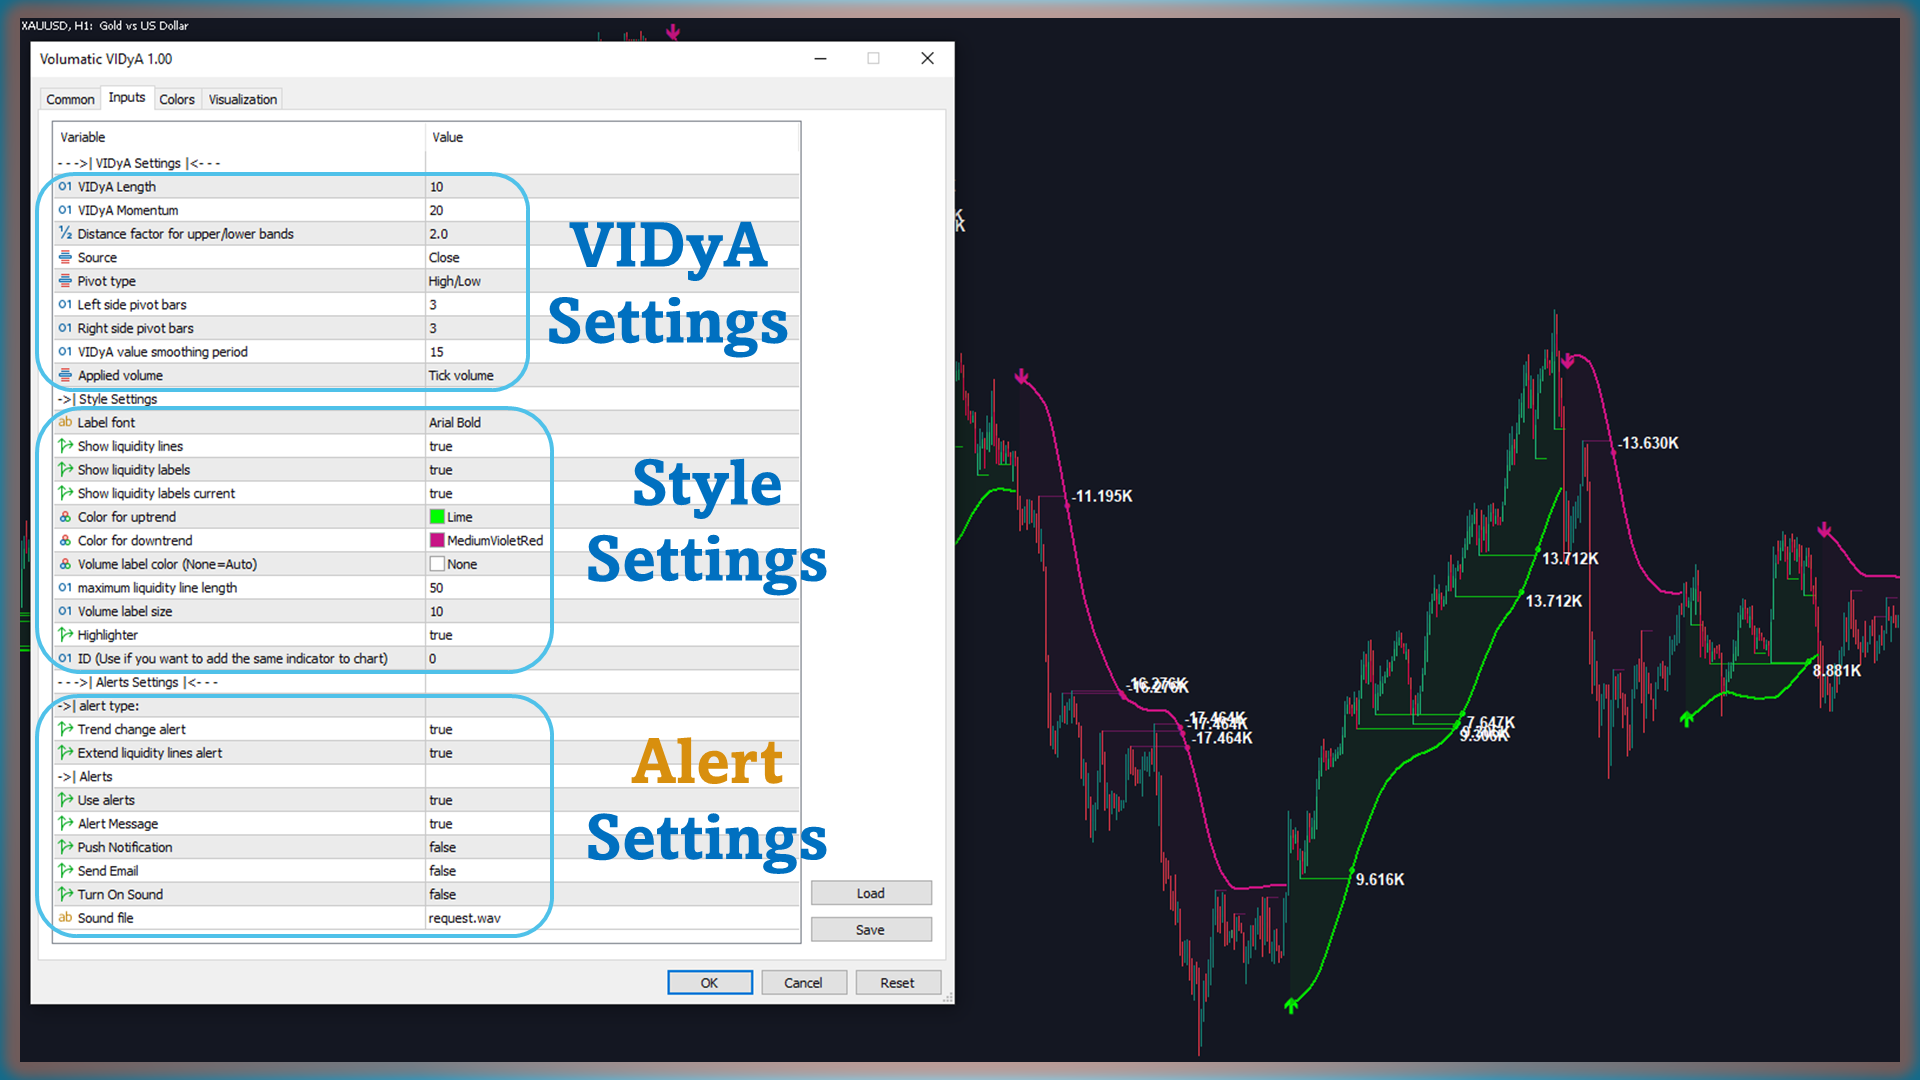
Opções de Personalização

O Volumatic VIDYA é altamente flexível, com opções para se adequar a diferentes estilos de negociação:

  • Configurações do VIDYA: Ajuste o comprimento e o momento para personalizar a resposta às tendências.
  • Sensibilidade na detecção de pivôs: Defina o número de candles usados para calcular pontos de pivô.
  • Preferências de alertas: Personalize as notificações para focar em eventos específicos do mercado, reduzindo distrações desnecessárias.
Como Usar o Volumatic VIDYA Eficazmente
  1. Monitore tendências: Use a linha VIDYA para rastrear a direção do mercado e alinhar sua estratégia.
  2. Analise a pressão de volume: Utilize o delta de volume para confirmar a força da tendência ou identificar reversões.
  3. Planeje em torno das linhas de liquidez: Use os níveis de pivô e alertas associados para identificar áreas de rompimento ou suporte.
  4. Habilite alertas: Automatize o monitoramento para economizar tempo enquanto permanece informado sobre mudanças importantes.
Por Que Escolher o Volumatic VIDYA?

Combinando rastreamento dinâmico de tendências, análise de volume e alertas proativos, o Volumatic VIDYA destaca-se como uma ferramenta abrangente de negociação. Seja para scalping, swing trading ou posições de longo prazo, este indicador oferece:

  • Adaptabilidade dinâmica: Captura tendências de maneira eficaz em mercados voláteis.
  • Insights de volume: Adiciona contexto aos movimentos de preço para decisões mais informadas.
  • Alertas em tempo real: Mantém você informado sobre eventos importantes sem monitoramento constante.

Fique à frente no mercado com Volumatic VIDYA, seu parceiro definitivo para dominar tendências, volumes e negociações proativas!


Comentários 2
Nikodem Dobrzynski
278
Nikodem Dobrzynski 2025.01.24 18:22 
 

Volumatic VIDyA is a very useful indicator that combines both trend and volume indications. When combined with other technical analysis indicators, it can be a great tool in your strategy. Niko.

XANKEEZ
414
XANKEEZ 2025.01.03 09:42 
 

VIDYA is a unique indicator that combines trend and volume analysis. for best results, use it with other indicators like RSI or ADX. the author keeps updating and making it better each time.

Produtos recomendados
SMC System MT4
Duc Hoan Nguyen
5 (1)
Special offer : ALL TOOLS , just $35 each! New tools   will be   $30   for the   first week   or the   first 3 purchases !  Trading Tools Channel on MQL5 : Join my MQL5 channel to update the latest news from me SMC é uma abordagem de trading que ajuda os traders a identificar zonas de liquidez, posições institucionais e pontos de reversão importantes no mercado. Ao aproveitar os princípios do SMC, os traders podem navegar pelo mercado de forma mais eficaz, encontrando entradas e saídas ideais.
Special offer : ALL TOOLS , just $35 each! New tools   will be   $30   for the   first week   or the   first 3 purchases !  Trading Tools Channel on MQL5 : Join my MQL5 channel to update the latest news from me Visão Geral OA SnR Power é uma ferramenta poderosa projetada para ajudar traders a identificar e avaliar a força dos níveis de suporte e resistência. Incorporando fatores-chave como volume de negociação, frequência de rebote e número de testes, este indicador fornece uma visão abrangent
FREE
Fibonacci calculator is used with Elliot Waves, it can generate remarkable results. A trader could use these levels or ratios to find high probability trades with very small stop loss. You may also use these ratios to find Elliott Waves extensions and to book profit near those levels. For Elliot Wave experts, Fibonacci calculator is a highly useful tool that can assist them in calculating Fibonacci extension and retracement levels for the market price. The indicator proves itself as a useful one
Introduction to X3 Chart Pattern Scanner X3 Cherart Pattern Scanner is the non-repainting and non-lagging indicator detecting X3 chart patterns including Harmonic pattern, Elliott Wave pattern, X3 patterns, and Japanese Candlestick patterns. Historical patterns match with signal patterns. Hence, you can readily develop the solid trading strategy in your chart. More importantly, this superb pattern scanner can detect the optimal pattern of its kind. In addition, you can switch on and off individu
Indicator Fibonacci SR Este indicador cria linhas de suporte e resistência. É baseado nos níveis de Retração e Extensão Fibonacci. Baseado nos níveis Fibonacci, verifica as combinações possíveis e desenha linhas de suporte/resistência. Este indicador também utiliza topos e fundos desenhados pelo indicador ZigZag em seus cálculos. O ZigZag também pode ser desenhado no gráfico, se necessário. O indicador considera muitas combinações de pontos de reversão anteriores e a proporção dos níveis Fibonac
FREE
I just sell my products in Elif Kaya Profile , any other websites are stolen old versions, So no any new updates or support. - Lifetime update free -   Real price is 80$   - 40% Discount ( It is 49$ now ) Contact me for instruction, any questions! Related Product:  Gold Expert  ,  Professor EA - Non-repaint Introduction Flag patterns are an important tool for technical traders in the stock market. When interpreting a flag pattern, it is important to wait for the pattern to pick a direction b
Ratio market
Aleksandr Krokhalev
4.33 (15)
Volatility under control. The indicator shows the optimal depth for setting goals within the day and on the average trend. It also builds pivot zones for the estimated correction depth. As an accompaniment, the key levels of the structure are displayed for several timeframes. Classical volatility indicators ATR & ADX on fixed timeframes are used for calculation. The calculation takes into account the spread, and if the market is slightly volatile, you will see a warning about the risk. You can c
FREE
NO REPAINT ADVANCED CHART PATTERN INDICATOR By definition, a price ( chart)  pattern is a recognizable configuration of price movement that is identified using a series of  trendlines  and/or curves. When a price pattern signals a change in trend direction, it is known as a reversal pattern; a continuation pattern occurs when the trend continues in its existing direction following a brief pause. Advanced Chart Pattern Tracker is designed to find the MOST ACCURATE patterns. A special script is a
This indicators automatically draws the Support and resistances levels for you once you've dropped it on a chart.  It reduces the hustle of drawing and redrawing these levels every time you analysis prices on a chart. With it, all you have to do is dropped it on a chart, adjust the settings to your liking and let the indicator do the rest.  But wait, it gets better; the indicator is absolutely free!  Get the new and improved version here:  https://youtu.be/rTxbPOBu3nY Parameters Time-frame  -> T
FREE
Indicador Crypto_Forex "Padrão do Enforcado" para MT4. - O indicador "Padrão do Homem Enforcado" é um indicador muito poderoso para a negociação de Acção de Preço: sem repintura, sem atraso. - O indicador deteta padrões de baixa do Hanging Man no gráfico: sinal de seta vermelha no gráfico (ver imagens). - Com alertas para PC, telemóvel e e-mail. - O indicador "Padrão do Homem Enforcado" é excelente para corresponder aos Níveis de Suporte/Resistência. // Os grandes robôs de negociação e indica
Introduction Harmonic Patterns are best used to predict potential turning point. Traditionally, Harmonic Pattern was identified manually connecting peaks and troughs points in the chart. Manual harmonic pattern detection is painfully tedious and not suitable for everyone. You are often exposed under subjective pattern identification with manual pattern detection. To avoid these limitations, Harmonic Pattern Plus was designed to automate your harmonic pattern detection process. The functionality
This indicator filters the Zigzag indicator to calculate the main support and resistance levels. Variables minimum gap between peaks : is the distance (GAP) between the peaks of the Zigzag peaks sensitivity : Minimum number of nearby peaks look back: it means that it has to test the last 50 peaks in the Zigzag object name perfix: a prefix for level’s line name on chart
FREE
Description: The indicator measures, through the zigzag indicator, the levels of trend or correction. It shows in the chart the levels of each low or high detected. KEY LINKS:   How to Install  –  Frequent Questions  -  All Products  How is this indicator useful? This indicator determines, depending on Zigzag parameter if a trend is beginning, developing, or ending This indicator determines the direction of the trend Components Levels as positive or negative numbers, depending on the direction
FREE
The Penta-O is a 6-point retracement harmonacci pattern which usually precedes big market movements. Penta-O patterns can expand and repaint quite a bit. To make things easier this indicator implements a twist: it waits for a donchian breakout in the right direction before signaling the trade. The end result is an otherwise repainting indicator with a very reliable trading signal. The donchian breakout period is entered as an input. [ Installation Guide | Update Guide | Troubleshooting | FAQ | A
Este indicador irá desenhar os seguintes níveis: Linha aberta diária: abaixo está o mercado de baixa, acima está de alta. Faixa média diária alta e baixa Mercado asiático alto e baixo Alto e baixo de ontem Esses níveis são fortes níveis de suporte e resistência aos quais todos precisam prestar atenção. Se você não aproveitou o tempo para começar! Você precisa prestar atenção quando o preço estiver próximo desses níveis! Aproveite a negociação mais fácil!
FREE
-   Real price is 80$   - 40% Discount ( It is 49$ now ) - Lifetime update free Contact me for instruction, add group and any questions! Related Products:  Bitcoin Expert , Gold Expert - Non-repaint - I just sell my products in Elif Kaya profile, any other websites are stolen old versions, So no any new updates or support. Introduction The breakout and retest strategy is traded support and resistance levels. it involves price breaking through a previous level.  The break and retest strategy is
Swing Reader
Francesco Rubeo
5 (1)
Read Elliott wave principle automatically. With the Swing Reader, you can easily read the Elliott Wave Principle through an automatic system. With swing, we mean a ZigZag market that is created by a breakout of its standard deviation. You can set the deviation manually, or you can let the indicator do it automatically (setting the deviation to zero). Advantages you get Never repaints. Points showing a horizontal line, in which statistically a long wave ends. Candles showing a vertical line in
Elliott Wave Trend was designed for the scientific wave counting. This tool focuses to get rid of the vagueness of the classic Elliott Wave Counting using the guideline from the template and pattern approach. In doing so, firstly Elliott Wave Trend offers the template for your wave counting. Secondly, it offers Wave Structural Score to assist to identify accurate wave formation. It offers both impulse wave Structural Score and corrective wave Structure Score. Structural Score is the rating to sh
This indicator Super Channel Pro indicator.Indicator displays trend movement. Indicator calculates automatically line. Features FiltPer - displays indicator channel period. deviation - displays indicator channel deviation. deviation2 - displays indicator channel deviation. How to understand the status: If the arrow is green, trend is up. If the arrow is red, trend is down. ///////////////////////////////////////////////////////////////////////////////////////////////////////////////////////////
CyberZingFx Volume Plus
Afsal Meerankutty
4.93 (15)
Advanced version of CyberZingFx Volume Plus, the ultimate MT4 indicator for traders seeking highly accurate buy and sell signals. With an additional strategy and price action dot signals that enhances its effectiveness, this indicator offers a superior trading experience for professionals and beginners alike. The CyberZingFx Volume Plus Advanced version combines the power of volume analysis and historical price data with an additional strategy, resulting in even more precise and reliable signals
Pivot levels Auto V1
Hafis Mohamed Yacine
What Is a Pivot Point? A pivot point is a technical analysis indicator, or calculations, used to determine the overall trend of the market over different time frames. The pivot point itself is simply the average of the intraday high and low, and the closing price from the previous trading day. On the subsequent day, trading above the pivot point is thought to indicate ongoing bullish sentiment, while trading below the pivot point indicates bearish sentimen How to Use Pivot Points The very ess
Auto Levels
Yaroslav Varankin
Auto Level this tool is able to determine the levels of support and resistance. search and display when the price has broken through the level and when it pushed off from it. the indicator can be useful if you use resistance support levels in your trading. or the highs and lows of the price, then it will greatly simplify your work and help you more quickly and more accurately determine the rebound or breakdown of the current trend or tendencies level. blue line bottom uptrend red line on top dow
Free automatic Fibonacci is an indicator that automatically plots a Fibonacci retracement based on the number of bars you select on the BarsToScan setting in the indicator. The Fibonacci is automatically updated in real time as new highest and lowest values appears amongst the selected bars. You can select which level values to be displayed in the indicator settings. You can also select the color of the levels thus enabling the trader to be able to attach the indicator several times with differe
FREE
The indicator displays Renko bars on the chart, uses them to plot the ZigZag - trend lines connecting the local Lows and Highs of the price movement, and highlights them based on the Gartley patterns, showing the potential price reversal points. Renko - specialized display of the price action, in which the graph is displayed not every bar of the time frame, but only under the condition that the price had passed more than the specified number of points. Renko bars are not bound to a time frame, s
UPD1 Fibo Levels
Vitaliy Kuznetsov
5 (1)
O indicador analisa o número especificado de velas e traça os níveis de Fibonacci com base no máximo-mínimo. Como os níveis estão se reorganizando, estamos interessados ​​no lado direito da faixa. Os ímãs de preço aos níveis e reagem ao toque. Use esta ferramenta para encontrar um ponto de entrada de tendência após uma correção. Se à esquerda vemos que os níveis aumentaram perfeitamente, podemos supor que encontramos o fim do movimento no ponto extremo. Todas as linhas são desenhadas por meio de
FREE
The indicator is designed for determining Fibonacci levels. Does not repaint/redraw The blue level shows the zero Fibonacci value (it is also the Pivot level) Red levels show calculated Fibonacci levels (used as a rollback or reversal point) Automatic period detection (periods can be entered manually) Adjustable display calculation method. Settings BarsHistory - the number of bars to be used to display the indicator. Method - method of calculation. AutoPeriod - automated period calculation (true
This is a simple and efficient indicator based on market logic. The indicator creates a range chosen by a trader. Trader selects only two parameters. The first one is the number of candles that define the frame. The second one is the number of candles needed for confirmation frame. The indicator shows all situations in history and works with the actual movement of the market. The indicator works on all timeframes . You are not limited by use of different timeframes, the indicator is able to adap
This is a well-known ZigZag indicator. But it differs by the fact that its plot is based on values of the middle line which is set by a user. It can display Andrews’ Pitchfork and standard or Bobokus Fibo levels. NO REPAINTING. Parameters Period МА — middle line period. Default value is 34. Minimum value is 4. Maximum value is set at your discretion. Used to calculate price - base price to calculate the middle line. The averaging method - method of smoothing the middle line. Turning pitchfork —
Expert Advisor designed for trading Engulfing Candle Patterns within a manually input price range the D point of harmonic patterns , gartley , bat cypher butterfly ect.  This is the  full version , word test in the title is an error How Does It Work Step 1 Identify a price range around the end point D of your harmonic pattern. Input two prices into the EA settings   Inp9 Upper Level- type the highest price where an engulfing candle pattern can occur. Inp9 Lower Level - type the lowest price whe
FREE
American Hunters
Mehmet Ozhan Hastaoglu
This indicator guides you like a hunter. Tacheprofit and StopLoss levels. See the difference in the experiment. Works in all periods. Works at all rates. You can win with this system. The crossing of the mean and the re-test were done according to the rule. You can see the transactions by moving backwards on the strategy test screen. The whole system is automatically calculated.
Os compradores deste produto também adquirem
Gann Made Easy
Oleg Rodin
4.8 (113)
Gann Made Easy é um sistema de negociação Forex profissional e fácil de usar, baseado nos melhores princípios de negociação usando a teoria do sr. W. D. Gann. O indicador fornece sinais precisos de COMPRA e VENDA, incluindo níveis de Stop Loss e Take Profit. Você pode negociar mesmo em movimento usando notificações PUSH. Entre em contato comigo após a compra! Vou compartilhar minhas dicas de negociação com você e ótimos indicadores de bônus de graça! Provavelmente você já ouviu muitas vezes sobr
Dynamic Forex28 Navigator
Bernhard Schweigert
5 (4)
Dynamic Forex28 Navigator - A ferramenta de negociação Forex de última geração. ATUALMENTE 49% DE DESCONTO. Dynamic Forex28 Navigator é a evolução dos nossos indicadores populares de longa data, combinando o poder de três em um: Indicador Advanced Currency Strength28 (695 avaliações) + Advanced Currency IMPULSE com ALERTA (520 avaliações) + Sinais CS28 Combo (Bônus). Detalhes sobre o indicador https://www.mql5.com/en/blogs/post/758844 O que o Next-Generation Strength Indicator oferece?  Tudo
Gold Stuff
Vasiliy Strukov
4.86 (251)
Gold Stuff-um indicador de tendência projetado especificamente para o ouro, também pode ser usado em qualquer instrumento financeiro. O indicador não é redesenhado ou atrasado. O timeframe recomendado é H1. O EA Gold Stuff Expert Advisor está escrito neste indicador, você pode encontrá-lo no meu perfil. Importante! Entre em contato comigo imediatamente após a compra para obter instruções e bônus!  Você pode obter uma cópia gratuita do nosso indicador Strong Support e Trend Scanner, envie uma
Scalper Inside PRO
Alexey Minkov
4.76 (63)
!SPECIAL SALE! An exclusive indicator that utilizes an innovative algorithm to swiftly and accurately determine the market trend. The indicator automatically calculates opening, closing, and profit levels, providing detailed trading statistics. With these features, you can choose the most appropriate trading instrument for the current market conditions. Additionally, you can easily integrate your own arrow indicators into Scalper Inside Pro to quickly evaluate their statistics and profitability
Gold Venamax MT4
Sergei Linskii
5 (1)
Gold Venamax   - este é o melhor indicador técnico de ações. O algoritmo do indicador analisa o movimento do preço de um ativo e reflete a volatilidade e as zonas de entrada potenciais. Recursos do indicador: Este é um super indicador com Magic e dois blocos de setas de tendência para uma negociação confortável e lucrativa. O botão vermelho para alternar blocos é exibido no gráfico. Magic é definido nas configurações do indicador, para que você possa instalar o indicador em dois gráficos exib
Lux Trend
Mohamed Hassan
5 (3)
After purchase, please contact me to get your trading tips + more information for a great bonus!   Lux Trend is a professional strategy based on using Higher Highs and Lower Highs to identify and draw Trendline Breakouts! Lux Trend  utilizes two Moving Averages to confirm the overall trend direction before scanning the market for high-quality breakout opportunities, ensuring more accurate and reliable trade signals. This is a proven trading system used by real traders worldwide, demonstrating
Currency Strength Wizard é um indicador muito poderoso que fornece uma solução completa para uma negociação bem-sucedida. O indicador calcula o poder deste ou daquele par forex usando os dados de todas as moedas em vários intervalos de tempo. Esses dados são representados em uma forma de índice de moeda fácil de usar e linhas de energia de moeda que você pode usar para ver o poder desta ou daquela moeda. Tudo o que você precisa é anexar o indicador ao gráfico que deseja negociar e o indicador mo
FX Levels MT4
Daniel Stein
5 (2)
FX Levels: Suporte e Resistência com Precisão Excepcional para Todos os Mercados Visão Geral Rápida Procurando um meio confiável de identificar níveis de suporte e resistência em qualquer mercado—incluindo pares de moedas, índices, ações ou commodities? FX Levels combina o método “Lighthouse” tradicional com uma abordagem dinâmica de vanguarda, fornecendo uma precisão quase universal. Baseado em nossa experiência real com corretores e em atualizações automáticas diárias mais as de tempo real,
O sistema PRO Renko é um sistema de negociação altamente preciso especialmente concebido para a negociação de gráficos RENKO. Trata-se de um sistema universal que pode ser aplicado a vários instrumentos de negociação. O sistema neutraliza eficazmente o chamado ruído de mercado, dando-lhe acesso a sinais de inversão precisos. O indicador é muito fácil de usar e tem apenas um parâmetro responsável pela geração de sinal. Você pode facilmente adaptar a ferramenta a qualquer instrumento de negocia
Golden Trend Indicator
Noha Mohamed Fathy Younes Badr
4.9 (10)
Golden Trend indicator  is The best indicator for predicting trend movement this indicator never lags and never repaints and never back paints    and give  arrow buy and sell    before the candle appear  and it will help you and  will make your trading decisions clearer its work on all currencies and  gold and crypto and all time frame This unique  indicator uses very secret algorithms to catch the  trends, so you can trade using this indicator and see the trend clear on charts  manual guide and
Scalper Vault
Oleg Rodin
5 (29)
Scalper Vault é um sistema profissional de escalpelamento que fornece tudo o que você precisa para um escalpelamento bem-sucedido. Este indicador é um sistema de negociação completo que pode ser usado por comerciantes de forex e opções binárias. O período de tempo recomendado é M5. O sistema fornece sinais de seta precisos na direção da tendência. Ele também fornece sinais superiores e inferiores e níveis de mercado Gann. Os indicadores fornecem todos os tipos de alertas, incluindo notificações
Trend Screener
STE S.S.COMPANY
4.78 (93)
Indicador de tendência, solução única inovadora para negociação e filtragem de tendências com todos os recursos de tendências importantes construídos dentro de uma ferramenta! É um indicador multi-timeframe e multi-moedas 100% sem repintura que pode ser usado em todos os símbolos/instrumentos: forex, commodities, criptomoedas, índices e ações. OFERTA POR TEMPO LIMITADO: O indicador Support and Resistance Screener está disponível por apenas US$ 50e vitalício. (Preço original US$ 250) (oferta este
MTF Supply Demand Zones
Georgios Kalomoiropoulos
4.83 (23)
Próxima geração de zonas automatizadas de oferta e demanda. Algoritmo novo e inovador que funciona em qualquer gráfico. Todas as zonas estão sendo criadas dinamicamente de acordo com a ação do preço do mercado. DOIS TIPOS DE ALERTAS --> 1) QUANDO O PREÇO ATINGE UMA ZONA 2) QUANDO UMA NOVA ZONA É FORMADA Você não recebe mais um indicador inútil. Você obtém uma estratégia de negociação completa com resultados comprovados.     Novas características:     Alertas quando o preço atinge a zona d
IX Power MT4
Daniel Stein
4.71 (7)
IX Power: Descubra informações de mercado para índices, commodities, criptomoedas e forex Visão Geral IX Power é uma ferramenta versátil projetada para analisar a força de índices, commodities, criptomoedas e símbolos de forex. Enquanto o FX Power oferece a máxima precisão para pares de moedas ao utilizar dados de todos os pares disponíveis, o IX Power foca exclusivamente nos dados do mercado do símbolo subjacente. Isso torna o IX Power uma excelente escolha para mercados fora do forex e uma o
Easy Breakout
Mohamed Hassan
5 (9)
After your purchase, feel free to contact me for more details on how to receive a bonus indicator called VFI, which pairs perfectly with Easy Breakout for enhanced confluence!   Easy Breakout is a powerful price action trading system built on one of the most popular and widely trusted strategies among traders: the Breakout strategy ! This indicator delivers crystal-clear Buy and Sell signals based on breakouts from key support and resistance zones. Unlike typical breakout indicators, it levera
Smart Set up Levels
Mohit Dhariwal
5 (1)
Smart Set up leve l is a very powerful indicator based on the concept of order blocks and set up entries with proper fvg and breakouts to make a very nice level to enter like a pro trader. Very easy to use interface and friendly to enter on buy and sell signals. Works Best on M15 Time frame on Gold, Bitcoin and Fx pairs. Daily 4-5 trades on each pair  Works great on gold like a pro on M15 It is non repainting nor lagging It is very powerful indicator giving precise entries and prop acts can be c
FX Volume
Daniel Stein
4.59 (34)
FX Volume: Vivencie o Verdadeiro Sentimento de Mercado sob a Perspectiva de um Corretor Visão Geral Rápida Quer aprimorar sua abordagem de trading? FX Volume fornece insights em tempo real sobre como traders de varejo e corretores estão posicionados—bem antes de relatórios atrasados como o COT. Seja para buscar ganhos consistentes ou simplesmente ter uma vantagem mais clara no mercado, FX Volume ajuda você a detectar grandes desequilíbrios, confirmar rompimentos e aperfeiçoar sua gestão de ris
Tendência do ouro   - este é um bom indicador técnico de acções. O algoritmo do indicador analisa o movimento do preço de um ativo e reflecte a volatilidade e as potenciais zonas de entrada. Os melhores sinais do indicador: - Para VENDER = histograma vermelho + ponteiro SHORT vermelho + seta de sinal amarelo na mesma direção. - Para COMPRAR = histograma azul + ponteiro LONGO azul + seta de sinal aqua na mesma direção. Vantagens do indicador: 1. O indicador produz sinais com elevada precis
Beast Super Signal
Dustin Vlok
4.73 (89)
Procurando por um poderoso indicador de negociação forex que possa ajudá-lo a identificar oportunidades de negociação lucrativas com facilidade? Não procure mais do que o Beast Super Signal. Este indicador baseado em tendências fácil de usar monitora continuamente as condições do mercado, procurando por novas tendências em desenvolvimento ou aproveitando as já existentes. O Beast Super Signal dá um sinal de compra ou venda quando todas as estratégias internas se alinham e estão em 100% de conflu
Apresentamos o ON Trade Waves Patterns Harmonic Elliot Wolfe, um indicador avançado projetado para detectar diversos tipos de padrões no mercado, usando métodos manuais e automáticos. Aqui está como ele funciona: Padrões Harmônicos: Este indicador pode identificar padrões harmônicos que aparecem em seu gráfico. Esses padrões são essenciais para traders que praticam a teoria de negociação harmônica, conforme popularizada no livro de Scott Carney "Harmonic Trading vol 1 e 2". Seja desenhando-os m
System Trend Pro
Aleksandr Makarov
5 (2)
System Trend Pro - This is the best trend trading indicator!!! The indicator no repaint!!!  The indicator has   MTF   mode, which adds confidence to trading on the trend (   no repaint   ). How to trade? Everything is very simple, we wait for the first signal (big arrow), then wait for the second signal (small arrow) and enter the market in the direction of the arrow. (See screens 1 and 2.) Exit on the opposite signal or take 20-30 pips, close half of it, and keep the rest until the opposite s
M1 Arrow
Oleg Rodin
5 (16)
Uma estratégia intradiária baseada em dois princípios fundamentais do mercado. O algoritmo é baseado na análise de volumes e ondas de preços usando filtros adicionais. O algoritmo inteligente do indicador dá um sinal apenas quando dois fatores de mercado se combinam em um. O indicador calcula ondas de um determinado intervalo no gráfico M1 usando os dados do período de tempo mais alto. E para confirmar a onda, o indicador utiliza a análise por volume. Este indicador é um sistema de negociação pr
FX Power MT4 NG
Daniel Stein
4.94 (18)
FX Power: Analise a Força das Moedas para Decisões de Negociação Mais Inteligentes Visão Geral FX Power é a sua ferramenta essencial para compreender a força real das principais moedas e do ouro em quaisquer condições de mercado. Identificando moedas fortes para comprar e fracas para vender, FX Power simplifica as decisões de negociação e revela oportunidades de alta probabilidade. Quer você prefira seguir tendências ou antecipar reversões usando valores extremos de Delta, esta ferramenta adap
Advanced Supply Demand
Bernhard Schweigert
4.91 (294)
Atualmente com 33% de desconto! A melhor solução para qualquer Trader Novato ou especialista! Este indicador é uma ferramenta de negociação exclusiva, de alta qualidade e acessível porque incorporamos uma série de recursos proprietários e uma nova fórmula. Com esta atualização, você poderá mostrar fusos horários duplos. Você não só será capaz de mostrar um TF mais alto, mas também mostrar ambos, o TF do gráfico, MAIS o TF mais alto: MOSTRANDO ZONAS ANINHADAS. Todos os traders de Oferta e Demanda
MetaBands M4
Vahidreza Heidar Gholami
5 (3)
MetaBands utiliza algoritmos poderosos e únicos para desenhar canais e detectar tendências, a fim de fornecer aos traders pontos potenciais para entrar e sair de negociações. É um indicador de canal mais um indicador de tendência poderoso. Inclui diferentes tipos de canais que podem ser mesclados para criar novos canais simplesmente usando os parâmetros de entrada. O MetaBands usa todos os tipos de alertas para notificar os usuários sobre eventos de mercado. Recursos Suporta a maioria dos algori
Enigmera
Ivan Stefanov
5 (7)
ENIGMERA: O núcleo do mercado Importante: A demonstração do MQL5.com funciona no Strategy Tester e pode não refletir completamente a funcionalidade do Enigmera. Verifique a descrição, as capturas de tela e o vídeo para mais detalhes. Fique à vontade para me enviar uma mensagem com qualquer dúvida! O código do indicador foi completamente reescrito. A versão 3.0 adiciona novas funcionalidades e corrige erros acumulados desde o início do indicador. Introdução Este indicador e sistema de negociação
O Apollo BuySell Predictor é um sistema de negociação profissional que inclui vários módulos de negociação. Ele fornece ao trader zonas de rompimento exclusivas, níveis de suporte e resistência baseados em fibonacci, linha de tendência de pivô, sinais de volume de recuo e outros recursos úteis que qualquer trader precisa diariamente. O sistema funcionará com qualquer par. Os prazos recomendados são M30, H1, H4. Embora o indicador também possa funcionar com outros prazos, exceto os prazos superio
Blahtech Supply Demand
Blahtech Limited
4.64 (36)
Was: $299  Now: $149   Supply Demand uses previous price action to identify potential imbalances between buyers and sellers. The key is to identify the better odds zones, not just the untouched ones. Blahtech Supply Demand indicator delivers functionality previously unavailable on any trading platform. This 4-in-1 indicator not only highlights the higher probability zones using a multi-criteria strength engine, but also combines it with multi-timeframe trend analysis, previously confirmed swings
Descubra o segredo da negociação forex bem -sucedida com nosso indicador MT4 personalizado! Você já se perguntou como obter sucesso no mercado de Forex, obtendo lucros consistentemente e minimizando o risco? Aqui está a resposta que você está procurando! Permita -nos apresentar nosso indicador proprietário do MT4 que revolucionará sua abordagem à negociação. Versatilidade única Nosso indicador foi projetado especialmente para usuários que preferem as formações de vela Renko e Rangebar. Entende
Supply Demand Analyzer
Suvashish Halder
5 (5)
Supply Demand Analyzer is an advanced trading indicator meticulously designed for the precise identification, analysis, and management of supply and demand zones. By integrating real-time data and advanced algorithms, this tool enables traders to recognize market phases, price movements, and structural patterns with unparalleled accuracy. It simplifies complex market dynamics into actionable insights, empowering traders to anticipate market behavior, identify trading opportunities, and make info
Mais do autor
Special offer : ALL TOOLS , just $35 each! New tools   will be   $30   for the   first week   or the   first 3 purchases !  Trading Tools Channel on MQL5 : Join my MQL5 channel to update the latest news from me Vamos começar pelos excelentes recursos: O EA está equipado com um FILTRO DE NOTÍCIAS e um FILTRO RSI. Baixo risco (alguns pares de moedas têm DrawDown <10%, até 5%). Este EA não utiliza qualquer função de martingale ou grid. O EA pode exibir zonas visuais para negociação manual, se dese
Special offer : ALL TOOLS , just $35 each! New tools   will be   $30   for the   first week   or the   first 3 purchases !  Trading Tools Channel on MQL5 : Join my MQL5 channel to update the latest news from me Apresentamos o revolucionário RSI Kernel Optimized com Scanner, uma ferramenta inovadora que redefine a análise tradicional do RSI ao integrar o poderoso algoritmo de Estimativa de Densidade Kernel (KDE). Este indicador avançado não apenas fornece informações em tempo real sobre as tendê
Special offer : ALL TOOLS , just $35 each! New tools   will be   $30   for the   first week   or the   first 3 purchases !  Trading Tools Channel on MQL5 : Join my MQL5 channel to update the latest news from me Desbloqueie o poder do conceito de Inversion Fair Value Gap (IFVG) de ICT com o Inversion Fair Value Gaps Indicator ! Esta ferramenta inovadora eleva os Fair Value Gaps (FVGs) a um novo nível, identificando e exibindo zonas de FVG invertidas — áreas-chave de suporte e resistência formada
Special offer : ALL TOOLS , just $35 each! New tools   will be   $30   for the   first week   or the   first 3 purchases !  Trading Tools Channel on MQL5 : Join my MQL5 channel to update the latest news from me O indicador Volumetric Order Blocks Multi Timeframe é uma ferramenta poderosa projetada para traders que buscam insights mais profundos sobre o comportamento do mercado, identificando áreas de preço chave onde participantes significativos do mercado acumulam ordens. Essas áreas, conhecid
Special offer : ALL TOOLS , just $35 each! New tools   will be   $30   for the   first week   or the   first 3 purchases !  Trading Tools Channel on MQL5 : Join my MQL5 channel to update the latest news from me O indicador Supertrend Fakeout é uma versão aprimorada do clássico indicador Supertrend , projetado para fornecer sinais de tendência mais confiáveis. Ao incorporar recursos avançados como Fakeout Index Limit e Fakeout ATR Mult , este indicador ajuda a filtrar reversões de tendência fals
FREE
Special offer : ALL TOOLS , just $35 each! New tools   will be   $30   for the   first week   or the   first 3 purchases !  Trading Tools Channel on MQL5 : Join my MQL5 channel to update the latest news from me Desbloqueie o poder do conceito de Inversion Fair Value Gap (IFVG) de ICT com o Inversion Fair Value Gaps Indicator ! Esta ferramenta inovadora eleva os Fair Value Gaps (FVGs) a um novo nível, identificando e exibindo zonas de FVG invertidas — áreas-chave de suporte e resistência formada
Volumatic VIDyA MT5
Duc Hoan Nguyen
5 (1)
Special offer : ALL TOOLS , just $35 each! New tools   will be   $30   for the   first week   or the   first 3 purchases !  Trading Tools Channel on MQL5 : Join my MQL5 channel to update the latest news from me Volumatic VIDYA (Variable Index Dynamic Average) é um indicador avançado projetado para rastrear tendências e analisar a pressão de compra e venda em cada fase de uma tendência. Utilizando o Promédio Dinâmico de Índice Variável (Variable Index Dynamic Average) como técnica central de sua
Special offer : ALL TOOLS , just $35 each! New tools   will be   $30   for the   first week   or the   first 3 purchases !  Trading Tools Channel on MQL5 : Join my MQL5 channel to update the latest news from me SMC é uma abordagem de trading que ajuda os traders a identificar zonas de liquidez, posições institucionais e pontos de reversão importantes no mercado. Ao aproveitar os princípios do SMC, os traders podem navegar pelo mercado de forma mais eficaz, encontrando entradas e saídas ideais.
Special offer : ALL TOOLS , just $35 each! New tools   will be   $30   for the   first week   or the   first 3 purchases !  Trading Tools Channel on MQL5 : Join my MQL5 channel to update the latest news from me O Fibonacci Confluence Toolkit Multi-Timeframe é uma ferramenta avançada de análise técnica projetada para traders profissionais, ajudando a identificar zonas potenciais de reversão de preços ao combinar sinais e padrões de mercado-chave. Com capacidades de exibição de múltiplos interval
Special offer : ALL TOOLS , just $35 each! New tools   will be   $30   for the   first week   or the   first 3 purchases !  Trading Tools Channel on MQL5 : Join my MQL5 channel to update the latest news from me Maximize sua vantagem de negociação com o Follow Line MT5 com Scanner, um indicador avançado baseado em volatilidade, projetado para traders sérios. Esta ferramenta combina o poder das Bandas de Bollinger com configurações personalizáveis, oferecendo insights precisos sobre os movimentos
FREE
Special offer : ALL TOOLS , just $35 each! New tools   will be   $30   for the   first week   or the   first 3 purchases !  Trading Tools Channel on MQL5 : Join my MQL5 channel to update the latest news from me O Indicador de Padrão de Reversão de Três Barras oferece uma ferramenta poderosa para traders, identificando e destacando automaticamente padrões de reversão de três barras diretamente no gráfico de preços. Este indicador é um recurso valioso para detectar reversões potenciais de tendênc
Special offer : ALL TOOLS , just $35 each! New tools   will be   $30   for the   first week   or the   first 3 purchases !  Trading Tools Channel on MQL5 : Join my MQL5 channel to update the latest news from me Apresentamos o SuperTrend ATR Multiplier with Scanner for MT5 – uma ferramenta versátil e poderosa projetada para ajudar você a se manter à frente das tendências do mercado, com recursos personalizáveis e alertas em tempo real. Seguindo a lógica confiável do SuperTrend de Kivanc Ozbilgic
FREE
Special offer : ALL TOOLS , just $35 each! New tools   will be   $30   for the   first week   or the   first 3 purchases !  Trading Tools Channel on MQL5 : Join my MQL5 channel to update the latest news from me I. Introdução Market Structure Trend Targets Scanner é uma ferramenta poderosa para analisar tendências de mercado, identificar pontos de rompimento e gerenciar riscos por meio de um stop loss dinâmico. Ao rastrear altas e baixas anteriores para identificar rompimentos, esta ferramenta
Special offer : ALL TOOLS , just $35 each! New tools   will be   $30   for the   first week   or the   first 3 purchases !  Trading Tools Channel on MQL5 : Join my MQL5 channel to update the latest news from me O Fibonacci Confluence Toolkit Multi-Timeframe é uma ferramenta avançada de análise técnica projetada para traders profissionais, ajudando a identificar zonas potenciais de reversão de preços ao combinar sinais e padrões de mercado-chave. Com capacidades de exibição de múltiplos interval
Oferta especial : ALL TOOLS , apenas $35 cada! New tools   will be   $30   for the   first week   or the   first 3 purchases !  Trading Tools Channel on MQL5 : Join my MQL5 channel to update the latest news from me Em um ambiente de negociação volátil, uma ferramenta de análise poderosa e intuitiva pode ajudá-lo a aproveitar rapidamente as oportunidades. O Fibonacci Trend Scanner não apenas integra recursos tradicionais do indicador Fibonacci e do SuperTrend, mas também expande a funcionalidade
Special offer : ALL TOOLS , just $35 each! New tools   will be   $30   for the   first week   or the   first 3 purchases !  Trading Tools Channel on MQL5 : Join my MQL5 channel to update the latest news from me O Indicador de Padrão de Reversão de Três Barras oferece uma ferramenta poderosa para traders, identificando e destacando automaticamente padrões de reversão de três barras diretamente no gráfico de preços. Este indicador é um recurso valioso para detectar reversões potenciais de tendênc
Special offer : ALL TOOLS , just $35 each! New tools   will be   $30   for the   first week   or the   first 3 purchases !  Trading Tools Channel on MQL5 : Join my MQL5 channel to update the latest news from me No cenário em constante mudança do comércio financeiro, identificar e analisar com precisão os níveis de suporte e resistência é essencial para tomar decisões de investimento informadas. SnR Retest and Break Multi-Timeframe é um indicador de suporte e resistência projetado para aprimorar
Special offer : ALL TOOLS , just $35 each! New tools   will be   $30   for the   first week   or the   first 3 purchases !  Trading Tools Channel on MQL5 : Join my MQL5 channel to update the latest news from me O indicador Volumetric Order Blocks Multi Timeframe é uma ferramenta poderosa projetada para traders que buscam insights mais profundos sobre o comportamento do mercado, identificando áreas de preço chave onde participantes significativos do mercado acumulam ordens. Essas áreas, conhecid
Special offer : ALL TOOLS , just $35 each! New tools   will be   $30   for the   first week   or the   first 3 purchases !  Trading Tools Channel on MQL5 : Join my MQL5 channel to update the latest news from me O indicador Supertrend Fakeout é uma versão aprimorada do clássico indicador Supertrend , projetado para fornecer sinais de tendência mais confiáveis. Ao incorporar recursos avançados como Fakeout Index Limit e Fakeout ATR Mult , este indicador ajuda a filtrar reversões de tendência fals
FREE
Special offer : ALL TOOLS , just $35 each! New tools   will be   $30   for the   first week   or the   first 3 purchases !  Trading Tools Channel on MQL5 : Join my MQL5 channel to update the latest news from me Visão Geral OA SnR Power é uma ferramenta poderosa projetada para ajudar traders a identificar e avaliar a força dos níveis de suporte e resistência. Incorporando fatores-chave como volume de negociação, frequência de rebote e número de testes, este indicador fornece uma visão abrangent
FREE
Special offer : ALL TOOLS , just $35 each! New tools   will be   $30   for the   first week   or the   first 3 purchases !  Trading Tools Channel on MQL5 : Join my MQL5 channel to update the latest news from me No atual cenário volátil de negociação financeira, identificar com precisão níveis de suporte e resistência é fundamental para que os traders tomem decisões informadas. O Predictive Ranges Scanner Multi-TF é uma ferramenta avançada projetada para ajudar os traders a escanear e prever fut
SMC System MT4
Duc Hoan Nguyen
5 (1)
Special offer : ALL TOOLS , just $35 each! New tools   will be   $30   for the   first week   or the   first 3 purchases !  Trading Tools Channel on MQL5 : Join my MQL5 channel to update the latest news from me SMC é uma abordagem de trading que ajuda os traders a identificar zonas de liquidez, posições institucionais e pontos de reversão importantes no mercado. Ao aproveitar os princípios do SMC, os traders podem navegar pelo mercado de forma mais eficaz, encontrando entradas e saídas ideais.
Special offer : ALL TOOLS , just $35 each! New tools   will be   $30   for the   first week   or the   first 3 purchases !  Trading Tools Channel on MQL5 : Join my MQL5 channel to update the latest news from me Maximize sua vantagem de negociação com o Follow Line com Scanner, um indicador avançado baseado em volatilidade, projetado para traders sérios. Esta ferramenta combina o poder das Bandas de Bollinger com configurações personalizáveis, oferecendo insights precisos sobre os movimentos de
FREE
Special offer : ALL TOOLS , just $35 each! New tools   will be   $30   for the   first week   or the   first 3 purchases !  Trading Tools Channel on MQL5 : Join my MQL5 channel to update the latest news from me O indicador AI Channels utiliza clusterização K-means deslizante — uma técnica poderosa de aprendizado de máquina na análise de clusters — para fornecer insights em tempo real sobre tendências de preços subjacentes. Este indicador cria canais adaptativos com base em dados de preços agrup
FREE
Special offer : ALL TOOLS , just $35 each! New tools   will be   $30   for the   first week   or the   first 3 purchases !  Trading Tools Channel on MQL5 : Join my MQL5 channel to update the latest news from me O indicador Liquidity Pools é uma ferramenta avançada que identifica e marca zonas potenciais de liquidez no gráfico ao analisar áreas altas e baixas com frequentes toques de pavio, juntamente com o número de revisitações e o volume negociado em cada zona. Esta ferramenta oferece aos tra
Special offer : ALL TOOLS , just $35 each! New tools   will be   $30   for the   first week   or the   first 3 purchases !  Trading Tools Channel on MQL5 : Join my MQL5 channel to update the latest news from me I. Introdução Market Structure Trend Targets Scanner é uma ferramenta poderosa para analisar tendências de mercado, identificar pontos de rompimento e gerenciar riscos por meio de um stop loss dinâmico. Ao rastrear altas e baixas anteriores para identificar rompimentos, esta ferramenta
Special offer : ALL TOOLS , just $35 each! New tools   will be   $30   for the   first week   or the   first 3 purchases !  Trading Tools Channel on MQL5 : Join my MQL5 channel to update the latest news from me Visão Geral OA SnR Power é uma ferramenta poderosa projetada para ajudar traders a identificar e avaliar a força dos níveis de suporte e resistência. Incorporando fatores-chave como volume de negociação, frequência de rebote e número de testes, este indicador fornece uma visão abrangent
FREE
Special offer : ALL TOOLS , just $35 each! New tools   will be   $30   for the   first week   or the   first 3 purchases !  Trading Tools Channel on MQL5 : Join my MQL5 channel to update the latest news from me Desbloqueie o poder do aprendizado de máquina avançado com o Machine Learning Adaptive SuperTrend , um indicador de ponta projetado para se adaptar perfeitamente às condições de mercado em mudança. Ao integrar o agrupamento k-means com a metodologia SuperTrend, este indicador permite uma
Special offer : ALL TOOLS , just $35 each! New tools   will be   $30   for the   first week   or the   first 3 purchases !  Trading Tools Channel on MQL5 : Join my MQL5 channel to update the latest news from me Apresentamos o SuperTrend by Kivanc Ozbilgic with Scanner – uma ferramenta versátil e poderosa projetada para ajudar você a se manter à frente das tendências do mercado, com recursos personalizáveis e alertas em tempo real. Você pode ajustar o método de cálculo do ATR entre RMA (Média Mó
FREE
Special offer : ALL TOOLS , just $35 each! New tools   will be   $30   for the   first week   or the   first 3 purchases !  Trading Tools Channel on MQL5 : Join my MQL5 channel to update the latest news from me O indicador Trend Levels foi meticulosamente criado para identificar níveis de tendência críticos — Alto, Médio e Baixo — durante os movimentos de mercado. Com cálculos em tempo real baseados nos valores mais altos, mais baixos e médios ao longo de um período personalizável, esta ferrame
Filtro:
Nikodem Dobrzynski
278
Nikodem Dobrzynski 2025.01.24 18:22 
 

Volumatic VIDyA is a very useful indicator that combines both trend and volume indications. When combined with other technical analysis indicators, it can be a great tool in your strategy. Niko.

XANKEEZ
414
XANKEEZ 2025.01.03 09:42 
 

VIDYA is a unique indicator that combines trend and volume analysis. for best results, use it with other indicators like RSI or ADX. the author keeps updating and making it better each time.

Duc Hoan Nguyen
22075
Resposta do desenvolvedor Duc Hoan Nguyen 2025.01.03 15:30
Thank you for your review!
Glad to hear the indicator is working well for you when combined with others.
Appreciate your recognition of the updates, and wishing you continued success!
Responder ao comentário
Versão 2.11 2025.02.27
Optimized dashboard algorithm
Versão 2.1 2025.01.17
Add input parameter to show/hide smoothed line
Versão 2.0 2024.12.31
- Optimized the algorithm to make the indicator a little faster.
- Improved user experience with the dashboard.
- Added the feature to hide/show indicator on the current chart.
Versão 1.10 2024.12.18
Added SCANNER to the indicator, helping users easily track trends and delta volume of multiple currency pairs and multiple time frames