RSI crosses MA Alert 4
- Indicadores
- Prafull Manohar Nikam
- Versão: 1.0
- Ativações: 5
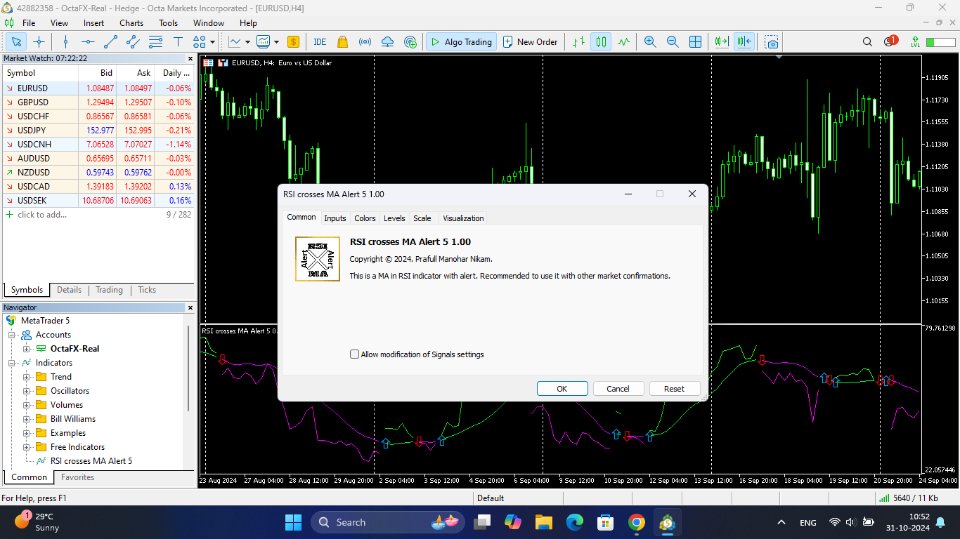
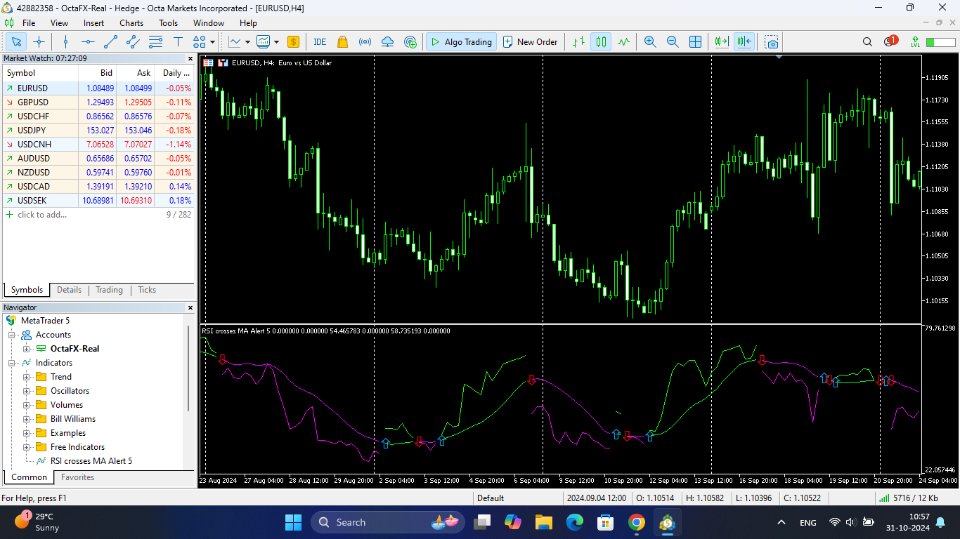
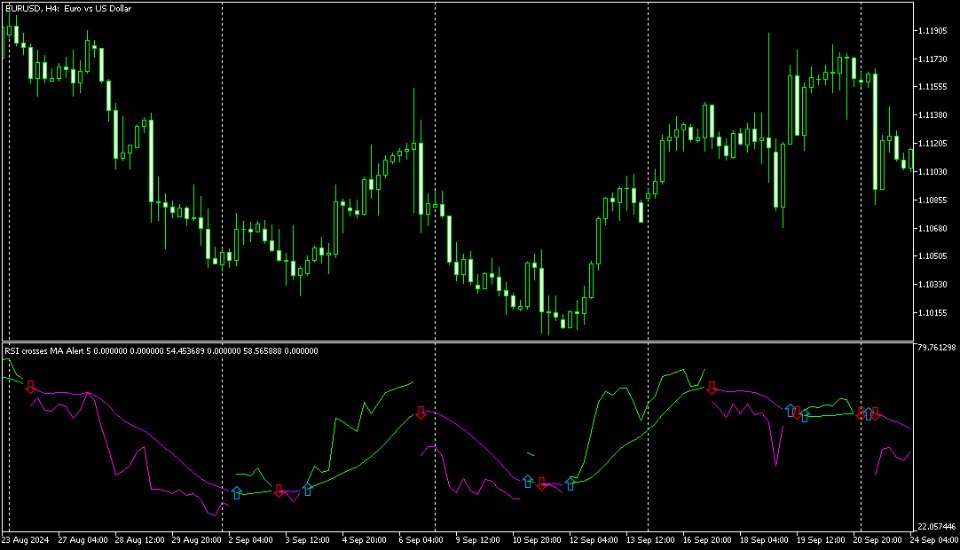
Hey there! If you are using Moving Average indicator into RSI indicator's window and always wondering if there could be a way to get alerts on your smartphone when those two indicators get a crossover that would be great, right!? Then you have found the right tool for that. This indicator is nothing but a mix of MA indicator and RSI indicator into one indicator window as well as it will give you alerts for crossovers on your smartphone app, email and also on your trading terminal's (desktop) chart window.
NOTE- This is NOT a Buy-Sell alert but a crossover alert system (crossovers are not meant for entering a trade blindly they are there to tell you, "Hey! be ready and look for a possible trade opportunity"). Recommended to use it with other market confirmations and best on higher timeframes.
FEATURES:
1. It uses a trend indicator which is Simple Moving Average (SMA).
2. It uses an oscillator indicator which is Relative Strength Index (RSI).
3. It has mobile alert which works on METATRADER (4 & 5) mobile apps.
4. It has email alert which you have to setup and activate inside your (METATRADER for desktop) trading terminal's settings.
5. It has pop up alert on your desktop trading terminal as well.
INPUTS EXPLAINED:
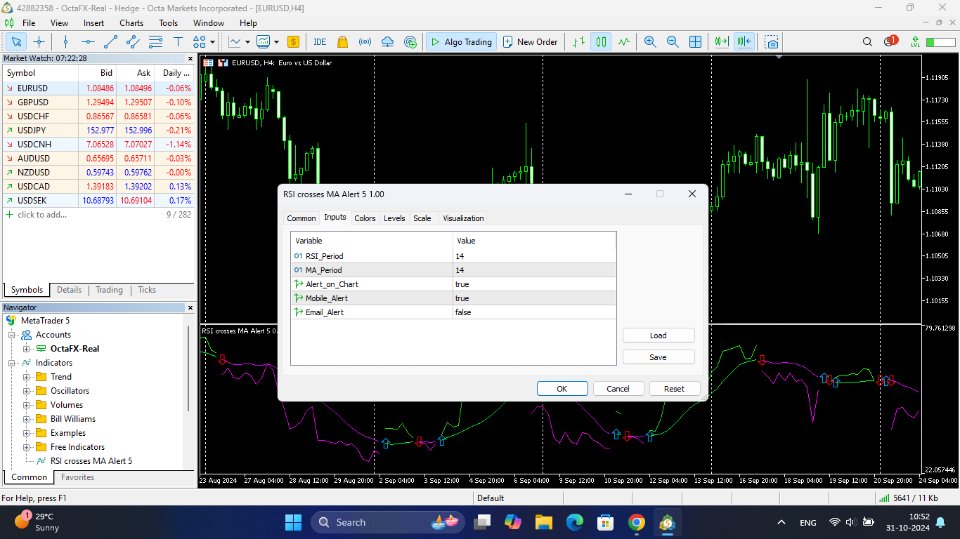
1. MA Period - (Default is 14) This is the value for the Simple Moving Average indicator.
2. RSI Period- (Default is 14) This is the value for the Relative Strength Index indicator.
3. Alert On Chart - If input value is "true" then you will get pop up alerts inside your desktop trading terminal.
4. Mobile Alert - If input value is "true" and you have MT4 or MT5 app installed and alert activated with META ID in your mobile phone. Then you will receive alert notifications for this indicator.
5. Email Alert - This is a tricky one. If you want to receive alerts on your email ID then you will have to input it as "true" and also setup it properly inside your desktop's trading terminal. (Don't worry! You will find many easy to follow video tutorials on YT).
BASIC INFO:
The **Relative Strength Index (RSI)** is a popular technical indicator used in financial markets to assess the strength and speed of a price movement, typically for stocks, cryptocurrencies, or other assets. The **RSI period** refers to the number of previous data points (often days) that are used to calculate the RSI value.
Here's a closer look at what the RSI period means and how it impacts the RSI:
1. **Understanding RSI Calculation**
- The RSI measures the average gains and losses over a set period to gauge if an asset is overbought (typically above 70) or oversold (typically below 30).
- Formulaically, RSI compares the magnitude of recent gains to recent losses over the chosen period, plotting the result on a scale of 0 to 100.
2. **RSI Period (Lookback Period)**
- **Standard Setting**: The default RSI period is typically **14 periods** (e.g., 14 days on a daily chart), which is used in most analysis to provide a balanced view of recent price action.
- **Shorter Periods (e.g., 5 or 7)**: These make the RSI more sensitive, capturing sharper movements and generating signals more frequently but with higher volatility and noise.
- **Longer Periods (e.g., 20 or 30)**: These smooth out short-term fluctuations, providing a more stable trend view, but may delay signals.
3. **Implications of Different RSI Periods**
- **Shorter Period**: Faster response to price changes but may generate more false signals.
- **Longer Period**: Smoother signals, useful for long-term trends, though it may miss shorter, quick opportunities.
Choosing the best RSI period depends on the investor's goals, the asset's volatility, and the desired balance between signal sensitivity and reliability.

