• Visão global
  • Comentários
  • Discussão
  • O que há de novo

Fractals MTF

Multi-Timeframe Fractal Indicator Description for MQL5

Introducing the Multi-Timeframe Fractal Indicator!

Key Features:

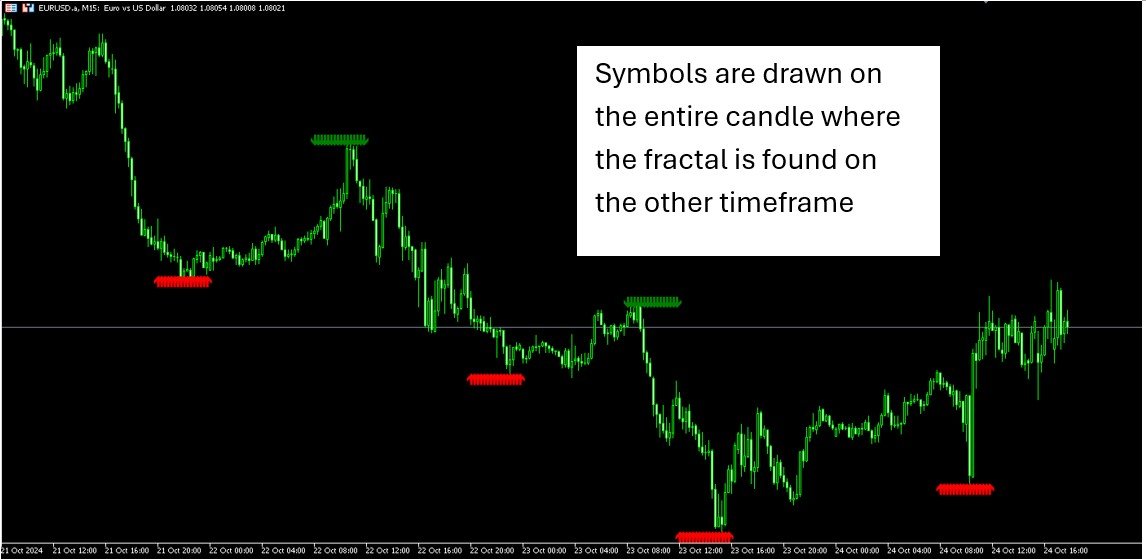
  • Multi-Timeframe Analysis: Analyze Fractals on a timeframe independent of your chart's current timeframe. Gain insights from higher timeframes for informed trading decisions.
  • Customizable Parameters:
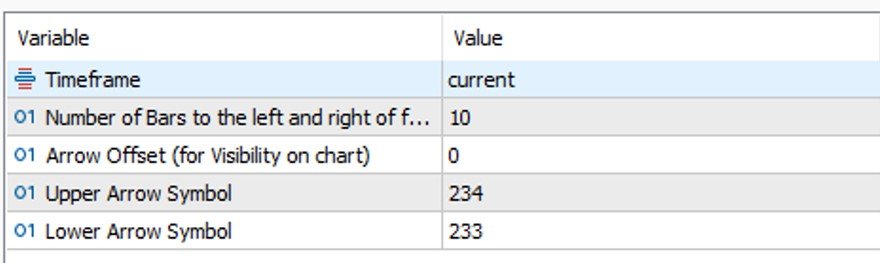
    • Timeframe: Choose the timeframe on which Fractals will be calculated (e.g., Daily, H4, etc.).
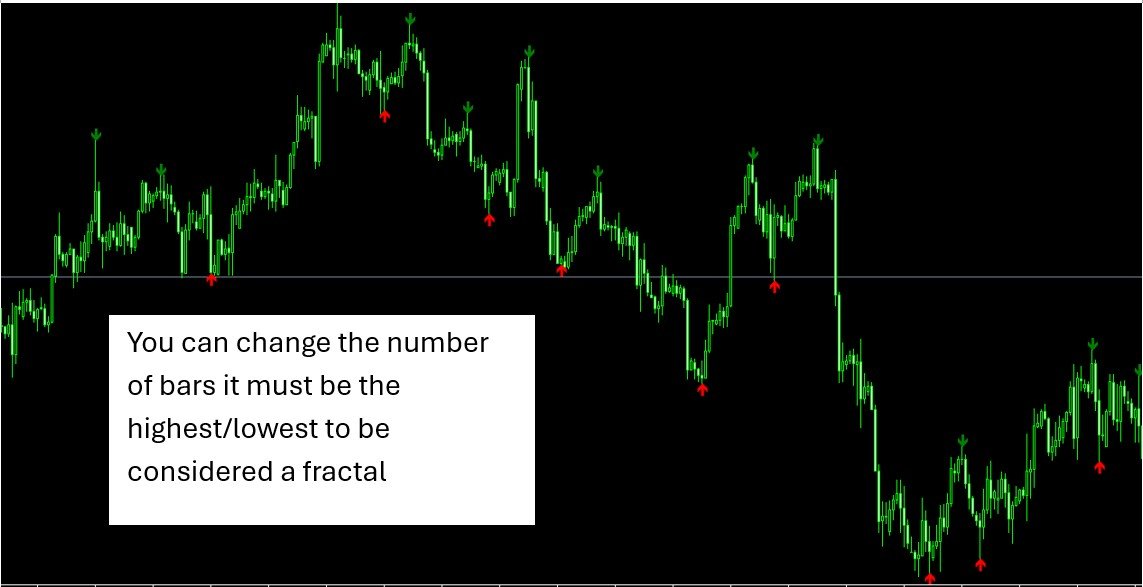
    • Number of Bars: Specify the number of bars considered around a potential Fractal for confirmation.
    • Arrow Shift: Adjust the position of the indicator's arrows for better visibility on your chart.
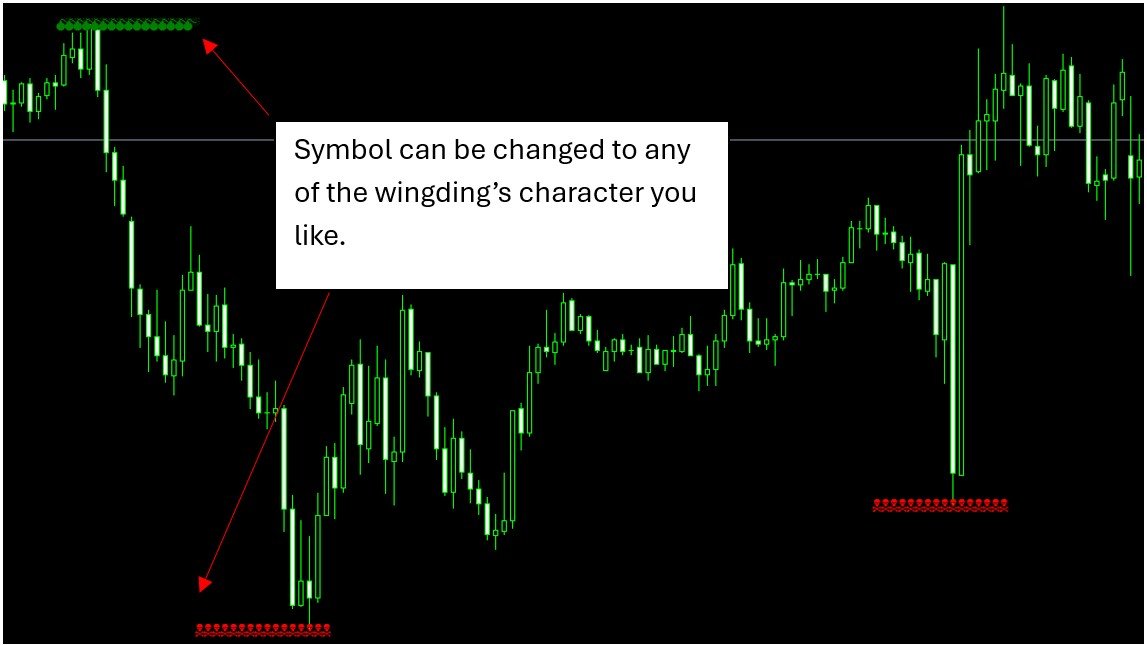
    • Arrow Symbols: Select from a variety of arrow styles to represent Fractals.

Benefits:

  • Improved Trade Timing: Identify potential turning points earlier by leveraging Fractals from different timeframes.
  • Enhanced Confirmation: Customize the indicator's parameters to refine your Fractal identification and strengthen your trading signals.
  • Clear Visualization: Easily spot Fractals with visually distinct arrows placed directly on your chart.

Who is this Indicator For?

This indicator is ideal for traders who:

  • Utilize Fractal analysis in their trading strategy.
  • Want to analyze Fractals on a timeframe independent of their chart view.
  • Seek a customizable tool to refine their Fractal identification.


Produtos recomendados
High And Low MT5
Dmitriy Parfenovich
On the current chart, this indicator displays candlestick highs and lows of another time frame. Input Parameters: TimeFrame - chart time frame whose data will be displayed on the current price chart (by default, H12). Time Zone - shift of the indicator by time zone relative to the broker's time (by default, Broker-1). If the broker's time zone is UTC+1 and the Time Zone parameter is set to Broker-1, the bends of the indicator will be plotted in multiples of Greenwich Time. Indicator buffer value
The indicator is designed to close positions on the market in time. For example: to take profits ahead of schedule if the price has not reached TakeProfit, and the market is turning around. The indicator analyzes the momentum, not the trend. He does not give any information about the trend. The indicator is well suited for finding divergence. The Ershov 38 Parrots indicator dynamically adjusts to the market and detects price movement impulses of medium and high amplitude. It almost does not rea
Bar Sequential
Maximiliano Frisione Figueroa
This indicator can help you clearly identify trend changes in both bullish and bearish markets. The indicator compares the closing price of the last candle with the closing price of the candle "X" periods ago (input parameter). In an uptrend, an initial number '1' is plotted if a candle closes higher than the closing of a candle "X" periods ago. In a downtrend, an initial number '1' is plotted if a candle closes below the closing of a candle "X" periods ago. Subsequent numbers are plotted when e
FREE
Utilities
Douglas Lucio De Araujo
Indicador com 3 funcionalidades - Relógio : Relógio independente do gráfico, não para a contagem mesmo com o mercado fechado. - Template : Após definir uma configuração em qualquer gráfico, seja padrões de cores, indicadores, zoom... A configuração será copiada para todos os gráficos ativos. - TimeFrame : Defina o TimeFrame em um gráfico, e com apenas um clique todos os gráficos ativos serão alterados para o mesmo TimeFrame.
Why the RSI Alert Indicator is Essential for Your Trading Toolkit In the fast-paced world of trading, timely and accurate information is crucial. The RSI Alert Indicator is a powerful tool designed to help you stay ahead of the market by providing real-time alerts when the Relative Strength Index (RSI) reaches critical levels. Whether you're a novice trader or a seasoned professional, this indicator can significantly enhance your trading strategy by pinpointing potential market reversals with
O indicador rastreia a tendência em 5 tempos gráficos diferentes do mesmo ativo, tendo como base 6 sinais par cada tempo gráfico. O indicador tem como principal objetivo, nos mostrar a tendência majoritária do ativo financeiro em que ele foi colocado. O sistema passa as informações das tendências em diversos tempos gráficos, dessa forma o usuário consegue ter uma visão ampla do movimento do ativo, este tipo de ferramenta faz com que o usuário tenha uma maior taxa de acerto pelo fato de auxilia
DWMACD
Roman Sukhorukov
DWMACD - Divergence Wave MACD . The indicator displays divergences by changing the color of the MACD histogram. The indicator is easy to use and configure. For the calculation, a signal line or the values ​​of the standard MACD histogram can be used. You can change the calculation using the UsedLine parameter. It is advisable to use a signal line for calculation if the histogram often changes directions and has small values, forming a kind of flat. To smooth the histogram values ​​set the signa
Four MA on OBV
Danton Dos Santos Sardinha Junior
Four MA on OBV - Seu Guia Definitivo para Operações Bem-Sucedidas! Desvende o verdadeiro potencial das suas operações com o indicador Four MA on OBV . Projetado exclusivamente para a plataforma MetaTrader 5, este poderoso indicador combina quatro médias móveis com o On-Balance Volume (OBV) para fornecer sinais precisos e confiáveis. Características Técnicas: Quatro Médias Móveis: Integração de médias móveis simples, exponenciais, suavizadas e lineares para um acompanhamento detalhado das tend
Structure Levels (Highs & Lows) Indicator for MetaTrader 5 Decode Market DNA — Trade with Institutional Precision Description: The Structure Levels (Highs & Lows) Indicator is your secret weapon to map the market’s hidden roadmap. Designed for traders who think in terms of price action and market structure, this tool automatically identifies critical swing highs and swing lows, transforming chaotic charts into a clear blueprint of support/resistance zones, breakout opportunities, and trend rev
Este quadro de tempo múltiplo e indicador de vários símbolos procura barras de pinos, estrelas da manhã / noite, engolfamentos, pinças, três linhas de ataque, barras internas e flâmulas e triângulos.   O indicador também pode ser usado no modo de gráfico único. Por favor, leia mais sobre esta opção no produto   blog .   Combinado com suas próprias regras e técnicas, este indicador permitirá que você crie (ou aprimore) seu próprio sistema poderoso. Recursos Pode monitorar todos os símbolos visíve
Este indicador de multitemporal e símbolo múltiplo identifica formações superiores / inferiores duplas ou triplas ou um rompimento do decote seguinte (superior / inferior confirmado). Ele oferece RSI, barra de pinos, engolfante, pinça, filtros de estrela da manhã / noite, bem como opções de filtro de divergência, o que torna possível filtrar apenas as configurações mais fortes.       O indicador também pode ser usado no modo de gráfico único. Por favor, leia mais sobre esta opção no produto   bl
Expert Amazo
Guilherme Geovanini Fraga
EXPERT AMAZO é um Expert Advisor projetado especificamente para negociar WIN (mini índice) e WDO (mini dólar). A operação é baseada na abertura de ordens utilizando alguns indicadores como Sars parabólicos, médias móveis, Bandas de Bollinger, Fibonacci, etc., trabalhando de acordo com 3 modalidades de estratégia, o AMAZO procura prever os movimentos do mercado com operações contra ea favor da tendência.        Entre em nosso Grupo de WhatsApp para receber as melhores configurações do Expert. G
Graphic Order Tool
Volodymyr Korolevych
Graphic Order Tool Graphic panel to help trader to make orders. Drag TP line, SL line and/or ENTRY line with immediate calculation of the profit and loss in pips and USD. Risk management: Set % of your balance you can risk in the order to make it safe for your money. Automatically detect the type of possible order (BUY, SELL, BUY_STOP, SELL_LIMIT, BUY_LIMIT, SELL_STOP) depending on mode (BUY/SELL) and position of lines ENTRY , TP , SL . Panel is semi-transparent, not to cover the main char
Multiple Timeframe MACD indicator. This indicator was built for making multiple timeframe analysis possible in MT5 using MACD Indicator. MACD Indicator traditionally shows two lines and one histogram. MACD Line(Yellow) is calculated by subtracting 12period EMA(fast) from 26period EMA (slow). Signal Line(Blue) is created by a 9period EMA from MACD Line. Histogram is just the difference between MACD and Signal lines. Histogram is colored based on the difference between its value and the previous h
Dorian
Ivan Simonika
The Dorian indicator is an intuitive tool for determining the current market trend. It is based on a simple visualization in the form of two-color lines, which makes it convenient for use by both beginners and experienced traders. This indicator not only helps determine the direction of the trend, but also serves as a valuable advisor for making decisions about entering the market or closing positions. Due to its simplicity and effectiveness, Dorian is recommended for traders of any experience
What is VWAP? The Volume Weighted Average Price (VWAP) is a trading benchmark that reflects the average price of a security, weighted by volume, over a specific time period. It helps traders identify fair value and is used widely in intraday trading to assess price action relative to institutional trading levels. Key Features of Anchored VWAP PRO Anchored Calculation : Unlike traditional VWAP that resets daily, your indicator allows users to anchor VWAP to specific time frames or key points (e.g
Tabajara Ogro
JETINVEST
4.73 (11)
O Setup Tabajara foi criado por   , trader brasileiro conhecido como   "O OGRO de Wall Street" . A ideia deste setup é indicar ao trader a tendência atual dos preços e   o tipo de operação deve-se buscar no gráfico. Ele faz isto através da relação de posicionamento do fechamento dos candles e o sentido da média aritmética de 20 períodos pintando os candles de 4 possíveis cores: Verde -> Preço subindo em Tendência de alta (Buscar pontos de entrada de COMPRA) Preto -> Preço c
FREE
DM IND Exclusive
Sergio Vidal Prado
Indicador Para Opções Binarias. Indicator for Binary Options Usa dois gales. Instalar em mt5 Esse indicador é para ser usado no tempo de vela de 5 minutos e em M5. Este também funciona em M1, porém é mais eficiente em M5. Só descompactar e copiar os arquivos na pasta de dados do seu MT5. Arquivos indicator na pasta MQL5 - Indicator. Baixe também a Media Movel totalmente gratis: https://www.mql5.com/pt/market/product/50400 Esse Indicador é para a próxima vela. Apareceu a seta, só aguardar a próx
Este rastreador permite que você identifique ativos que estão mais do que normalmente sobrecomprados (% de crescimento) ou sobrevendidos (% de queda) dentro de um período de tempo selecionado (período de tempo). O mercado é regido por lei, compre mais barato, venda mais caro, mas sem um scanner automático será muito difícil para você identificar moedas / ações que estão sobrecompradas ou sobrevendidas mais do que o normal, digamos, na semana atual, ou o hora atual ou mês. Pode haver dezenas ou
Wa Candle Timer MT5
Wachinou Lionnel Pyrrhus Sovi Guidi
Wa Candle Timer MT5 O Wa Candle Timer MT5 é um indicador poderoso e fácil de usar, projetado para exibir o tempo restante até a formação da próxima vela no seu gráfico MT5. Essa ferramenta ajuda os traders a acompanharem o fechamento das velas, permitindo uma melhor execução de operações e tomada de decisões. Principais Recursos: Exibe o temporizador de contagem regressiva para a vela atual. Altera a cor quando restam menos de 5% do tempo da vela. Configuração totalmente personalizável
FREE
Este indicador multi-quadro de tempo e vários símbolos identifica os padrões duplo superior / inferior, cabeça e ombro, flâmula / triângulo e bandeira. Também é possível configurar alertas apenas quando uma ruptura do decote / triângulo / mastro tiver ocorrido (ruptura do decote = sinal confirmado para parte superior / inferior e cabeça e ombros).       O indicador também pode ser usado no modo de gráfico único. Por favor, leia mais sobre esta opção no produto   blog . Combinado com suas própria
Maximize your trading performance with Dd-uP , a revolutionary indicator based on an Exponential Moving Average (EMA) smoothing. This indicator is represented by a distinct yellow line on your charts, making it easy to identify market trends and providing precise and reliable trading signals. Key Features: Advanced EMA Smoothing : Track market trends with an EMA smoothing that reacts quickly to price changes, offering precise and real-time analysis. Buy and Sell Signals : Receive clear signals w
A top and bottom indicator that can intuitively identify the trend of the band. It is the best choice for manual trading, without redrawing or drifting. Price increase of $20 every 3 days, price increase process: 79-->   99 --> 119...... Up to a target price of $1000. For any novice and programming trading friend, you can write the signal into the EA to play freely. Array 3 and array 4, for example, 3>4 turns green, 3<4 turns red. If you don't understand, please contact me. ====================P
O  GRIDBOT WIM  robô de investimento para Mini Índice. Parametrizado com grade linear ou zona de expansão (FIMATHE). CONFIGURAÇÕES: Ponto de entrada Pivot dia anterior    double r1 = pivot + distance;    double r2 = r1 + distance;    double r3 = r2 + distance;    double r4 = r3 + distance;    double r5 = r4 + distance;    double r6 = r5 + distance;    double r7 = r6 + distance;    double r8 = r7 + distance;    double r9 = r8 + distance;    double r10 = r9 + distance;        double s1 = pivot -
KT DMA is a modified and advanced version of the classic Displaced Moving Averages with buy/sell crossover alerts and a Multi-Timeframe scanner that shows DMA's direction across each real-time time frame. A Displaced Moving Average is a simple moving average that moves ahead or backward in a time frame (either short-term or long-term). It also allows you to predict price movement more accurately. Features Depicts the trend direction using the alignment of three moving averages. Buy/Sell signals
Cybertrade Auto Fibonacci retração e projeção  - MT5   O Fibonacci automático é um indicador que traça automaticamente a retração e projeção de Fibonacci com base no número de barras que você seleciona na configuração do indicador. Estão disponíveis 9 níveis diferentes para retração e 3 níveis para projeção que podem ser customizados conforme desejado. Funciona em períodos maiores do que o período visível no gráfico. Todos os valores estão disponíveis em forma de buffers para simplificar possí
FREE
KT Market Structure EA MT5
KEENBASE SOFTWARE SOLUTIONS
KT Market Structure EA is a fully automated expert advisor built on the foundation of our popular KT Market Structure indicator . It uses Break of Structure (BOS) and Change of Character (CHoCH) signals directly from the indicator and offers a variety of options to automate trades.  By combining these signals with additional analysis, it provides a smart and efficient way to trade. No separate download is needed, as the EA comes with all its dependencies seamlessly embedded within the code. Fea
Market session with fibonacci
Batsukh Sumchin Khuyagbaatar
Este indicador é o indicador mais comum que utilizamos todos os dias, incluindo as nossas estratégias mais utilizadas, ICT e SMC, limites de stop loss e limites de liquidez que ocorrem nos horários de abertura e fecho das bolsas, bem como o volume de bolsas com Fibonacci e zoom in e out, e as ações mais comuns que deseja ver, como selecionar o movimento da bolsa que deseja ver e puxar Fibonacci, são indicadores totalmente automáticos que lhe permitem ver as ações mais comuns que deseja. Tenho 10
Three Dragons Genestra
Renato Genestra Martins
O THREE DRAGONS é um indicador técnico que retrata três dragões chineses místicos voando através do gráfico de preços: 1. O Dragão Verde (SeaGreen): - O mais ágil e rápido dos três - Reage rapidamente às mudanças de direção do mercado - Geralmente lidera os movimentos 2. O Dragão Vermelho (Tomato): - Move-se com equilíbrio entre velocidade e cautela - Confirma os movimentos iniciados pelo Dragão Verde - Suas interações com o Dragão Verde podem indicar oportunidades 3. O Dragão Preto (Black):
FREE
Flag MT5
Dmitry Fedoseev
An indicator of patterns #21, #22, #23 ("Flag") from Encyclopedia of Chart Patterns by Thomas N. Bulkowski. Parameters: Alerts - show alert when an arrow appears Push - send a push notification when an arrow appears (requires configuration in the terminal) PeriodBars - period in bars K - an additional parameter that influences the accuracy of pattern shape recognition. The influence of the parameter will be visible if not all of the pattern variants are enabled (not all three parameters Expandin
Os compradores deste produto também adquirem
Golden Trend Indicator MT5
Noha Mohamed Fathy Younes Badr
4.88 (16)
Golden Trend indicator  is The best indicator for predicting trend movement this indicator never lags and never repaints and never back paints    and give  arrow buy and sell    before the candle appear  and it will help you and  will make your trading decisions clearer its work on all currencies and  gold and crypto and all time frame This unique  indicator uses very secret algorithms to catch the  trends, so you can trade using this indicator and see the trend clear on charts  manual guide and
FX Volume MT5
Daniel Stein
4.82 (17)
FX Volume: Vivencie o Verdadeiro Sentimento de Mercado sob a Perspectiva de um Corretor Visão Geral Rápida Quer aprimorar sua abordagem de trading? FX Volume fornece insights em tempo real sobre como traders de varejo e corretores estão posicionados—bem antes de relatórios atrasados como o COT. Seja para buscar ganhos consistentes ou simplesmente ter uma vantagem mais clara no mercado, FX Volume ajuda você a detectar grandes desequilíbrios, confirmar rompimentos e aperfeiçoar sua gestão de ris
CBT Quantum Maverick Sistema de Negociação de Opções Binárias de Alta Eficiência O CBT Quantum Maverick é um sistema de opções binárias de alto desempenho, projetado para traders que buscam precisão, simplicidade e um enfoque disciplinado. Não exige personalização: o sistema está otimizado para resultados eficazes desde o início. Basta seguir os sinais, que podem ser dominados com um pouco de prática. Principais características: Precisão nos sinais: Sinais baseados na próxima vela, utilizando
TPSproTREND PrO MT5
Roman Podpora
4.69 (16)
TPSpro TREND PRO  - is a trend indicator that automatically analyzes the market and provides information about the trend and each of its changes, as well as giving signals for entering trades without redrawing! The indicator uses each candle, analyzing them separately. referring to different impulses - up or down impulse. Exact entry points into transactions for currencies, crypto, metals, stocks, indices!  ИНСТРУКЦИЯ RUS         INSTRUCTIONS  ENG       R ecommended to use with an indicator   -
Este é um indicador para MT5 que fornece sinais precisos para entrar em uma negociação sem redesenhar. Ele pode ser aplicado a qualquer ativo financeiro: forex, criptomoedas, metais, ações, índices. Ele fornecerá estimativas bastante precisas e informará quando é melhor abrir e fechar um negócio. Assista o vídeo (6:22) com um exemplo de processamento de apenas um sinal que compensou o indicador! A maioria dos traders melhora seus resultados de negociação durante a primeira semana de negociação c
Este painel mostra os últimos   padrões harmónicos   disponíveis para os símbolos seleccionados, pelo que poupará tempo e será mais eficiente /   versão MT4 . Indicador gratuito:   Basic Harmonic Pattern Colunas do indicador Symbol :   aparecem os símbolos seleccionados Trend :   de alta ou de baixa Pattern :   tipo de padrão (gartley, borboleta, morcego, caranguejo, tubarão, cifra ou ABCD) Entry :   preço de entrada SL:   preço de paragem de perda TP1:   preço do 1º take profit TP2:   preço
Matrix Arrow Indicator MT5
Juvenille Emperor Limited
5 (13)
O   Matrix Arrow Indicator MT5   é uma tendência única 10 em 1 seguindo um indicador multi-timeframe   100% sem repintura   que pode ser usado em todos os símbolos/instrumentos:   forex ,   commodities ,   criptomoedas ,   índices ,   ações .  O  Matrix Arrow Indicator MT5  determinará a tendência atual em seus estágios iniciais, reunindo informações e dados de até 10 indicadores padrão, que são: Índice de movimento direcional médio (ADX) Índice de canal de commodities (CCI) Velas clássicas de
Gartley Hunter Multi
Siarhei Vashchylka
5 (9)
Gartley Hunter Multi - An indicator for searching for harmonic patterns simultaneously on dozens of trading instruments and on all possible timeframes. Manual (Be sure to read before purchasing) | Version for MT4 Advantages 1. Patterns: Gartley, Butterfly, Shark, Crab. Bat, Alternate Bat, Deep Crab, Cypher 2. Simultaneous search for patterns on dozens of trading instruments and on all possible timeframes 3. Search for patterns of all possible sizes. From the smallest to the largest 4. All fou
TPSpro RFI Levels MT5
Roman Podpora
4.53 (19)
INSTRUÇÕES         Russo   -        ENG       R   ecomendado para uso com um indicador       -       TPSpro   TREND PRO -   Versão MT4         Um elemento-chave na negociação são as zonas ou níveis a partir dos quais as decisões de comprar ou vender um instrumento de negociação são tomadas. Apesar das tentativas dos principais participantes de esconder sua presença no mercado, eles inevitavelmente deixam rastros. Nossa tarefa era aprender como identificar esses rastros e interpretá-los corretame
Atomic Analyst MT5
Issam Kassas
4.32 (19)
Primeiramente, vale ressaltar que este Indicador de Negociação não repinta, não redesenha e não apresenta atrasos, tornando-o ideal tanto para negociação manual quanto automatizada. Manual do utilizador: configurações, entradas e estratégia. O Analista Atômico é um Indicador de Ação de Preço PA que utiliza a força e o momentum do preço para encontrar uma vantagem melhor no mercado. Equipado com filtros avançados que ajudam a remover ruídos e sinais falsos, e aumentam o potencial de negociação.
Bill Williams Advanced
Siarhei Vashchylka
5 (9)
Bill Williams Advanced is designed for automatic chart analysis using Bill Williams' "Profitunity" system. The indicator analyzes four timeframes at once. Manual (Be sure to read before purchasing) Advantages 1. Automatically analyzes the chart using the "Profitunity" system of Bill Williams. The found signals are placed in a table in the corner of the screen. 2. Equipped with a trend filter based on the Alligator indicator. Most of the system signals are recommended to be used only according t
Quantum Trend Sniper
Bogdan Ion Puscasu
4.73 (51)
Apresentando       Quantum Trend Sniper Indicator   , o inovador Indicador MQL5 que está transformando a maneira como você identifica e negocia as reversões de tendência! Desenvolvido por uma equipe de traders experientes com experiência comercial de mais de 13 anos,       Indicador de Atirador de Tendência Quântica       foi projetado para impulsionar sua jornada de negociação a novos patamares com sua forma inovadora de identificar reversões de tendência com precisão extremamente alta. ***Com
RelicusRoad Pro MT5
Relicus LLC
4.78 (18)
Agora US $ 147 (aumentando para US $ 499 após algumas atualizações) - Contas ilimitadas (PCs ou Macs) Manual do usuário do RelicusRoad + vídeos de treinamento + acesso ao grupo de discórdia privado + status VIP UMA NOVA FORMA DE OLHAR PARA O MERCADO O RelicusRoad é o indicador de negociação mais poderoso do mundo para forex, futuros, criptomoedas, ações e índices, oferecendo aos traders todas as informações e ferramentas necessárias para se manterem rentáveis. Fornecemos análises técnicas e
Quantum TrendPulse
Bogdan Ion Puscasu
5 (13)
Apresentando   Quantum TrendPulse   , a ferramenta de negociação definitiva que combina o poder do   SuperTrend   ,   RSI   e   Stochastic   em um indicador abrangente para maximizar seu potencial de negociação. Projetado para traders que buscam precisão e eficiência, este indicador ajuda você a identificar tendências de mercado, mudanças de momentum e pontos de entrada e saída ideais com confiança. Principais características: Integração SuperTrend:   siga facilmente a tendência predominante do
O Indicador de Quadrados de Gann é uma poderosa ferramenta de análise de mercado baseada no artigo "Fórmula Matemática para Previsões de Mercado" escrito por W.D. Gann, que se baseia em conceitos matemáticos para análise. Ele incorpora elementos das técnicas de Gann relacionadas com os quadrados de 144, 90 e 52, bem como o quadrado de 9. Além disso, inclui o método do  sobre como combinar o quadrado de 9 com canais e padrões de estrela. Manual do Usuário e Modo de Uso: Antes de usar este indicad
BookMap HeatMap
Roberto Spadim
1 (2)
This Indicator creates a heatmap based on depth of market of the current symbol or another symbol. Other symbol is useful when you trade futures market and a contract has 'mini' and 'full' split. For example, in Brazil (B3 - BMF&Bovespa), WDO and DOL are future Forex contract of BRL/USD (where 1 DOL = 5 WDO) and big banks work mostly with DOL (where liquidity is important). Please use with M1 timeframe , objects are too small to be displayed at higher timeframes (MT5 limit). The number of level
Berma Bands
Muhammad Elbermawi
5 (3)
O indicador Berma Bands (BBs) é uma ferramenta valiosa para traders que buscam identificar e capitalizar tendências de mercado. Ao analisar a relação entre o preço e os BBs, os traders podem discernir se um mercado está em uma fase de tendência ou de variação. Visite o [ Blog Berma Home ] para saber mais. As Bandas de Berma são compostas por três linhas distintas: a Banda de Berma Superior, a Banda de Berma Média e a Banda de Berma Inferior. Essas linhas são plotadas em torno do preço, criando u
Gold Trend 5
Sergei Linskii
3.5 (2)
Tendência do ouro - este é um bom indicador técnico de acções. O algoritmo do indicador analisa o movimento do preço de um ativo e reflecte a volatilidade e as potenciais zonas de entrada. Os melhores sinais do indicador: - Para VENDER = histograma vermelho + ponteiro SHORT vermelho + seta de sinal amarelo na mesma direção. - Para COMPRAR = histograma azul + ponteiro LONGO azul + seta de sinal aqua na mesma direção. Vantagens do indicador: 1. O indicador produz sinais com elevada precisão
Apresentando       Quantum Breakout PRO   , o inovador Indicador MQL5 que está transformando a maneira como você negocia Breakout Zones! Desenvolvido por uma equipe de traders experientes com experiência comercial de mais de 13 anos,       Quantum Breakout PRO       foi projetado para impulsionar sua jornada comercial a novos patamares com sua estratégia de zona de fuga inovadora e dinâmica. O Quantum Breakout Indicator lhe dará setas de sinal em zonas de breakout com 5 zonas-alvo de lucro e su
Golden Spikes Detector
Batsirayi L Marango
3.25 (4)
Golden Spikes Detector Este indicador é baseado em uma estratégia avançada principalmente para picos de negociação nos índices Boom e Crash. Algoritmos complexos foram implementados para detectar apenas entradas de alta probabilidade. Ele alerta sobre possíveis entradas de compra e venda. Para negociar picos na corretora Deriv ou Binária, receba apenas os alertas Buy Boom e Sell Cash. Ele foi otimizado para ser carregado em um período de 5 minutos, embora a análise de vários períodos de tempo se
Easy Breakout MT5
Mohamed Hassan
5 (3)
After your purchase, feel free to contact me for more details on how to receive a bonus indicator called VFI, which pairs perfectly with Easy Breakout for enhanced confluence!     Easy Breakout MT5   is a powerful price action trading system built on one of the most popular and widely trusted strategies among traders: the   Breakout strategy ! This indicator delivers crystal-clear Buy and Sell signals based on breakouts from key support and resistance zones. Unlike typical breakout indicators
Advanced Supply Demand MT5
Bernhard Schweigert
4.5 (14)
Atualmente com 33% de desconto! A melhor solução para qualquer Trader Novato ou especialista! Este indicador é uma ferramenta de negociação exclusiva, de alta qualidade e acessível porque incorporamos uma série de recursos proprietários e uma nova fórmula. Com esta atualização, você poderá mostrar fusos horários duplos. Você não só será capaz de mostrar um TF mais alto, mas também mostrar ambos, o TF do gráfico, MAIS o TF mais alto: MOSTRANDO ZONAS ANINHADAS. Todos os traders de Oferta e Demanda
Waterfall by Kratus
Justine Kelechi Ekweh
5 (1)
Overview The Waterfall Trading Indicator is a powerful momentum detection tool designed to identify high-probability trading opportunities across multiple timeframes. Built on pure price action analysis, this indicator provides clear, non-repainting signals that are especially effective for binary options and forex trading. Key Features Non-Repainting Signals : Based on real-time price action, ensuring reliable trade signals Multi-Timeframe Compatibility : Effective across all timeframes, with o
KT Renko Patterns MT5
KEENBASE SOFTWARE SOLUTIONS
KT Renko Patterns scans the Renko chart brick by brick to find some famous chart patterns that are frequently used by traders across the various financial markets. Compared to the time-based charts, patterns based trading is easier and more evident on Renko charts due to their uncluttered appearance. KT Renko Patterns features multiple Renko patterns, and many of these patterns are extensively explained in the book titled Profitable Trading with Renko Charts by Prashant Shah. A 100% automated
Italo Volume Indicator MT5
Italo Santana Gomes
4.73 (15)
BUY INDICATOR AND GET EA FOR FREE AS A BONUS + SOME OTHER GIFTS! ITALO VOLUME INDICATOR  is the best volume indicator ever created, and why is that? The Indicator works on all time-frames and assets, indicator built after 7 years of experience on forex and many other markets. You know many volume indicators around the internet are not complete, does not help, and it's difficult to trade, but the Italo Volume Indicator is different , the Italo Volume Indicator shows the wave volume, when market
TPA True Price Action indicator reveals the true price action of the market makers through 100% non-repainting signals strictly at the close of a candle! TPA shows entries and re-entries, every time the bulls are definitely stronger than the bears and vice versa. Not to confuse with red/green candles. The shift of power gets confirmed at the earliest stage and is ONE exit strategy of several. There are available now two free parts of the TPA User Guide for our customers. The first "The Basics"
Primeiramente, vale ressaltar que este Sistema de Trading é um Indicador Não Repintado, Não Redesenho e Não Atrasado, o que o torna ideal tanto para o trading manual quanto para o automatizado. Curso online, manual e download de predefinições. O "Sistema de Trading Inteligente MT5" é uma solução completa de trading projetada para traders novos e experientes. Ele combina mais de 10 indicadores premium e apresenta mais de 7 estratégias de trading robustas, tornando-o uma escolha versátil para dive
Royal Scalping Indicator M5
Vahidreza Heidar Gholami
5 (6)
Royal Scalping Indicator is an advanced price adaptive indicator designed to generate high-quality trading signals. Built-in multi-timeframe and multi-currency capabilities make it even more powerful to have configurations based on different symbols and timeframes. This indicator is perfect for scalp trades as well as swing trades. Royal Scalping is not just an indicator, but a trading strategy itself. Features Price Adaptive Trend Detector Algorithm Multi-Timeframe and Multi-Currency Trend Low
Monster Harmonics Indicator is a harmonic pattern indicator. It recognizes Gartley, Bat, Crab, Butterfly, Cypher, White Swan, Black Swan, Shark and AB=CD patterns. Projected patterns that are not yet completed are recognized, too. Monster even shows the PRZ (Potential Reversal Zone). Users can add their own user defined patterns to Monster. Besides the current pattern, Monster also shows all patterns in the symbols history. Monster will provide alerts for developing patterns. Introduced by H.M.
SEE THE TREND ON EVERY TIME FRAME. INTELLIGENT INDICATOR READS PRICE ACTION TO SPOT TRUE MARKET CYCLES AND TREND. This advanced multi-currency and multi-time frame indicator,   reads trend in real-time   so you always know the trends of the markets   you want to trade.  ​Trend-Viewer Pro has been specifically designed to read the trend of   every time frame   and   every market , simultaneously, making it much easier for you to find markets with   time frame correlation , so you can focus on th
Mais do autor
Previous High and Previous Low in the charts usually forms an area of interest for trading on the chart. Price usually move quickly then stall around these areas. This indicator identify Bars which are highest or lowest of the surrounding bars and extend a line out to visualize it. Extend line for how many bars: Define how many bars to extend the bars to the right of the extreme bar. Width of Extreme: Define how many bars it should be the highest/lowest to the left and right of the bar Keep line
inp_timeframe: Set Timeframe of indicator MA Parameters: (Same as standard moving average indicator) inp_MA_period, inp_MA_shift, inp_MA_method, inp_MA_price: Moving Average Period, Moving Average Shift, Moving Average Method, Moving Average Price Please take note that using a MA_shift of 0 will result in a different result when the indicator is reloaded for higher time frame This indicator only accepts shift>0 This is due to the indicator showing the current time moving average and atr at the c
place a vwap line starting from the line placed on the chart parameters: tick_mode: enable to use ticks instead of bars. this uses a lot more cpu processing power prefix: prefix to add for line created by indicator line_color: set the color of the line created line_style: set the line style of the line created applied_price: set the price of bar to use of the bar std_dev_ratio: set the multiplier for the std dev channel
Filtro:
Sem comentários
Responder ao comentário
Versão 1.21 2024.10.25
Fixes fractal not updating after placing on chart