VPVR Insight MT4
- Indicadores
- Evgeniy Zhdan
- Versão: 1.0
- Ativações: 5
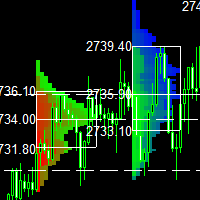
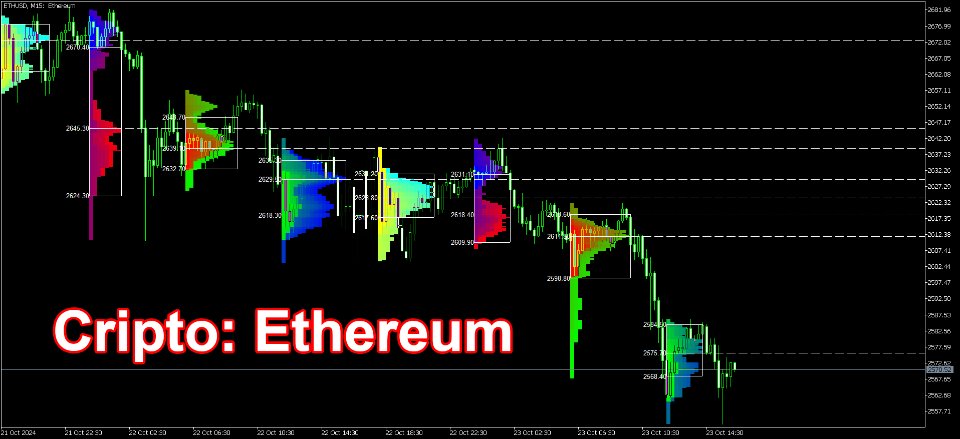
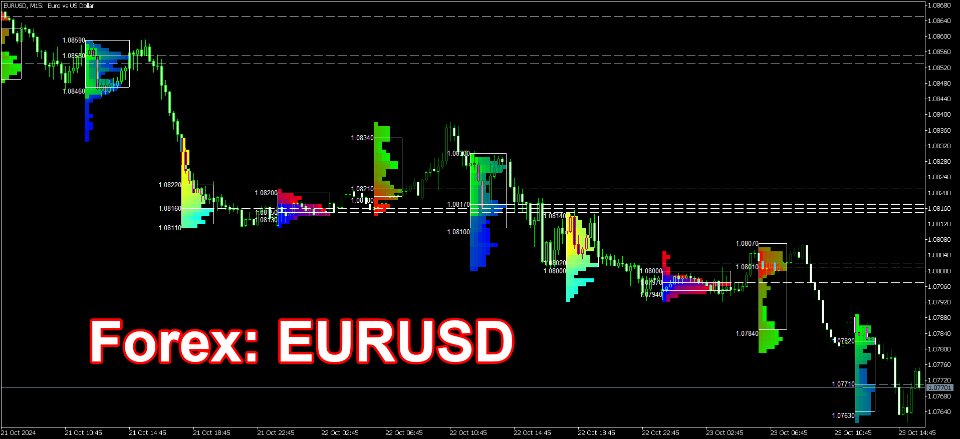
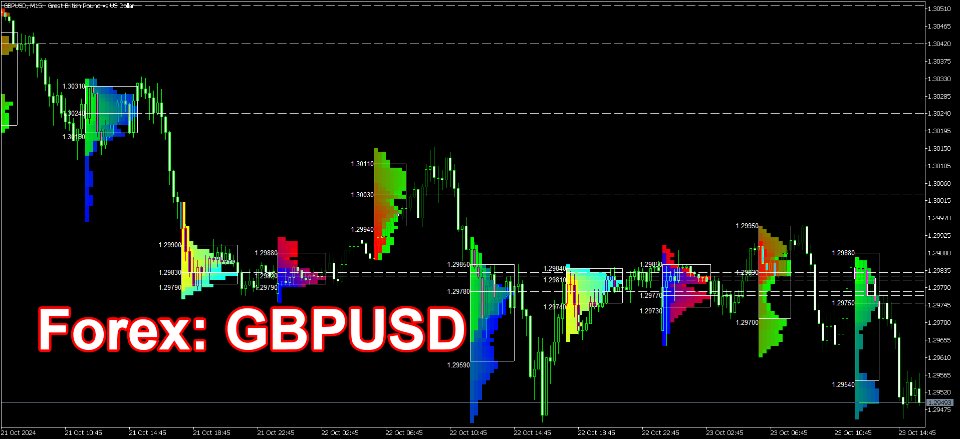
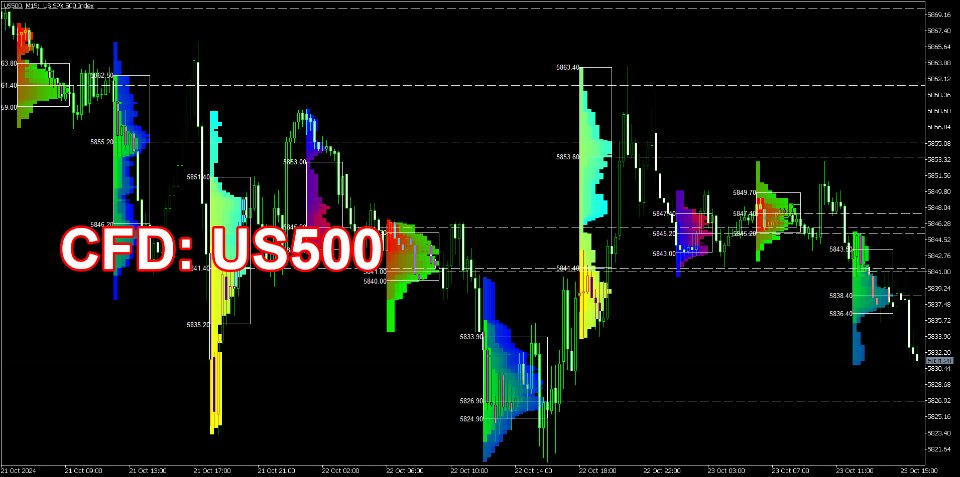
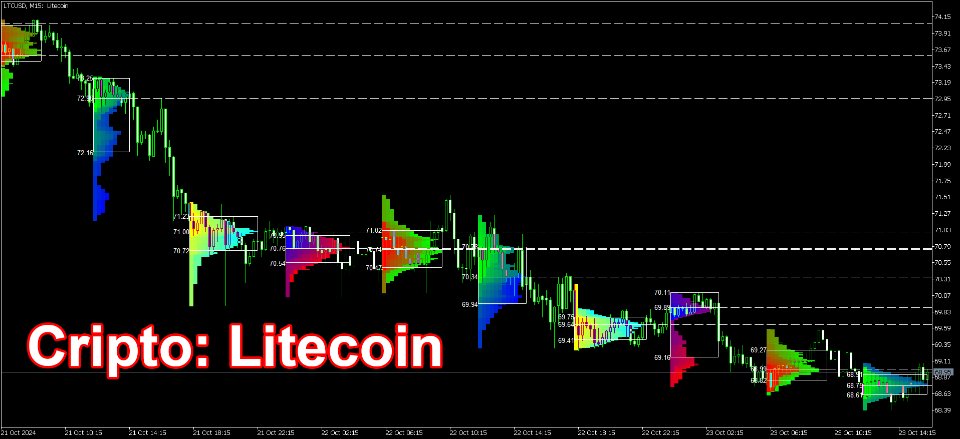
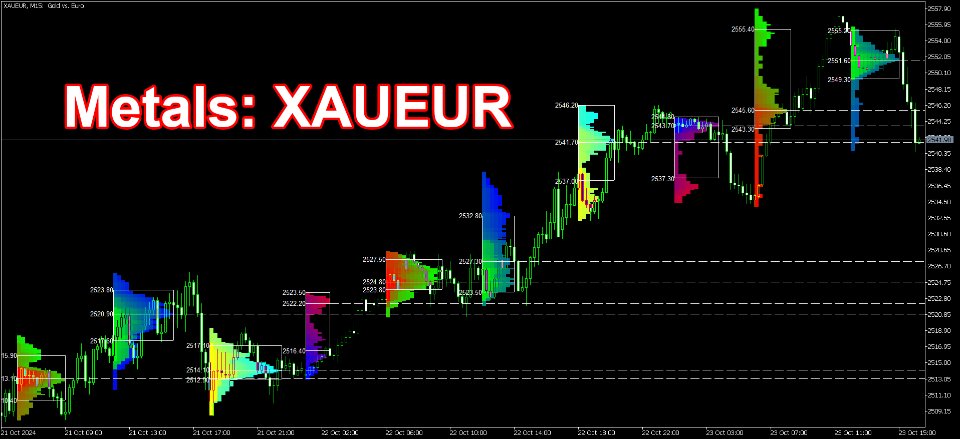
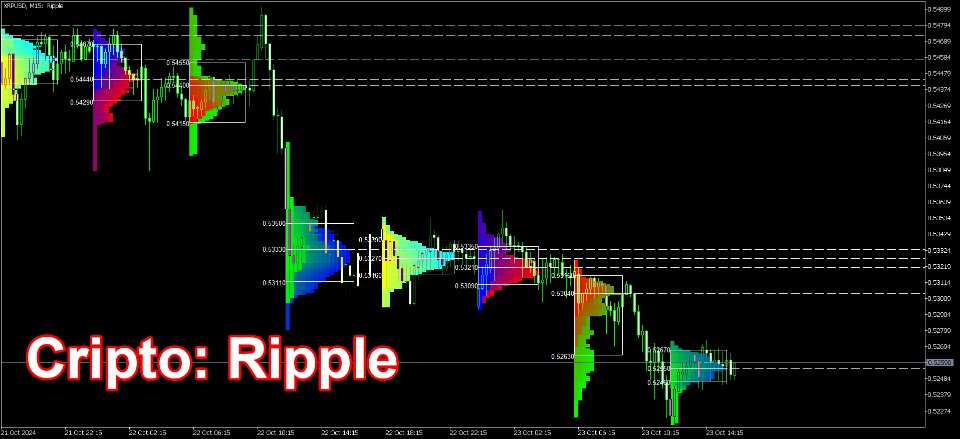
This indicator is a classic implementation of the Market Profile (Volume Profile Visible Range), allowing for the display of price density over time while highlighting the most significant price levels, the value area, and the control price within a specific trading session.
MT5-version: https://www.mql5.com/en/market/product/125308
The indicator can be applied across timeframes from M1 to D1, enabling the analysis of market profiles for daily, weekly, monthly, or intraday trading. Utilizing lower timeframes (from D1) provides greater accuracy, while higher timeframes (i.e., smaller intervals) are recommended for better visibility.
The indicator also allows for the use of free-drawn rectangles to create a custom market profile on any timeframe. To do this, set the "Defines the session period for analysis" option to "Rectangle," and then draw a Rectangle object on the chart of the trading instrument (see the video).
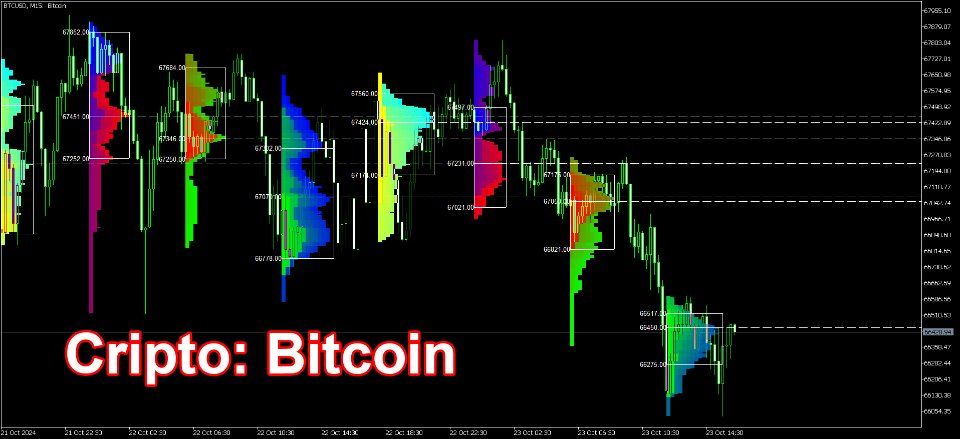
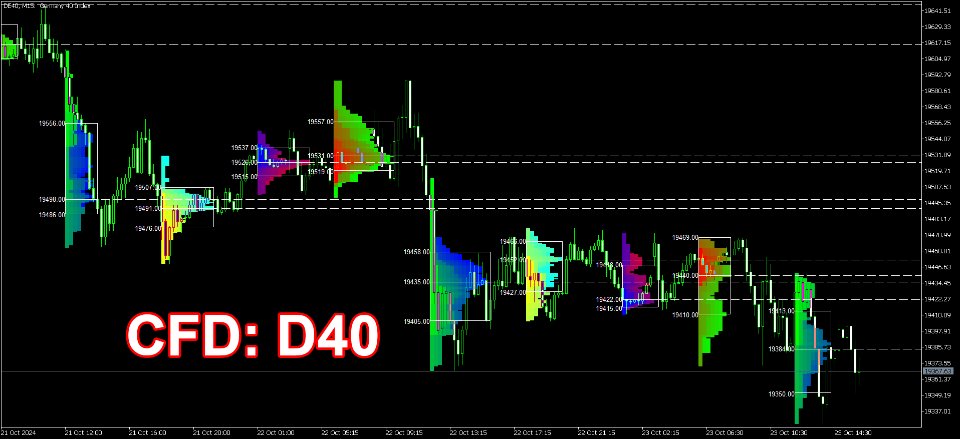
There are six different color schemes available for displaying the profile blocks, and it is also possible to visualize profiles as a simple colored histogram. Additionally, you can customize the profile's color based on market direction (bullish or bearish).
A system of alerts is included to notify users when price levels cross the highs and lows of significant areas and the median line (POC).
The VPVR Insight MT4 indicator helps traders and analysts understand where the highest trading volumes were concentrated. This can be key in identifying important support and resistance levels.
Here are some ways to use VPVR Insight MT4 in trading:
-
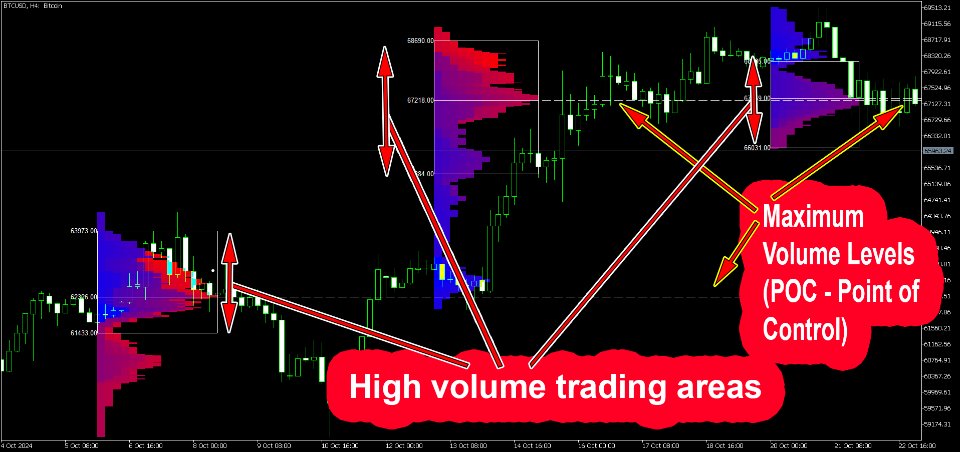
Identifying Key Levels: VPVR helps pinpoint price levels where high trading volumes were concentrated. These levels often serve as strong support or resistance. For example, if the price approaches an HVN (high-volume node), there is a high probability that it will encounter resistance or support at that level.
-
Analyzing the Point of Control (POC): The POC represents the price level with the highest trading volume and often acts as a strong support or resistance level. A breakout of the POC can indicate significant price movement.
-
Identifying Consolidation and Trend Zones: HVNs and LVNs (low-volume nodes) provide insights into where prices have consolidated (high volumes) and where quick movements have occurred (low volumes). Consolidation zones can indicate potential entry or exit levels in the market.
-
Trading Breakouts: LVNs often serve as levels where prices can move quickly. Breakouts through these levels can be utilized for short-term trades. A breakout through an LVN may signal the beginning of a new trend or impulsive movement.
-
Exiting Positions: VPVR can help determine levels at which to close positions. If the price approaches the POC or HVN, this may signal a good opportunity to take profits.
