• Visão global
  • Comentários
  • Discussão

Harmonic Price Patterns

Harmonic Price Patterns

Harmonic price patterns identify the stages of a retracement so that when the pattern is complete, you have a clear buy or sell signal. Retracements are vexing at all times, and any help is always welcome, although, with harmonic price patterns, the orthodoxy is to apply Fibonacci numbers. Again, Fibonacci numbers are not a proven theory, and in fact, there is a great deal of evidence that Fibonacci numbers appear in securities prices, including Forex, only about the number of times as chance would allow. Nevertheless, when a perfect or near-perfect Fibonacci number does appear, plenty of traders will see it and produce the expected outcome, so it does not pay to dismiss Fibonacci-based trading ideas out of hand.

Note that harmonic price patterns are unrelated to classic chart patterns (head-and-shoulders, double top, et al.). The key books on harmonics are by Scott Carney, author of The Harmonic Trader (1999) and Harmonic Trading of the Financial Markets, Volumes 1 and 2 (2010). Harmonics have become increasingly popular in Forex in recent years, and specialized software is now available. Like all trading concepts based on Fibonacci numbers, harmonic pattern identification takes a lot of practice and a lot of re-drawing and re-calculation since the numbers so seldomly hit exactly where they are supposed to. However, a focus on retracements can be helpful in improving trading performance since retracements are where most losses are clustered.

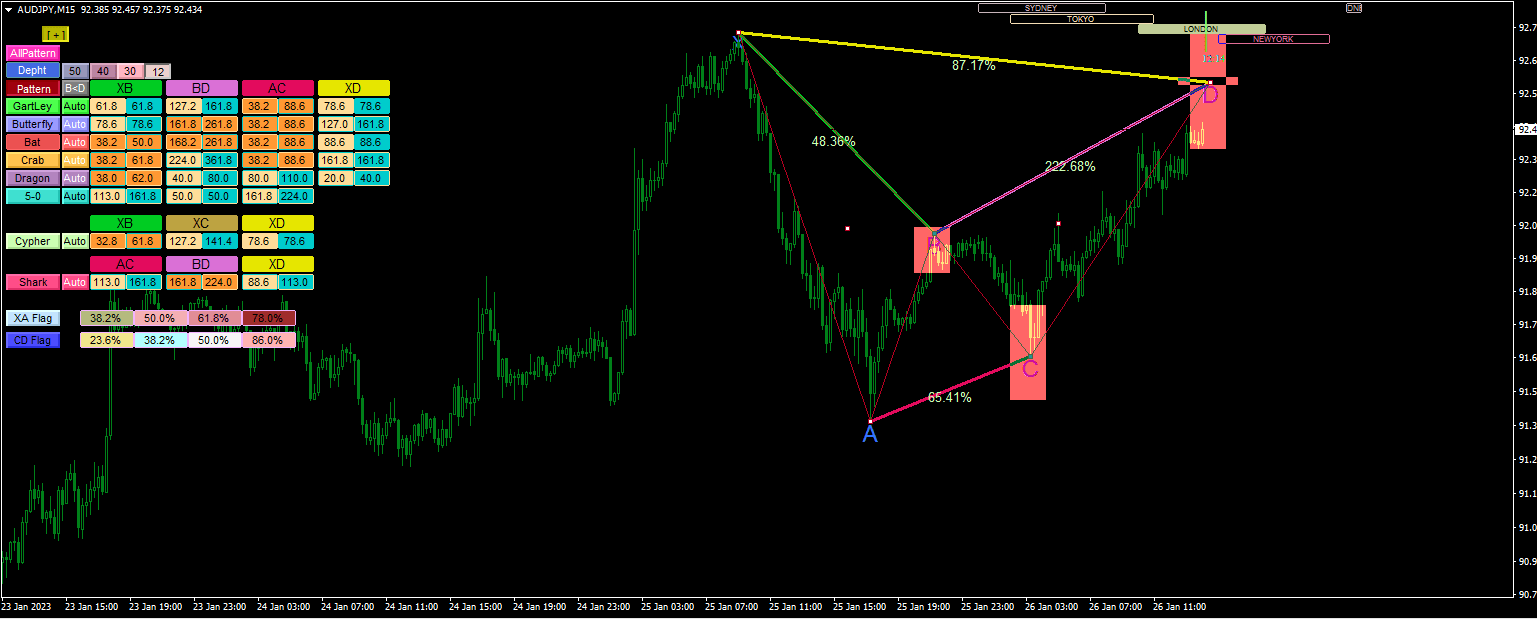
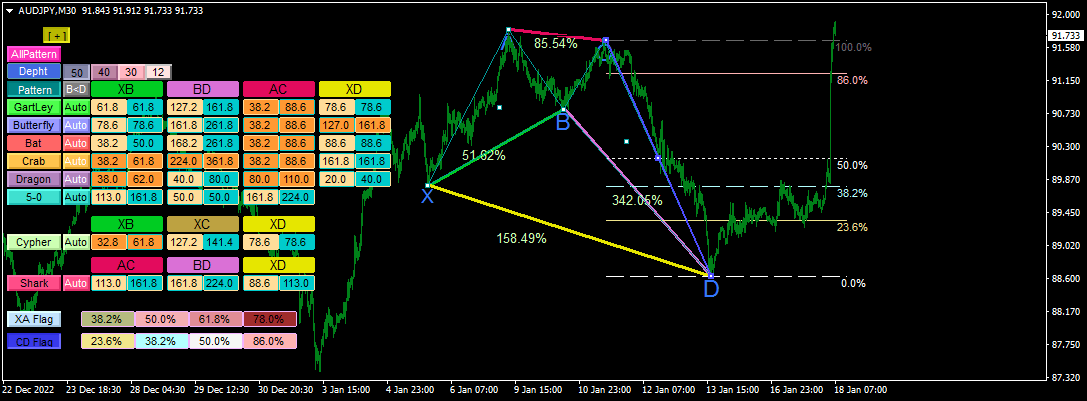
It may be of interest that some people can “see” harmonic patterns and others cannot, even with the help of software that does the hard work of performing the calculations. Proponents of harmonic patterns claim that they appear hundreds of times per day and thousands of times per week, but if that were true, you should be able to pick any chart on any timeframe and find one of the seven or eight standard harmonic patterns within seconds. We can find every other technical phenomenon with no effort at all on any chart, but not harmonic patterns. Therefore, the illustration here has to be a model. See the figure below. It is the basic ABCD pattern, and here is the “Gartley bearish pattern.”  Other patterns are variations of this core concept, including the Bat, Butterfly, Crab, and Shark patterns. Note that the Gartley pattern is named after H.M. Gartley, who wrote a book titled Profits in the Stock Market in 1935. Gartley did not use Fibonacci numbers, although he identified the sequence of price moves.


Mais do autor
Multi OrderBlock
Kourosh Hossein Davallou
Order blocks are essential structures in trading that indicate areas where large institutional traders , like banks and hedge funds, have placed their orders. These blocks represent significant price levels where substantial buying or selling activity has occurred, providing clues about potential market movements. So, why should you, as a trader, care about order blocks? Well, knowing where these big orders are placed can give you a huge advantage. It’s like having a map showing where the treasu
FREE
Pattern Searching
Kourosh Hossein Davallou
Chart patterns are a common tool used by traders to identify potential trading opportunities in the financial markets. These patterns are formed by the price action of a security, and can provide valuable information about the direction in which the price is likely to move. Some of the most common chart patterns include head and shoulders, double tops and bottoms, triangles, and flags and pennants. By analyzing these patterns, traders can make informed decisions about when to enter or exit a tr
FREE
Stochastic RainBow 5
Kourosh Hossein Davallou
A   stochastic   oscillator is a momentum indicator comparing a particular closing price of a security to a range of its prices over a certain period of time. The sensitivity of the oscillator to market movements is reducible by adjusting that time period or by taking a moving average of the result. It is used to generate overbought and oversold trading signals, utilizing a 0-100 bounded range of values. This indicator  show 8 stochastic on one chart.
FREE
StochasticRainBow
Kourosh Hossein Davallou
5 (1)
A stochastic oscillator is a momentum indicator comparing a particular closing price of a security to a range of its prices over a certain period of time. The sensitivity of the oscillator to market movements is reducible by adjusting that time period or by taking a moving average of the result. It is used to generate overbought and oversold trading signals, utilizing a 0-100 bounded range of values. This indicator  show 15 stochastic on one chart.
FREE
MarketSession
Kourosh Hossein Davallou
The 24-hour forex (FX) market offers a considerable advantage for many institutional and individual traders because it guarantees liquidity and the opportunity to trade at any conceivable time. Currencies can be traded anytime but an individual trader can only monitor a position for so long, however. Most traders can't watch the market 24/7 so they're bound to miss opportunities or worse. A jump in volatility can lead to a movement against an established position when the trader isn't around. A
FREE
Price Aleart
Kourosh Hossein Davallou
4.5 (2)
Indicador Price Alert envia alertas sonoros quando o preço atinge determinados níveis definidos pelo trader. Se você usar o recurso de alerta via e-mail, não se esqueça de definir as configurações de e-mail na sua janela de opções na plataforma MetaTrader.    Parâmetros de entrada: WhenPriceGoesAbovePIP - se o preço for superior ao atual por uma determinada quantidade de Pips, o alerta será acionado. WhenPriceGoesBelowPIP - se o preço for inferior ao atual por uma determinada quantidade de Pips,
FREE
Price Ladder
Kourosh Hossein Davallou
This indicator is based on the Channel . Input Parameters channel_One - show trend line One on or off. timeFrame_One  - time Frame of channel One . ColorChannel_One  - color of  trend line One. channel_Two - show trend line Two on or off. timeFrame_Two  - time Frame of channel Two . ColorChannel_Two  - color of  trend line Two. channel_Three - show trend line Three on or off. timeFrame_Three  - time Frame of channel Three . ColorChannel_Three  - color of  trend line three. channel_Four - show tr
FREE
Display Multipair
Kourosh Hossein Davallou
This is an indicator that allows displaying three currency pairs in one window. Input Parameters: Symbol1 - first currency pair. symbol1mirrior - mirror display of the first currency pair. s1color - color of the first currency pair. Symbol2 - second currency pair. symbol2mirrior - mirror display of the second currency pair. Symbol3  - third currency pair. symbol3mirrior -  mirror display of the third currency pair. Symbo4  - fourth currency pair. symbol4mirrior - mirror display of the fourth cur
Wolfe Wave
Kourosh Hossein Davallou
This particular methodology. Please note the odd sequence in counting, as you will see, it is necessary for the inductive analysis. By starting with a top we are assured of beginning our count on a new wave. (The reverse would apply for a bearish wave.) The 2 point is a top. The 3 point is the bottom of the first decline. The 1 point is the bottom prior to point 2 (top), that 3 has surpassed. The 4 point is the top of the rally after point 3. The 5 point is the bottom after point 4 and is likely
Daily GBPUSD trade
Kourosh Hossein Davallou
Our strategy relies on a choppy movement on most Forex pairs during the Asian session. Most traders in London sleep when the Sun shines over the Pacific and this results to a very slow movement of GBPUSD pair between 9:00 PM GMT and 7:00 AM GMT. Buy order: Place a buy-stop order just five  pip above the upper band. Place a stop loss just one pip below the lower band. Place a profit target at the upper LawnGreen Arrow. Sell order: Place a sell-stop order just five pip below the lower band. Place
Breakout trade
Kourosh Hossein Davallou
Breakout System   This indicator is based on the trend line and breakthrough. Pair: EURUSD, GBPUSD. Timeframe: M15 Or H1. Input Parameters AlertsOn  - alert on or off. TrendLine  - show trend line. TrendLineStyle  - style of trend line. UpTrendColor  - color of up trend. DownTrendColor  - color of down trend. ShowTakeprofit  - show take profits. ShowTakeprofitStyle  - style of take profit. UpperTakeprofitColor  - color of up take profit. LowerTakeprofitColor  - color of down take profit.
Week Pivot
Kourosh Hossein Davallou
Weekly Pivot   There are a lot of advantages when trading with support and resistance lines, and they should be a staple in every trader's arsenal. Another effective method of deriving multiple horizontal based support and resistance lines is using a formula derived from yesterday's High, Low and Close bar. The formula maps out pivot point levels consisting of the pivot, and three levels of support and resistance, and these levels can be traded much the same way as trading with the regular suppo
Forex Tools
Kourosh Hossein Davallou
The indicator is based on several useful indicators in the multi time frames that help us chart and table and alert.     This demo version and fix parameters. The full version can be downloaded at following address. https://www.mql5.com/en/market/product/34745  The various parameters used in this indicator and the default ones are as follows. ·     Moving Average Mode:     LMMA ·         Moving Average Period One:      4 ·         Moving Average Period Two:       8 ·         Moving Average
FREE
Forex Tools X
Kourosh Hossein Davallou
The indicator is based on several useful indicators in the multi time frames that help us chart and table and alert.   The various parameters used in this indicator and the default ones are as follows. ·     Moving Average Mode:     LMMA ·           Moving Average Period One:        4 ·           Moving Average Period Two:         8 ·           Moving Average Period Three:     15 ·           Moving Average Period Four:       30 ·           Moving Average Period Five:          80 ·           Mo
Only NonFarm Payroll Trade 4
Kourosh Hossein Davallou
Only NonFarm Payroll Trade   The employment situation is a set of labor market indicators. The unemployment rate measures the number of unemployed as a percentage of the labor force. Non-farm payroll employment counts the number of paid employees working part-time or full-time in the nation's business and government establishments. The average workweek reflects the number of hours worked in the non-farm sector. Average hourly earnings reveal the basic hourly rate for major industries as indicate
Daily GBP expert
Kourosh Hossein Davallou
Daily GBPUSD trade   Our strategy relies on a choppy movement on most Forex pairs during the Asian session. Most traders in London sleep when the Sun shines over the Pacific and this results to a very slow movement of GBPUSD pair between 9:00 PM GMT and 7:00 AM GMT. Input Parameters: Auto GMT shift extern int Broker_GMT_Shift = 0;//Manual Broker GMT shift extern int London_Night = 21; //London Night extern int London_Open = 7; //London Open
ForexTools
Kourosh Hossein Davallou
This Indicator works based on several well-known Technical Indicators in different time frame Works. These Technical Indicators include:           Moving Averages (MA)           Average Directional Index (ADX)           Parabolic Stop and Reverse (SAR)         Moving Average Convergence Divergence (MACD)         Commodity Channel Index (CCI)           Oscillator of a Moving Average (OsMA )           Momentum(MOM)           Relative Strength Index (RSI)           Williams' Percent Range  (WPR)
ForexToolsFree
Kourosh Hossein Davallou
This Indicator works based on several well-known Technical Indicators in different time frame Works. These Technical Indicators include: ·          Moving Averages(MA) ·          Average Directional Index (ADX) ·          Parabolic Stop and Reverse (SAR) ·          Moving Average Convergence Divergence (MACD) ·          Commodity Channel Index (CCI) ·          Oscillator of a Moving Average (OsMA) ·          Momentum(MOM) ·          Relative Strength Index (RSI) ·          Williams' Percent Rang
FREE
CurrencyMeter
Kourosh Hossein Davallou
Medidor de moeda  Ao negociar em Forex, negociamos um par de moedas no momento. Por exemplo EUR / USD. Se permanecermos longos no EUR / USD, significa que esperamos que o EUR ganhe força em relação ao USD. Se estivermos com pouco EUR / USD, significa que esperamos que o EUR enfraqueça em relação ao USD. Você deve estar familiarizado com esse conceito. O principal dos pares é que eles apenas indicam a força de uma moeda em relação a outra. Se vemos o EUR / USD subindo, é porque o EUR está forta
Three Channel
Kourosh Hossein Davallou
5 (1)
The Price Channel pattern trading strategy is one of the smartest ways to make money trading. The Price Channel pattern represents two trend lines positioned above (channel resistance) and below (channel support) the price. The  price action  is contained between these two parallel trendlines. The separation between the two trendlines needs to be wide enough if you want to trade inside the Price Channel Pattern. If this is the case, you can buy at the channel support level and sell at the channe
Multi Andrew PitchFork
Kourosh Hossein Davallou
5 (1)
ANDREW’S PITCHFORK TRADING STRATEGY       Essentially, Andrew’s Pitchfork is a tool for drawing price channels. While two lines surrounding price are usually enough to draw a channel, the Pitchfork has an extra line. It is the median line or the handle of the Pitchfork.     The median line is central to this trading method. This is why Andrew’s Pitchfork is also known as the Median Line Method. TRADING RULES      There are many ways to trade using Andrew’s Pitchfork but the basic idea is that pr
PriceActionDetector
Kourosh Hossein Davallou
Price Action translates as "price movement." Proponents of technical analysis believe that the price takes into account everything that happens on the market. Therefore,   indicators   and advisers are not needed, since they are calculated based on historical price data and can be very late. By the time the indicator signal triggers, the price direction may already have changed. Those indicators that are trying to predict the price direction are often redrawn. All this leads to unnecessary losse
Visual Trading Demo
Kourosh Hossein Davallou
With this tool you can easily draw lines on the chart and the trade is done easily. The steps are as follows: First: Draw the buy and sell lines on the chart. Second: Draw the profit and loss lines on the chart. Third: Specify the volume of the transaction you want to trade. Fourth: Activate the lines. Warning When moving lines, be careful not to make a wrong trade. Expert easily trades you. This is a DEMO version and can only be used on EURUSD . You can check the final version below: https://
FREE
Visual Trading
Kourosh Hossein Davallou
With this tool you can easily draw lines on the chart and the trade is done easily. The steps are as follows: First:   Draw the buy and sell lines on the chart. Second:   Draw the profit and loss lines on the chart. Third:   Specify the volume of the transaction you want to trade. Fourth:   Activate the lines. Warning When moving lines, be careful not to make a wrong trade. Expert easily trades you.  You can check out the ٍِDEMO version below : https://www.mql5.com/en/market/product/55493
Multi Fair Value Gap
Kourosh Hossein Davallou
A Fair Value Gap (FVG) in Forex trading is essentially the difference between the current market price of a currency pair and what it's believed to be worth based on economic factors or reversion to the mean idea in technical analysis. Market price deviates significantly from this estimated "fair value," it can signal potential trading opportunities. Several factors can cause an FVG to appear. It often arises from market sentiment, economic news, or geopolitical events that temporarily push a cu
On Click Trade
Kourosh Hossein Davallou
Este é um Expert Advisor que permite abrir e modificar posições e ordens através do mouse (com Stop Loss, Take Profit). Trabalhar com este Expert Advisor requer que seja definido o tamanho do lote, take profit e stop loss para as posições. Para ordens pendentes vocÊ precisa definir o tamanho do lote, take profit, stop loss e distância em pips. Este Expert Advisor tem apenas um parâmetro de entrada - cor de fundo.
Moving Average RAINBOW
Kourosh Hossein Davallou
Moving Average RAINBOW Forex traders use moving averages for different reasons. Some use them as their primary analytical tool, while others simply use them as a confidence builder to back up their investment decisions. In this section, we'll present a few different types of strategies - incorporating them into your trading style is up to you! A technique used in technical analysis to identify changing trends. It is created by placing a large number of moving averages onto the same chart. When a
Three Channel 5
Kourosh Hossein Davallou
The Price Channel pattern trading strategy is one of the smartest ways to make money trading. The Price Channel pattern represents two trend lines positioned above (channel resistance) and below (channel support) the price. The price action is contained between these two parallel trendlines. The separation between the two trendlines needs to be wide enough if you want to trade inside the Price Channel Pattern. If this is the case, you can buy at the channel support level and sell at the channel
Multi Andrew PitchFork 5
Kourosh Hossein Davallou
Multi Andrew PitchFork   ANDREW’S PITCHFORK TRADING STRATEGY       Essentially, Andrew’s Pitchfork is a tool for drawing price channels. While two lines surrounding price are usually enough to draw a channel, the Pitchfork has an extra line. It is the median line or the handle of the Pitchfork.     The median line is central to this trading method. This is why Andrew’s Pitchfork is also known as the Median Line Method. TRADING RULES      There are many ways to trade using Andrew’s Pitchfork but
Iranian stock market
Kourosh Hossein Davallou
5 (1)
Smart money is a powerful currency. This money is available to major investors who can identify, predict or even generate capital movements ahead of others. This money can flow into financial and capital markets and create dramatic price changes in various stocks. Therefore, detecting smart cash flow, which usually enters the market in a coherent manner and confronts the volume and value of transactions in a market with high returns, is one of the methods that some investors use to invest. But h
FREE
Filtro:
Sem comentários
Responder ao comentário